
The 1-Minute Scalp Strategy for Active Day Traders

In this article10 sections
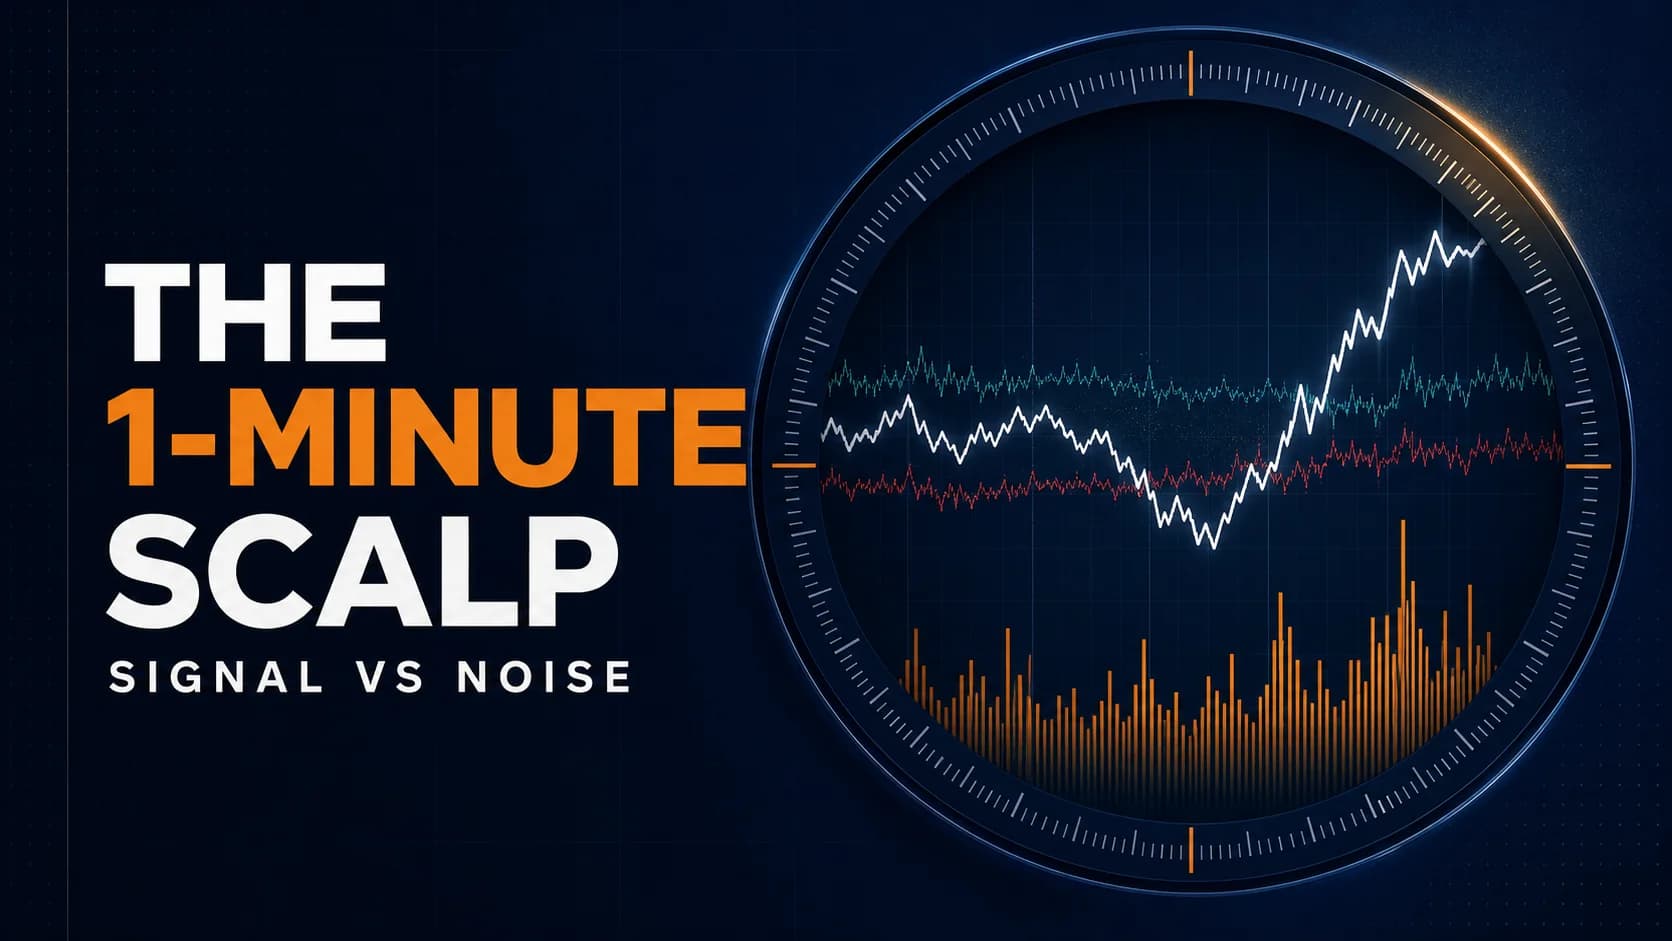
Zoom into any stock's chart far enough and some of what looks like a meaningful price move is just the price mechanically bouncing between the bid and the ask, with nothing informational behind it at all. That's not a minor technical footnote for a strategy built entirely on the 1-minute candle — it's the central problem this timeframe has to solve before any entry rule matters.
What is the 1-minute scalp strategy? The 1-minute scalp strategy involves entering and exiting trades based on price action read directly from 1-minute candles, typically holding positions for a few minutes at most. It's this hub's most compressed application of pullback-based momentum trading, and the one most exposed to a specific kind of statistical noise that longer timeframes mostly average away. Readers who need a refresher on moving averages should start there before this deeper treatment.
Why the Shortest Timeframe Needs Its Own Warning Label
This hub's scalping introduction covers the mindset and tools this style demands broadly. What deserves separate, dedicated treatment is a problem specific to trading on the 1-minute chart itself: at this level of granularity, a meaningful fraction of the price movement visible on the chart isn't a genuine shift in value at all.
Roll's foundational 1984 study established why. In an efficient market, trading costs — the bid-ask spread — force successive observed price changes to show negative serial dependence, because a trade executing at the bid followed by one executing at the ask (or vice versa) creates the appearance of price movement even when the stock's actual value hasn't changed at all. This "bid-ask bounce" is a mechanical artifact of how trades get recorded, not a reflection of new information reaching the market.
That distortion doesn't fade at longer timeframes — it gets measurably worse the shorter the timeframe gets. Andersen, Bollerslev, Diebold, and Labys's 2003 study on realized volatility documented this directly using a tool now standard in market microstructure research: sampling the same price series at progressively higher frequencies shows measured volatility increasing as the sampling interval shrinks, not because the stock is genuinely more volatile at that resolution, but because microstructure noise — bid-ask bounce among its causes — contaminates the signal more heavily the finer the slice. A 1-minute chart sits close to the noisiest end of what a retail trader can realistically watch and act on.
What Separates Genuine 1-Minute Signal From Bounce Noise
None of this means the 1-minute chart is useless — genuine intraday momentum research, covered in more depth in this hub's general momentum guide, has found that strong early-session price action carries real predictive information about the rest of the session, particularly on high-volume days. The skill this timeframe demands is telling that genuine signal apart from the noise Roll's research describes, rather than reacting to every candle as if it carries equal weight.
Two practical filters do most of that work. First, real volume: a candle built from dozens or hundreds of actual trades reflects broad participation, while a candle built from a handful of prints is far more exposed to bid-ask bounce dominating the observed price change. Second, real range: a candle with a body that meaningfully exceeds the stock's typical spread represents an actual price move, while a candle whose entire range is comparable to the spread itself may be showing bounce rather than movement.
Neither filter has to be complicated to apply in practice. A trader watching a stock's typical 1-minute volume and typical spread over the first several minutes of a session builds a rough baseline quickly, and candles that stand out clearly above that baseline — in both volume and range — are the ones worth treating as potential signals. Candles that blend into the ordinary noise floor of that baseline are the ones this setup is specifically built to filter out rather than react to.
The Setup Specification: Eight Rules for Trading the 1-Minute Chart
Every component below is a hard rule, built specifically around filtering genuine signal from the noise this timeframe is most exposed to.
- Component
- Market Conditions Required
- Rule
- A stock already showing genuine directional momentum, ideally confirmed on a slightly higher timeframe or by a fresh catalyst, with real sustained volume visible on the 1-minute chart itself.
- Component
- Time of Day
- Rule
- Most reliable during the most liquid parts of the session — the first one to two hours, or immediately after a fresh catalyst; avoid relying on 1-minute signals during the thin, low-participation midday window.
- Component
- Stock Selection Criteria
- Rule
- Volume high enough that individual 1-minute candles reflect dozens of trades or more, not a handful of prints; a spread narrow relative to the stock's typical candle range.
- Component
- Entry Trigger
- Rule
- Enter on a pullback to a fast-moving reference (commonly the 9 EMA) that holds and closes with a real-bodied candle — not a thin, indecisive one — confirming genuine participation rather than bounce.
- Component
- Stop Loss
- Rule
- Below the low of the confirming pullback candle.
- Component
- Initial Profit Target + Scaling
- Rule
- A small, specific target scaled quickly given the compressed timeframe — often a few cents to a low single-digit percentage move — rather than holding for a large move this timeframe rarely delivers cleanly.
- Component
- Trade Management
- Rule
- Manage and exit fast; a 1-minute setup that hasn't worked within a few candles has usually already told you what it's going to do.
- Component
- Invalidation Criteria
- Rule
- A break of the pullback low, or a confirming candle that turns out to be thin and unconvincing on closer inspection — treat the latter as a sign the "signal" may have been noise.
| Component | Rule |
|---|---|
| Market Conditions Required | A stock already showing genuine directional momentum, ideally confirmed on a slightly higher timeframe or by a fresh catalyst, with real sustained volume visible on the 1-minute chart itself. |
| Time of Day | Most reliable during the most liquid parts of the session — the first one to two hours, or immediately after a fresh catalyst; avoid relying on 1-minute signals during the thin, low-participation midday window. |
| Stock Selection Criteria | Volume high enough that individual 1-minute candles reflect dozens of trades or more, not a handful of prints; a spread narrow relative to the stock's typical candle range. |
| Entry Trigger | Enter on a pullback to a fast-moving reference (commonly the 9 EMA) that holds and closes with a real-bodied candle — not a thin, indecisive one — confirming genuine participation rather than bounce. |
| Stop Loss | Below the low of the confirming pullback candle. |
| Initial Profit Target + Scaling | A small, specific target scaled quickly given the compressed timeframe — often a few cents to a low single-digit percentage move — rather than holding for a large move this timeframe rarely delivers cleanly. |
| Trade Management | Manage and exit fast; a 1-minute setup that hasn't worked within a few candles has usually already told you what it's going to do. |
| Invalidation Criteria | A break of the pullback low, or a confirming candle that turns out to be thin and unconvincing on closer inspection — treat the latter as a sign the "signal" may have been noise. |
The entry rule's insistence on a "real-bodied" confirming candle is the direct, practical answer to the noise problem described above. A doji or a candle with a tiny real body, sitting right at a pullback level, is exactly the kind of print bid-ask bounce alone could produce — it shows indecision or mechanical noise, not the genuine buying pressure a real continuation signal requires.
Profit targets stay deliberately modest. The entire premise of trading on this timeframe is capturing small, fast moves repeatedly rather than one large move slowly — expecting a 1-minute setup to deliver an outsized move misunderstands what this timeframe is actually built to catch.
A Minute-by-Minute Walk-Through: Trading a Pullback in a Hypothetical Stock
Consider a hypothetical liquid mid-cap stock, ticker HIJ, already trending higher on a mid-morning catalyst with strong, sustained volume on its 1-minute chart. None of the prices or events below are real; they're constructed to show the mechanics in action.
By 9:52 AM, HIJ has printed a series of higher highs and higher lows on the 1-minute chart, each candle showing real range and dozens of prints rather than a handful of thin ones. At 9:53, HIJ pulls back to its 9 EMA near $15.20, and the pullback candle closes at $15.22 with a real body — not a thin doji sitting at the level — on continued volume.
An entry triggers around $15.23, with a stop placed below the pullback candle's low at $15.15. HIJ continues higher over the next several one-minute candles, reaching $15.35 within four minutes. A portion of the position scales out there, with the remainder targeting $15.50 as the move continues, trailing the stop behind each new one-minute higher low. Each of those subsequent candles between $15.23 and $15.35 shows the same real-bodied, real-volume character as the original confirming candle — a detail worth checking rather than assuming, since a genuine continuation should keep showing the same signature that justified the entry in the first place.
By 10:02, HIJ prints a thin, narrow-range candle at a new marginal high — the kind of print that could reflect genuine hesitation or could simply be bounce around a stalling price. Rather than reading meaning into that single ambiguous candle, the position management already in place (trailing stop behind the last genuine higher low) handles the ambiguity without requiring a fresh judgment call on a print that may not carry real information either way.
Managing the Trade at 1-Minute Speed
Trail the stop behind confirmed 1-minute higher lows — candles with real bodies and real volume, not any candle that happens to close above the prior one. The pace of management has to match the pace of the timeframe: a setup that would tolerate a slow, considered reaction on a 15-minute chart needs a faster, more automatic response here.
The one habit worth building deliberately: resist reading significance into every single candle. Some 1-minute prints are going to be noise regardless of how carefully a setup is chosen, and the volume-and-range filters built into the entry criteria exist specifically so that ambiguous candles don't force a decision they don't actually contain enough information to justify.
Where This Strategy Fails: Trading the Noise Itself
The dominant failure mode is treating every 1-minute candle as equally meaningful, entering on thin, low-volume prints that are more consistent with bid-ask bounce than with genuine buying or selling pressure. A setup that looks identical to a real pullback-and-hold pattern can be nothing more than a handful of trades bouncing between the bid and ask with no real conviction behind them, and the research above is specific that this kind of noise is a bigger share of the picture at this timeframe than at any longer one this hub covers. The visual similarity between a genuine signal and a noisy one is exactly what makes this failure mode so persistent — both can look identical on a chart without the volume and range context that actually distinguishes them.
A second, related failure mode is applying this setup in genuinely illiquid names, where the volume and range filters this strategy depends on can't do their job — a thinly-traded stock doesn't generate enough real 1-minute activity to distinguish signal from noise reliably, no matter how carefully the entry criteria are applied.
A third risk is simply the pace itself: at this timeframe, a wrong read compounds into a stopped-out position within a couple of minutes rather than the longer runway a slower setup provides to reassess, which argues for smaller size and tighter, more automatic management than a comparable setup on a longer chart.

Adapting the Setup Across Liquidity Levels
The volume threshold that separates a usable 1-minute candle from a noise-dominated one scales with the stock. A heavily-traded large-cap name generates real 1-minute signal at volume levels that would be meaningless noise in a smaller, less liquid stock — there's no single universal share-count threshold, only the general principle that each candle needs enough genuine trades behind it to outweigh bid-ask bounce.
This setup can be traded on even shorter aggregations — tick charts or sub-minute bars — for traders whose tools and reflexes support it, though the noise problem this guide addresses only intensifies at those finer resolutions, requiring correspondingly stricter volume and range filters to compensate.
Scanning for 1-Minute Scalp Candidates
Manually watching enough stocks in real time to catch a genuine 1-minute pullback pattern isn't practical without a scanning tool built for the job, and picking candidates with genuinely high enough volume to make the timeframe usable in the first place matters more here than for any slower setup on this hub.
Trade Ideas is built to run this kind of real-time filtering as a comprehensive scanning and research platform, surfacing high-volume, actively-moving stocks alongside built-in charting to confirm genuine 1-minute structure on each candidate. The scan narrows the field to names liquid enough for this timeframe; confirming a real-bodied, volume-backed pullback still governs the entry.
Sizing the 1-Minute Scalp Trade Inside a Broader Plan
Because a wrong read at this timeframe resolves quickly, position sizing should reflect the same R-multiple discipline this hub applies throughout, anchored to the pullback candle's low, with size calibrated to a strategy that produces frequent, fast decisions rather than a handful of carefully-considered ones.
The psychological demand here is specific and worth naming directly: sustained, rapid-fire focus without over-interpreting ambiguous candles takes real discipline, and it's easy to let the sheer volume of 1-minute prints create a false sense that every single one deserves a reaction. This hub's guide to trading discipline covers the broader version of resisting that pull. This strategy belongs on the Strategies Hub as this hub's most compressed application of momentum trading — useful specifically because it insists on filtering for real signal at a timeframe where noise is a genuinely larger share of what's visible on the chart.
Common Questions About the 1-Minute Scalp Strategy
Is the 1-minute chart actually less reliable than longer timeframes?
That doesn't make the 1-minute chart unusable, but it does mean treating every candle as equally meaningful is a mistake this specific timeframe is more prone to than a 5-minute or 15-minute chart, where that noise gets averaged out more.
Key Takeaway: Apply stricter volume and range filters on a 1-minute chart than you would on a longer timeframe, precisely because more of what's visible there is noise.
What is "bid-ask bounce" and why does it matter here?
At longer timeframes, this effect gets diluted across many more trades and a much larger real price range; at the 1-minute level, it can represent a meaningful share of what's visible on the chart, which is exactly why the entry criteria here emphasize real volume and real candle range.
Key Takeaway: A candle that could plausibly be explained by bid-ask bounce alone shouldn't be treated as a confirmed signal.
How is this different from the general momentum framework covered elsewhere on this hub?
The underlying pullback-and-continuation logic is shared with this hub's broader momentum content — what's specific here is the added discipline required because of how compressed and noise-prone this exact timeframe is.
Key Takeaway: This is the momentum framework's fastest, most noise-sensitive application, not a separate strategy built on different principles.
Why does volume matter more on a 1-minute chart than elsewhere?
This is a direct, practical consequence of the research on bid-ask bounce and microstructure noise — more trades per candle means more genuine information averaged into that candle's price action, relative to the mechanical noise of individual trades bouncing between the bid and ask.
Key Takeaway: Treat low trade count per candle as a specific red flag on this timeframe, not just a general liquidity preference.
Can this setup work on illiquid stocks?
Applying this exact framework to a thinly-traded stock means the entry criteria can't do the job they're designed for, since there simply isn't enough real activity per candle to distinguish a genuine pullback from a handful of noisy prints.
Key Takeaway: Reserve this setup for genuinely liquid, high-volume names where the underlying filters have real data to work with.
Why are profit targets so modest on this timeframe?
Holding out for a large move on a 1-minute signal often means giving back the gain that was actually available while waiting for something this timeframe wasn't built to deliver in the first place.
Key Takeaway: Match target size to the timeframe — small and frequent here, not large and occasional.
Does trading faster mean reacting to literally every candle?
Fast, disciplined management still means being selective about which candles actually meet the volume and range criteria for a genuine signal, rather than treating speed as a license to act on everything the chart shows.
Key Takeaway: Speed of execution and selectivity about which signals to act on aren't in conflict — both matter simultaneously on this timeframe.
How does this relate to tick charts or sub-minute bars?
Traders whose tools and reflexes support faster aggregations can apply this framework there, understanding that the signal-to-noise ratio only gets more challenging as the timeframe compresses further.
Key Takeaway: Finer than 1-minute isn't automatically better — it raises the same noise problem this guide addresses, just more acutely.
Is there genuine predictive signal at this timeframe at all, or is it mostly noise?
The skill this strategy demands is holding both facts at once: genuine signal exists at this timeframe, and so does a real, well-documented amount of noise, which is exactly why the entry criteria filter for volume and range rather than reacting to price movement alone.
Key Takeaway: Don't resolve the tension by assuming either "it's all noise" or "every candle means something" — both extremes miss what the research actually shows.
How would a trader build a practical baseline for "real" volume and range on a given stock?
This doesn't require a fixed universal number, since a heavily-traded large-cap and a smaller mid-cap will have completely different baselines — what matters is the contrast between an individual candle and that stock's own recent behavior, not a one-size-fits-all threshold applied identically everywhere.
Key Takeaway: Build the baseline from the stock's own recent behavior each session rather than relying on a fixed number that ignores how much that varies stock to stock.
Disclaimer
Article Sources
- Roll (1984), "A Simple Implicit Measure of the Effective Bid-Ask Spread in an Efficient Market", The Journal of Finance - the foundational study explaining how bid-ask bounce creates the appearance of price movement without genuine informational change
- Andersen, Bollerslev, Diebold & Labys (2003), "Modeling and Forecasting Realized Volatility", Econometrica - documents that microstructure noise, including bid-ask bounce, contaminates measured price action more heavily at higher sampling frequencies
- Gao, Han, Li & Zhou (2018), "Market Intraday Momentum", Journal of Financial Economics - documents genuine predictive signal in strong intraday price action, the counterpart to the noise this guide also addresses
Was this helpful?
Be the first to weigh in

Written by
Kazi Mezanur RahmanFounder, independent researcher, and editor of DayTradingToolkit. A one-person publication focused on risk-first trading education and documented tool research. He trades his own capital as a retail trader and combines personal market experience with systematic primary-source research.
Keep Reading
Strategies
The Pro Trader's Playbook for Low-Volume, Low-Volatility Markets
Low volume changes the math on every trade. This guide covers reading real liquidity drops, sizing targets to cover spread cost, and which sessions to sit out.
Beginner’s Guide
Introduction to Scalping: Is Ultra-Short-Term Trading Right for You?
Scalping trading isn't for everyone. Learn what scalping is, the personality traits required, the hidden costs, and how to decide if this ultra-fast trading style fits you.

Strategies
Trading the Breakout of Prior-Day High/Low Levels
PDH and PDL need no formula, just yesterday's range. This guide covers the breakout, the liquidity-sweep fade, and why stops cluster right at these levels.

Strategies
Trading Breakouts From Consolidation: The Volatility Contraction Pattern
The VCP isn't just a volatility squeeze. This guide covers the staged contraction sequence, the pivot point, and why context matters as much as the pattern.
Comments
No comments yet. Be the first to share your thoughts.