
The Footprint Chart Day Trading Strategy

In this article11 sections
A one-minute candle closes green, a small body with a long lower wick. On a normal chart, that's a mildly bullish bar and nothing more. On a footprint chart, the same bar shows something a lot more specific: at the low of the range, 1,850 contracts traded on the bid against only 640 on the ask, a heavy imbalance of selling that the price never broke down through. Buyers absorbed that selling completely, right at the low, and then took the bar green anyway.
That's information a candlestick chart physically cannot show, because a candle only records four prices. A footprint chart records what happened inside the bar, at every price level, broken down by which side was aggressing. It's the difference between reading a summary and reading the transcript.
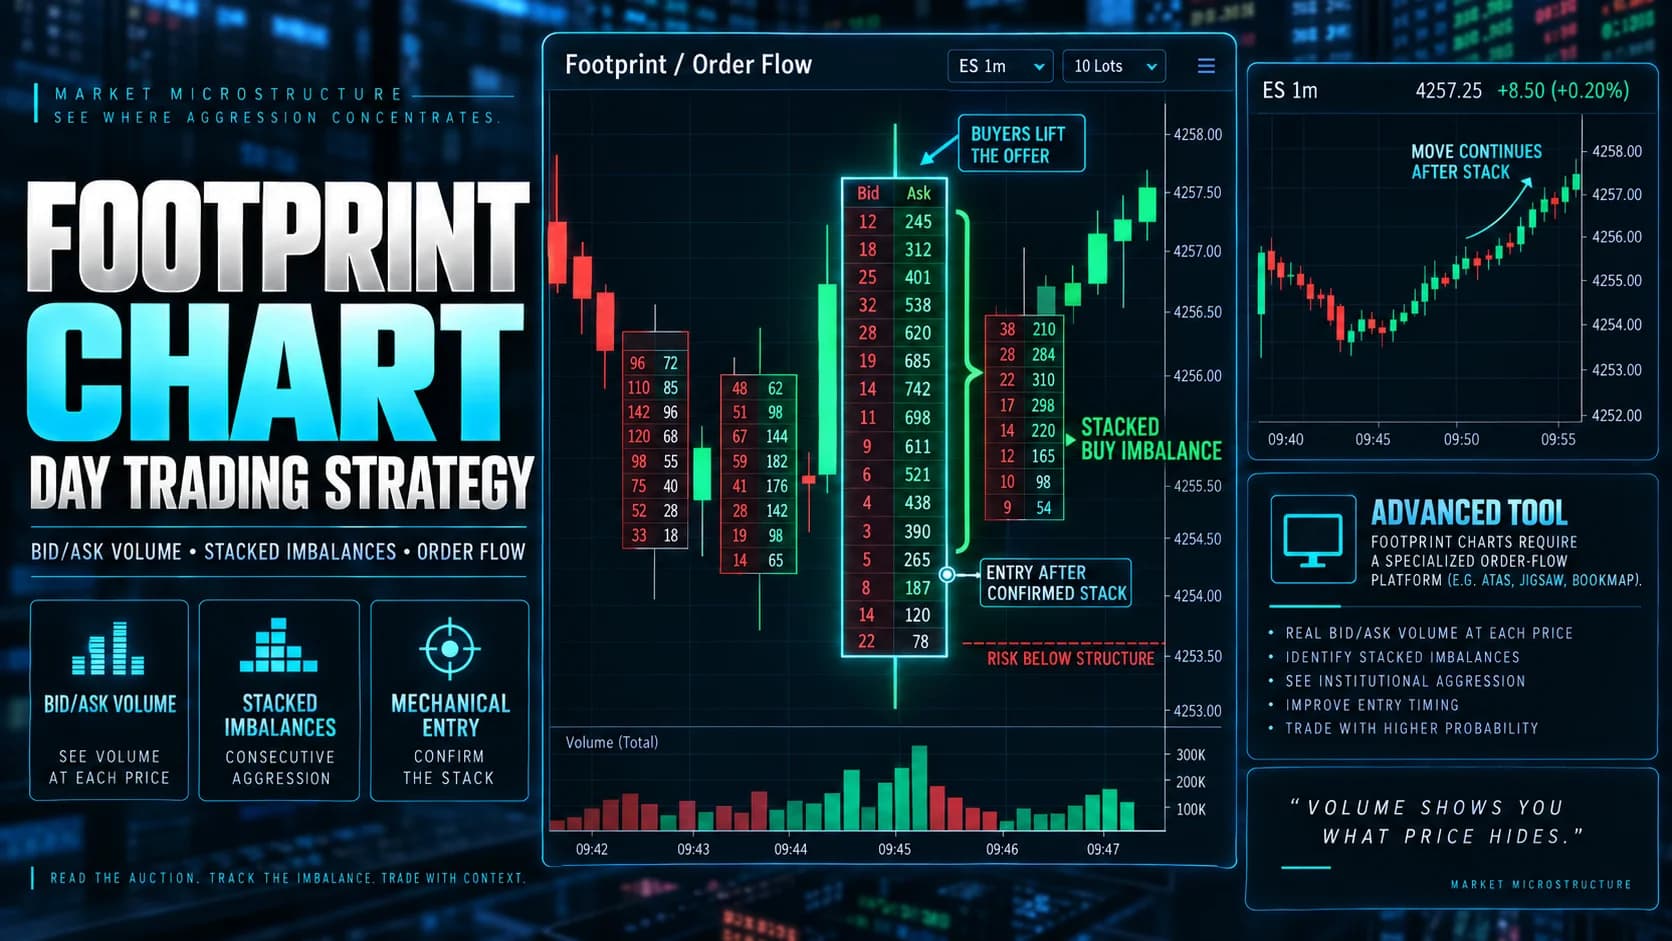
What is a footprint chart? A footprint chart is a price chart where each bar displays the actual volume traded at the bid and the ask at every individual price level within that bar, instead of just showing the open, high, low, and close. It turns a single candle into a small grid of numbers that shows exactly where buying and selling pressure concentrated as the bar formed.
Footprint Charts vs. Raw Time & Sales: Trading Structure Instead of the Stream
Tape reading and footprint charts draw on the same underlying data, individual executed trades, but organize it completely differently. Raw Time & Sales is a linear stream: this trade, then this trade, then this trade, in the order they happened. A footprint chart takes that same stream and reorganizes it by price, aggregating every trade that happened at $48.60 into one number, every trade at $48.65 into another, and so on, stacked vertically as the bar forms.
The tradeoff is real-time immediacy versus structure. A tape reader catches a burst the instant it happens. A footprint trader sees, after the bar closes (or as it updates live, depending on the platform), exactly which prices absorbed the most volume and from which side. Most serious order-flow traders eventually use both: the tape for split-second timing, the footprint for confirming where volume actually built up once the bar is done or nearly done.
Anatomy of a Footprint Bar
A standard footprint bar shows, at each price level the bar touched, two numbers: volume traded at the bid (typically the left number) and volume traded at the ask (typically the right number), often written as "bid x ask," like 640 x 1,850. The difference between the two at any level is that level's delta. Stack every level's delta together and the bar's total delta shows whether buyers or sellers were net more aggressive across the whole bar, even if the close ended up green or red regardless.
Most footprint platforms also highlight imbalances automatically, meaning any price level where one side's volume exceeds the other by some threshold, commonly 300% or more, gets color-coded so it's visible at a glance rather than requiring a trader to do the math on every level of every bar. A single imbalanced level is common and often not meaningful on its own. What matters more is when several consecutive price levels all show imbalance in the same direction, a pattern usually called a stacked imbalance, because that's a sign of persistent, not momentary, one-sided pressure.
Where Footprint Reading Actually Works
Footprint charts were built for and remain most reliable in futures markets, particularly index futures like /ES and /NQ, because futures exchanges report a true aggressor flag on every trade: the exchange itself records whether the buyer or the seller initiated the trade. That's a hard fact, not an estimate.
Equities are messier. Because U.S. stock trading is fragmented across more than a dozen lit exchanges plus off-exchange venues, no single consolidated feed reliably tags every trade's true aggressor the way a single centralized futures exchange does. Most equity footprint tools instead estimate the aggressor side using a trade classification method, commonly a variant of the tick rule, comparing each trade's price to the prevailing quote to infer whether it more likely hit the bid or lifted the offer. That's a well-established, academically studied method, but it's an estimate, not a certainty, and it introduces classification error that simply doesn't exist in futures footprint data.
This doesn't make equity footprint charts useless. It means a trader using them on stocks should treat the underlying bid/ask split as directionally informative rather than perfectly precise, and should weight futures footprint signals somewhat more heavily than the identical-looking pattern on an individual stock.
The Stacked Imbalance Absorption Setup
The clearest tradeable pattern in footprint reading combines a stacked imbalance with a failure to follow through, essentially the footprint-chart version of the exhaustion and absorption patterns covered in the tape reading and Level 2 guides, but confirmed with price-organized volume data instead of a linear print stream or the resting order book.
- Component
- Market Conditions Required
- Rule
- Liquid, actively traded instrument; futures preferred for aggressor-flag accuracy, liquid large-cap equities as the equity alternative
- Component
- Time of Day
- Rule
- 9:30–11:00 AM ET or 3:00–4:00 PM ET (equities); comparable high-volume session windows for futures
- Component
- Stock Selection Criteria
- Rule
- Average daily volume supporting granular per-level footprint data; avoid thin names where per-level volume is too sparse to read
- Component
- Entry Trigger
- Rule
- Three or more consecutive price levels showing a stacked imbalance (300%+ one side) at a session high or low, followed by the next bar failing to extend beyond that level
- Component
- Stop Loss
- Rule
- Beyond the high (short) or low (long) of the bar containing the stacked imbalance
- Component
- Initial Profit Target
- Rule
- The bar's own point of control (the single price level with the most total volume) on the opposing side, or a 1:1 R-multiple
- Component
- Trade Management
- Rule
- Hold while subsequent bars show delta rotating in the trade's favor; trail using each new bar's point of control
- Component
- Invalidation Criteria
- Rule
- A following bar extends through the imbalanced level with matching or greater volume and delta in the original direction
| Component | Rule |
|---|---|
| Market Conditions Required | Liquid, actively traded instrument; futures preferred for aggressor-flag accuracy, liquid large-cap equities as the equity alternative |
| Time of Day | 9:30–11:00 AM ET or 3:00–4:00 PM ET (equities); comparable high-volume session windows for futures |
| Stock Selection Criteria | Average daily volume supporting granular per-level footprint data; avoid thin names where per-level volume is too sparse to read |
| Entry Trigger | Three or more consecutive price levels showing a stacked imbalance (300%+ one side) at a session high or low, followed by the next bar failing to extend beyond that level |
| Stop Loss | Beyond the high (short) or low (long) of the bar containing the stacked imbalance |
| Initial Profit Target | The bar's own point of control (the single price level with the most total volume) on the opposing side, or a 1:1 R-multiple |
| Trade Management | Hold while subsequent bars show delta rotating in the trade's favor; trail using each new bar's point of control |
| Invalidation Criteria | A following bar extends through the imbalanced level with matching or greater volume and delta in the original direction |
The underlying logic mirrors the absorption concept from Level 2 trading: a stacked imbalance at a high or low shows one side was aggressively active at that extreme, but if price fails to extend further in that direction on the next bar, the aggression didn't translate into continued progress. That mismatch between effort (heavy one-sided volume) and result (no follow-through) is the signal.
Walking Through a Live Footprint Read
Picture an /ES futures session where price has been grinding higher, currently trading around 5,842.00, with the session's RVOL running elevated on strong opening momentum. At 9:47 AM ET, a one-minute bar forms with these footprint levels from top to bottom: 5,843.00 shows 210 x 640 (heavy ask-side buying), 5,842.75 shows 180 x 590, 5,842.50 shows 240 x 710, all three levels showing stacked imbalances well above 300% in favor of the ask, meaning aggressive buyers dominated at all three prices. The bar's high is 5,843.00. Total bar delta comes out strongly positive.
That's a textbook bullish stacked imbalance. If the next bar simply continued higher with similar or greater buy-side delta, that would be continuation, not a signal to fade. But suppose instead the 9:48 AM bar opens at 5,842.75, trades up to test 5,843.25, just eight ticks above the prior bar's high, and then reverses, closing back at 5,842.25 with the footprint showing heavier bid-side volume at the top of that bar's range. That failure to meaningfully extend beyond the prior stacked imbalance, despite the prior bar showing such aggressive buying, is the entry trigger.
A trader would look to enter short around 5,842.25 as that second bar closes, with a stop at 5,843.50 (above the failed test high), and an initial target at the point of control from the original imbalanced bar, roughly 5,842.50, with a further target toward the session's prior support near 5,841.00.
Managing a Footprint-Based Trade
Once in the trade, watch each new bar's delta and point of control rather than fixating on price alone. Delta rotating from positive to negative across consecutive bars, meaning sellers are now the more aggressive side bar over bar, confirms the reversal thesis is playing out as expected. A point of control that migrates lower bar by bar shows the market's volume-weighted center of gravity shifting in the trade's favor, which is useful confirmation to hold rather than take an early exit.
Scale partial size at the first target and treat any bar that reclaims and holds above the original stacked imbalance level with strong opposing delta as the invalidation signal, regardless of how much room remains to the stop.
Where Footprint Reading Breaks Down
The biggest limitation is data quality, and it's not the same limitation across asset classes. In futures, the aggressor flag is a hard exchange fact, but even there, a footprint chart is still summarizing a huge amount of activity into a compact grid, and a trader can misread a genuinely informative pattern if bar size (time-based, volume-based, or tick-based) is poorly chosen for the instrument's current volatility. A one-minute bar during a fast, news-driven move can compress so much activity that the footprint becomes hard to parse in real time, while the same one-minute setting looks sparse and uninformative during a slow, quiet session.
In equities, the estimated aggressor classification adds a second, structural source of error on top of that. Academic research into trade classification methods like the tick rule has documented real, measurable misclassification rates, meaning a meaningful share of individual trades get assigned to the wrong side even by well-designed algorithms. That error tends to average out across a large sample, but it can distort the read on any single bar, which is exactly the timeframe a footprint trader is working with.
Footprint charts are also genuinely harder to learn than a standard candlestick chart, and the platforms that support them (order-flow-focused tools like Bookmap, ATAS, Sierra Chart, and NinjaTrader) typically cost more and carry a steeper learning curve than a standard charting package. A trader who hasn't built comfort with tape reading and Level 2 first often finds a footprint chart overwhelming rather than clarifying, since it's essentially a denser, more granular version of the same underlying data.

Choosing Bar Type and Timeframe for Footprint Analysis
Time-based bars (a new bar every minute, for example) are the most familiar but can distort footprint reading because they compress wildly different amounts of real activity into a fixed time window. A one-minute bar during a slow midday session and a one-minute bar during an opening-range breakout contain vastly different amounts of genuine order flow, even though they occupy the same chart space.
Volume-based bars, where a new bar forms after a fixed number of contracts or shares trade regardless of how much time that takes, tend to produce more consistent footprint reads because each bar represents a comparable amount of real activity. Range bars, which form based on price movement rather than time or volume, offer a third option that some order-flow traders prefer for footprint analysis specifically because they naturally slow down during choppy periods and speed up during trending ones. There's no single correct choice, but a trader building a footprint-based approach should deliberately test volume or range bars against the default time-based setting rather than assuming the chart's default configuration is optimal for this kind of reading.
Tools Built for Footprint Analysis
Footprint charting requires a platform specifically built for order-flow visualization, not a standard candlestick charting package. DayTradingToolkit's review of Bookmap covers one of the more widely used platforms for this kind of analysis, including its heatmap and footprint-style views of order flow. Traders evaluating other order-flow-focused platforms like ATAS, Sierra Chart, or NinjaTrader should check DayTradingToolkit's reviews hub for independent coverage before committing to a subscription, since these tools vary significantly in cost, data quality, and learning curve.
Finding which instruments are worth applying footprint analysis to on a given day, meaning where volume and volatility are elevated enough to produce a meaningful, readable footprint, is a separate scanning problem, and Trade Ideas can help surface unusually active names in equities before a trader commits screen time to detailed order-flow analysis on them.
Where Footprint Trading Fits Inside a Complete Trading Plan
Footprint reading is a confirmation and timing layer, most valuable at decision points a trader has already identified through a broader plan, a key level, a session high or low, a VWAP interaction, rather than as a standalone source of trade ideas generated by scrolling through footprint charts looking for interesting patterns. Built into a plan with clear position sizing and defined risk per trade, it sharpens the precision of entries at levels that already matter for other reasons. Treated as a strategy on its own, disconnected from a broader read of market structure, it easily becomes an expensive way to overanalyze noise in a data feed that, especially in equities, isn't as precise as it looks.
Frequently Asked Questions
Why do footprint charts work better on futures than on individual stocks?
That fragmentation means no single equity data feed reliably captures true aggressor intent the way one centralized futures exchange does. Equity footprint data is still useful, but it carries a documented margin of classification error that simply doesn't exist in futures footprint data.
Key Takeaway: Weight futures footprint signals more heavily than identical-looking patterns on individual stocks, given the difference in underlying data quality.
What's the difference between a single imbalanced price level and a stacked imbalance?
Individual imbalanced levels happen constantly and mean relatively little on their own, since any bar can show one level of lopsided activity by chance. A stacked imbalance is a much stronger signal precisely because it requires sustained one-sided aggression across a meaningful price range, not a single print.
Key Takeaway: Treat isolated imbalanced levels as noise and reserve real trading weight for genuine multi-level stacked imbalances.
Should a footprint trader use time-based, volume-based, or range-based bars?
Time-based bars are more familiar and easier to align with the rest of a trading plan, but they compress vastly different amounts of real trading activity into the same visual space depending on how active the session is at that moment. Testing volume or range bars specifically for footprint work is worth the extra setup effort.
Key Takeaway: Don't assume a chart's default time-based bar setting is optimal for footprint analysis; volume or range bars often read more consistently.
How accurate is the estimated bid/ask split on an equity footprint chart?
Academic research into these classification methods has documented measurable error rates, meaning a portion of individual trades get assigned to the wrong side even by well-designed algorithms. That error tends to average out across a large sample of trades but can distort the read on any single bar.
Key Takeaway: Treat an individual equity footprint bar's bid/ask split as directionally useful, not as a precise, guaranteed fact.
Can a footprint chart replace Level 2 and Time & Sales entirely?
Each data view answers a different question. Level 2 shows what's currently offered. The tape shows the live sequence of what just traded. The footprint shows, after the fact or as a bar develops, how that traded volume distributed across price. Traders who rely on order flow seriously tend to use all three together rather than picking one.
Key Takeaway: Footprint charts complement Level 2 and tape reading; they don't substitute for either.
What size stacked imbalance is significant enough to trade?
A 300% imbalance on one isolated level is common. Three or more consecutive levels each showing that degree of imbalance in the same direction is far rarer and far more meaningful. Some traders raise the percentage threshold on lower-volume instruments and lower it on very high-volume ones to keep the signal calibrated to that instrument's typical activity.
Key Takeaway: Prioritize the number of consecutive imbalanced levels over the precise imbalance percentage on any one level.
Do footprint charts work on low-volume or illiquid stocks?
In a thinly traded stock, most price levels within a bar might show only a handful of contracts or shares on each side, which makes the imbalance calculation noisy and unreliable. Footprint analysis is best reserved for instruments with enough real, continuous trading activity to populate each price level with a statistically meaningful amount of volume.
Key Takeaway: Reserve footprint analysis for liquid instruments; thin names don't generate enough per-level volume for a reliable read.
Is footprint chart software expensive, and is it worth it for a beginner?
Footprint data is denser and more granular than either the tape or Level 2 alone, which makes it genuinely difficult to parse without first understanding what the underlying bid and ask volumes actually represent. Adding footprint charts on top of an already-developing order-flow skill set, rather than starting there, tends to produce faster, more durable learning.
Key Takeaway: Build tape reading and Level 2 skills before investing in footprint-specific software; the underlying data is the same, just organized differently.
Disclaimer
Article Sources
- The Price Impact of Order Book Events (Cont, Kukanov, Stoikov) - academic study on how order flow imbalance relates to short-term price movement, the core logic behind footprint-based signals.
- Federal Reserve: Order Flow Imbalances and Amplification of Price Movements - Federal Reserve research on how order flow imbalance amplifies price moves in real markets.
- NBER: Short Sales and Trade Classification Algorithms - working paper examining the accuracy limits of tick-rule-based trade classification, relevant to equity footprint data.
- CME Group: Futures Market Data - exchange source on how futures trades are reported, including aggressor-side data that footprint charts on futures rely on.
Was this helpful?
Be the first to weigh in

Written by
Kazi Mezanur RahmanFounder, independent researcher, and editor of DayTradingToolkit. A one-person publication focused on risk-first trading education and documented tool research. He trades his own capital as a retail trader and combines personal market experience with systematic primary-source research.
Keep Reading
Strategies
The 20 EMA Bounce Strategy: A Trend Continuation Classic
The 20 EMA bounce strategy explained: how to trade established trend pullbacks, set stops using volatility, and avoid trading unproven trends.
Strategies
The RSI Divergence Trading Strategy for Day Traders
Trade RSI divergence with confidence: the difference between regular and hidden divergence, and why structural confirmation matters before entering.
Strategies
The Stochastic Oscillator Day Trading Strategy
Trade the stochastic oscillator correctly: how %K/%D crossovers work, why context beats raw overbought readings, and common failure modes.

Strategies
Trading the Breakout of Prior-Day High/Low Levels
PDH and PDL need no formula, just yesterday's range. This guide covers the breakout, the liquidity-sweep fade, and why stops cluster right at these levels.
Comments
No comments yet. Be the first to share your thoughts.