
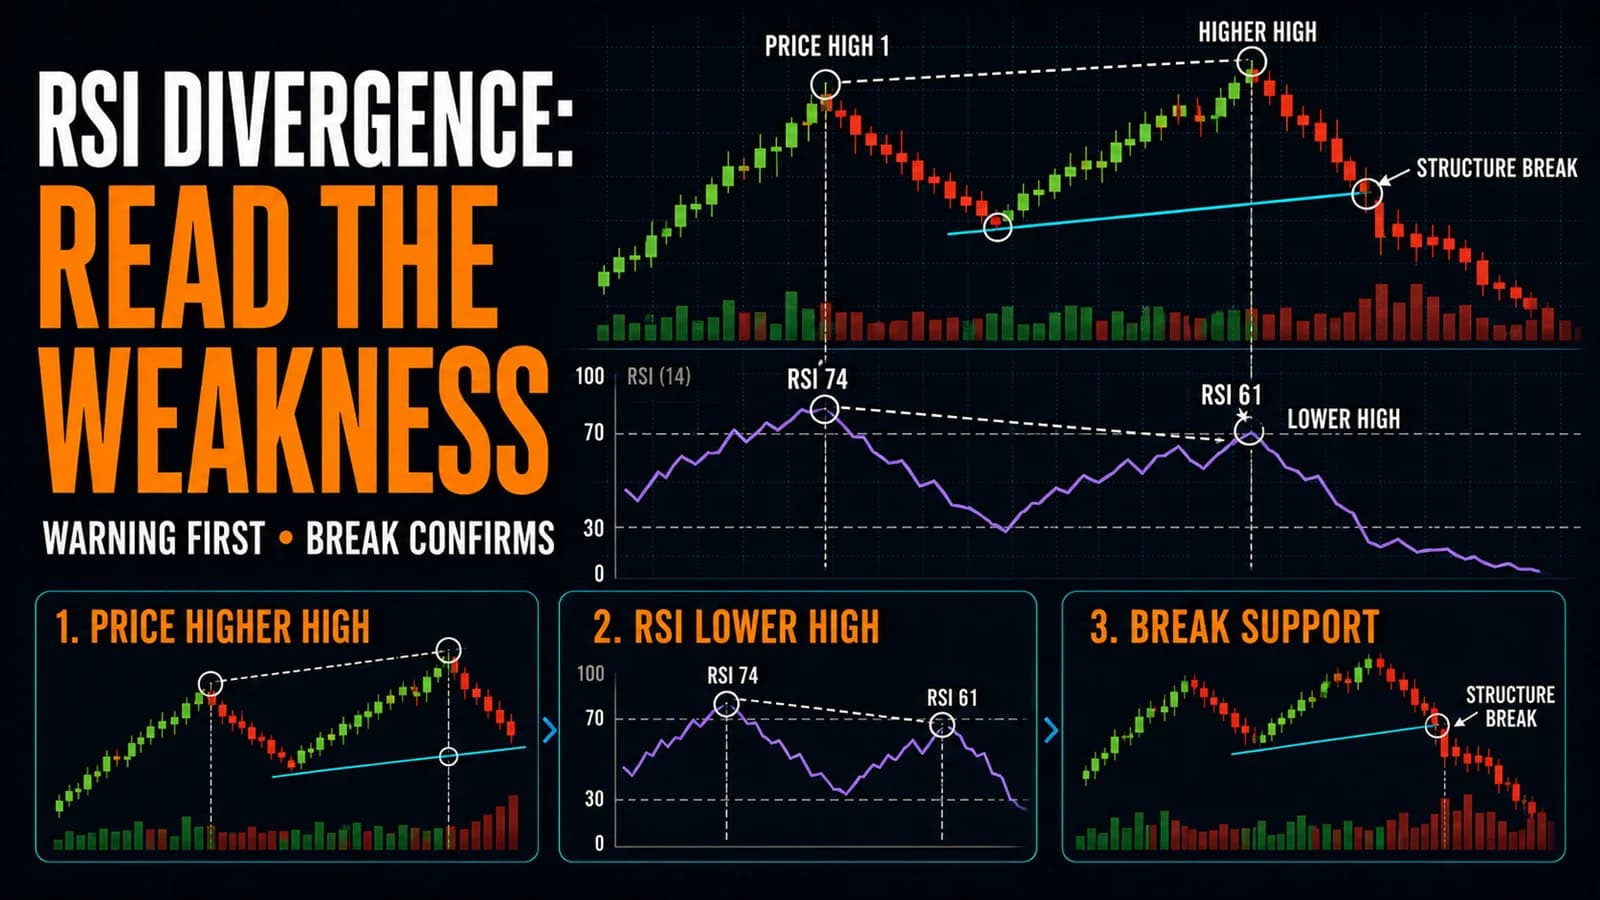
RSI gets reduced to a single job in most beginner explanations: OverboughtA technical condition where an asset has risen so far, so fast that momentum indicators suggest the move may be extended and due for a pullback or consolidation. Most commonly defined as RSI above 70.Read definition → above 70, OversoldA technical condition where an asset has declined so far, so fast that momentum indicators suggest the selling may be exhausted and a bounce or reversal is possible. Most commonly defined as RSI below 30.Read definition → below 30. That framing misses the indicator's more valuable application. Watching how RSI's peaks and troughs compare to price's peaks and troughs over time reveals momentum shifts that a simple overbought or oversold reading never captures on its own.
What is RSI divergence? RSI divergence occurs when price makes a new high or low that the Relative Strength IndexThe Relative Strength Index (RSI) is a momentum oscillator that measures the speed and magnitude of recent price changes on a 0–100 scale — readings above 70 indicate a stock may be overbought and extended to the upside, while readings beloRead definition → fails to confirm with a correspondingly extreme reading, signaling weakening momentum behind the current move. Bearish divergence forms at price highs when RSI fails to match its prior peak, and bullish divergence forms at price lows when RSI fails to match its prior trough, both treated as early warning signs of a potential reversal.
What Wilder Built RSI to Measure
Developed by J. Welles Wilder in 1978, RSI measures the speed and magnitude of recent price changes, expressed on a 0 to 100 scale by comparing the average size of recent gains to the average size of recent losses. The standard reading treats above 70 as overbought and below 30 as oversold, but Wilder's original design was less about a fixed threshold and more about tracking the underlying momentum of price movement over a defined lookback period, typically 14 candles.
Divergence uses that same underlying momentum measurement in a comparative way, rather than relying on the absolute overbought or oversold thresholds. A stock can be technically overbought above 70 on one peak, pull back, then rally to a new price high while RSI only reaches 65 on the second attempt. That comparison, not the absolute overbought reading itself, is what constitutes a bearish divergence and is the more actionable signal for a trader watching for a reversal.
Regular divergence is the classic reversal signal. Bearish regular divergence forms when price makes a Higher HighA higher high occurs when price makes a swing peak that is above the previous swing peak — it's one of the two defining features of an uptrend and indicates buyers are consistently willing to pay more than before.Read definition → while RSI makes a Lower HighA lower high is a swing high that is below the previous swing high — paired with lower lows, it's the second component that confirms a downtrend in market structure, showing that rally attempts are weakening and sellers are maintaining contRead definition →, suggesting the rally is running on fumes even though price itself hasn't shown any weakness yet. Bullish regular divergence forms when price makes a lower low while RSI makes a higher low, suggesting selling pressure is fading even as price grinds to a new low.
Hidden divergence works as a continuation signal rather than a reversal warning, following the same structural logic as the MACD version of the same concept. In an established uptrend, hidden bullish divergence occurs when price makes a higher low while RSI makes a lower low during the pullback, suggesting the retracement is shallower in momentum terms than it looks on the price chart and the uptrend is likely to resume. Traders new to divergence concepts should be careful to distinguish which type they're identifying, since the two point toward opposite trading conclusions despite sharing the same name.
Setup Specification
- Component
- Market Conditions Required
- Rule
- A visible trend with at least two comparable swing highs (bearish divergence) or swing lows (bullish divergence) to compare against RSI readings
- Component
- Time of Day
- Rule
- Applies on any intraday timeframe; divergence patterns generally develop more reliably on 15 minute or higher timeframes than on 1 minute charts
- Component
- Stock Selection Criteria
- Rule
- Liquid stocks with clearly defined swing structure; standard 14-period RSI setting is the common default across most platforms
- Component
- Entry Trigger
- Rule
- A confirmed regular divergence pattern, combined with price actually breaking a nearby support or resistance level, rather than trading the divergence signal in isolation
- Component
- Stop Loss
- Rule
- Above the most recent divergent swing high (for bearish trades) or below the most recent divergent swing low (for bullish trades)
- Component
- Initial Profit Target
- Rule
- The next visible support or resistance level, depending on trade direction
- Component
- Trade Management
- Rule
- Trail once price confirms the reversal with its own structure, such as breaking a prior swing point in the new direction
- Component
- Invalidation Criteria
- Rule
- Price making a new extreme that RSI actually confirms, negating the earlier divergence reading
| Component | Rule |
|---|---|
| Market Conditions Required | A visible trend with at least two comparable swing highs (bearish divergence) or swing lows (bullish divergence) to compare against RSI readings |
| Time of Day | Applies on any intraday timeframe; divergence patterns generally develop more reliably on 15 minute or higher timeframes than on 1 minute charts |
| Stock Selection Criteria | Liquid stocks with clearly defined swing structure; standard 14-period RSI setting is the common default across most platforms |
| Entry Trigger | A confirmed regular divergence pattern, combined with price actually breaking a nearby support or resistance level, rather than trading the divergence signal in isolation |
| Stop Loss | Above the most recent divergent swing high (for bearish trades) or below the most recent divergent swing low (for bullish trades) |
| Initial Profit Target | The next visible support or resistance level, depending on trade direction |
| Trade Management | Trail once price confirms the reversal with its own structure, such as breaking a prior swing point in the new direction |
| Invalidation Criteria | Price making a new extreme that RSI actually confirms, negating the earlier divergence reading |
A Narrated Walk-Through
Consider a mid-cap retail stock, call it XYZ, rallying from $42 to $47 over a session, pulling back, then rallying again to a marginal new high of $47.80. On the first peak at $47, RSI reached 74, a clearly overbought reading. On the second peak at $47.80, RSI only reaches 61, despite price making a higher high, a textbook bearish divergence.
At 2:10 PM ET, XYZ breaks below its most recent higher low at $46.30 on increasing volume. A trader treats this combination, the prior divergence plus the confirmed break of price structure, as the entry signal to short at $46.10, with a stop at $47.95, just above the divergent second peak. The first target sits near $44.50, a prior support shelf, offering roughly 1.5:1 reward to risk. This walk-through describes a hypothetical archetype rather than a real ticker at current prices.
Combining RSI Divergence With Overbought and Oversold Readings
A stronger version of this setup layers the classic overbought or oversold context on top of the divergence pattern itself. Bearish divergence that forms with both peaks technically overbought (above 70) carries somewhat more weight than divergence forming where neither peak reaches overbought territory, since the former shows momentum decisively fading from an already-stretched condition rather than from a more moderate reading.
Some traders further refine this by watching RSI's own centerline, treating divergence that resolves with RSI crossing below 50 (in the bearish case) as additional confirmation that momentum has genuinely shifted, beyond just the initial divergence observation.
Where RSI Divergence Trades Fail
The most common failure mirrors the same issue seen with MACD divergence: trading the signal in isolation, without waiting for price to actually confirm weakness through a broken support or resistance level. A stock can display valid RSI divergence and still continue climbing for several more sessions before any reversal actually materializes, particularly during a strong, catalyst-driven trend where fundamental momentum can override a technical warning sign for an extended period.
A second failure mode occurs on choppy stocks with poorly defined swing structure, where identifying genuinely comparable price peaks or troughs is difficult to begin with. Divergence analysis depends on comparing legitimate, well-formed swing points, and forcing a divergence read onto noisy, disorganized price action produces unreliable signals.
A third failure mode involves ignoring the broader trend context entirely. RSI divergence that appears within a powerful, high-conviction primary trend, particularly one supported by a strong sector or broad market tailwind, tends to resolve into a shallow pause rather than a full reversal far more often than divergence appearing after an already-extended, mature move.
Adjusting RSI Settings for Different Trading Styles
The standard 14-period RSI setting works reasonably well across most timeframes, though some day traders shorten the period, such as to 9 or 10, for faster intraday reactivity on lower timeframe charts, accepting more noise in exchange for quicker signals. Scalpers working very short timeframes sometimes use even shorter periods, while swing traders working daily charts often stick with the standard 14-period default that Wilder originally specified.
Divergence itself can be identified regardless of the exact period chosen, though a shorter period will naturally produce divergence signals more frequently, some of which will be lower-quality noise compared to the signals a standard 14-period setting would flag.
Scanning for RSI Divergence Setups
Identifying divergence across a broad watchlist manually is labor-intensive, since it requires comparing multiple swing points on both price and the indicator at once for every candidate. Some technical scanning tools include divergence detection as a built-in filter capable of flagging candidates automatically, saving considerable time compared to checking each chart by hand. Trade Ideas offers customizable technical filters traders can combine to narrow down candidates showing the kind of momentum deceleration that underlies a genuine RSI divergence, ahead of final manual confirmation.
Fitting RSI Divergence Into a Broader Plan
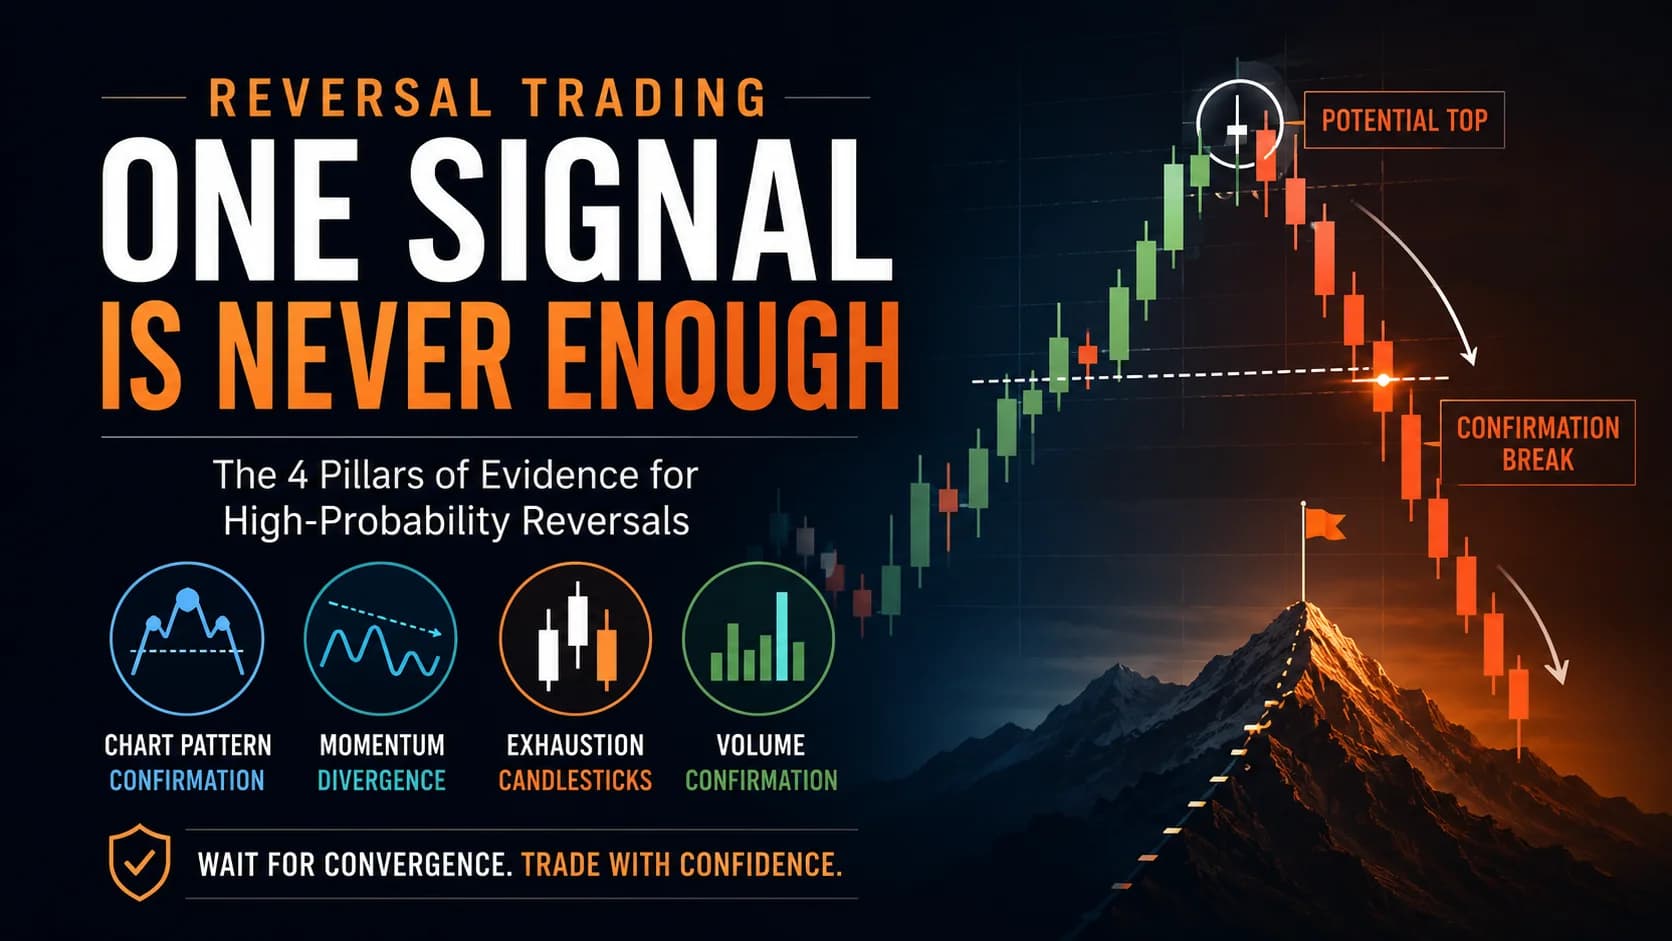
RSI divergence functions best as an early warning layer within a broader reversal trading approach, flagging candidates worth closer attention rather than serving as a standalone trigger on its own. Combining RSI divergence with confirmation from price structure, and ideally a second independent signal such as MACD divergence, tends to produce a more disciplined and higher-conviction approach than acting on RSI divergence alone.
FAQ
How is RSI divergence different from MACD divergence?
RSI measures the relative size of recent gains versus losses on a bounded 0 to 100 scale, while MACD measures the relationship between two moving averages on an unbounded scale. Because the underlying math differs, the two indicators won't always agree perfectly on timing, which is part of why some traders look for divergence to appear on both simultaneously as a stronger combined signal.
Key Takeaway: RSI and MACD divergence reflect the same core concept through different calculations, and agreement between the two adds confidence.
What RSI reading is considered a strong overbought or oversold level for day trading?
Tighter, more volatile intraday timeframes can push RSI to extreme readings more frequently than a daily chart would, which is part of why some traders widen the thresholds to 80 and 20 specifically for very short timeframes. There's no single correct setting; the choice depends on how frequently a trader wants overbought or oversold signals to trigger relative to the noise level of the specific timeframe being used.
Key Takeaway: Standard 70/30 thresholds work broadly, but some traders widen to 80/20 on faster intraday timeframes to filter out noise.
Can RSI stay overbought for an extended period without price reversing?
A stock in a powerful, sustained uptrend can hold an overbought RSI reading for an extended stretch, and traders who short purely because RSI crossed above 70 without any divergence or structural confirmation often get run over by the continuing trend. This is precisely why divergence, a comparative signal, tends to be more useful than the raw overbought or oversold reading alone.
Key Takeaway: RSI can stay overbought through a strong trend; divergence is a more reliable reversal signal than the overbought reading by itself.
How does hidden RSI divergence differ from regular RSI divergence in practice?
Regular bearish divergence shows price making a higher high while RSI makes a lower high, a reversal warning. Hidden bullish divergence shows price making a higher low while RSI makes a lower low during a pullback within an uptrend, which actually reinforces the case for trend continuation rather than reversal. Careful identification of exactly which pattern is present avoids trading in the wrong direction.
Key Takeaway: Regular divergence warns of reversal, hidden divergence supports continuation, and the two require careful, deliberate identification.
Should RSI divergence be combined with a specific chart pattern for higher confidence?
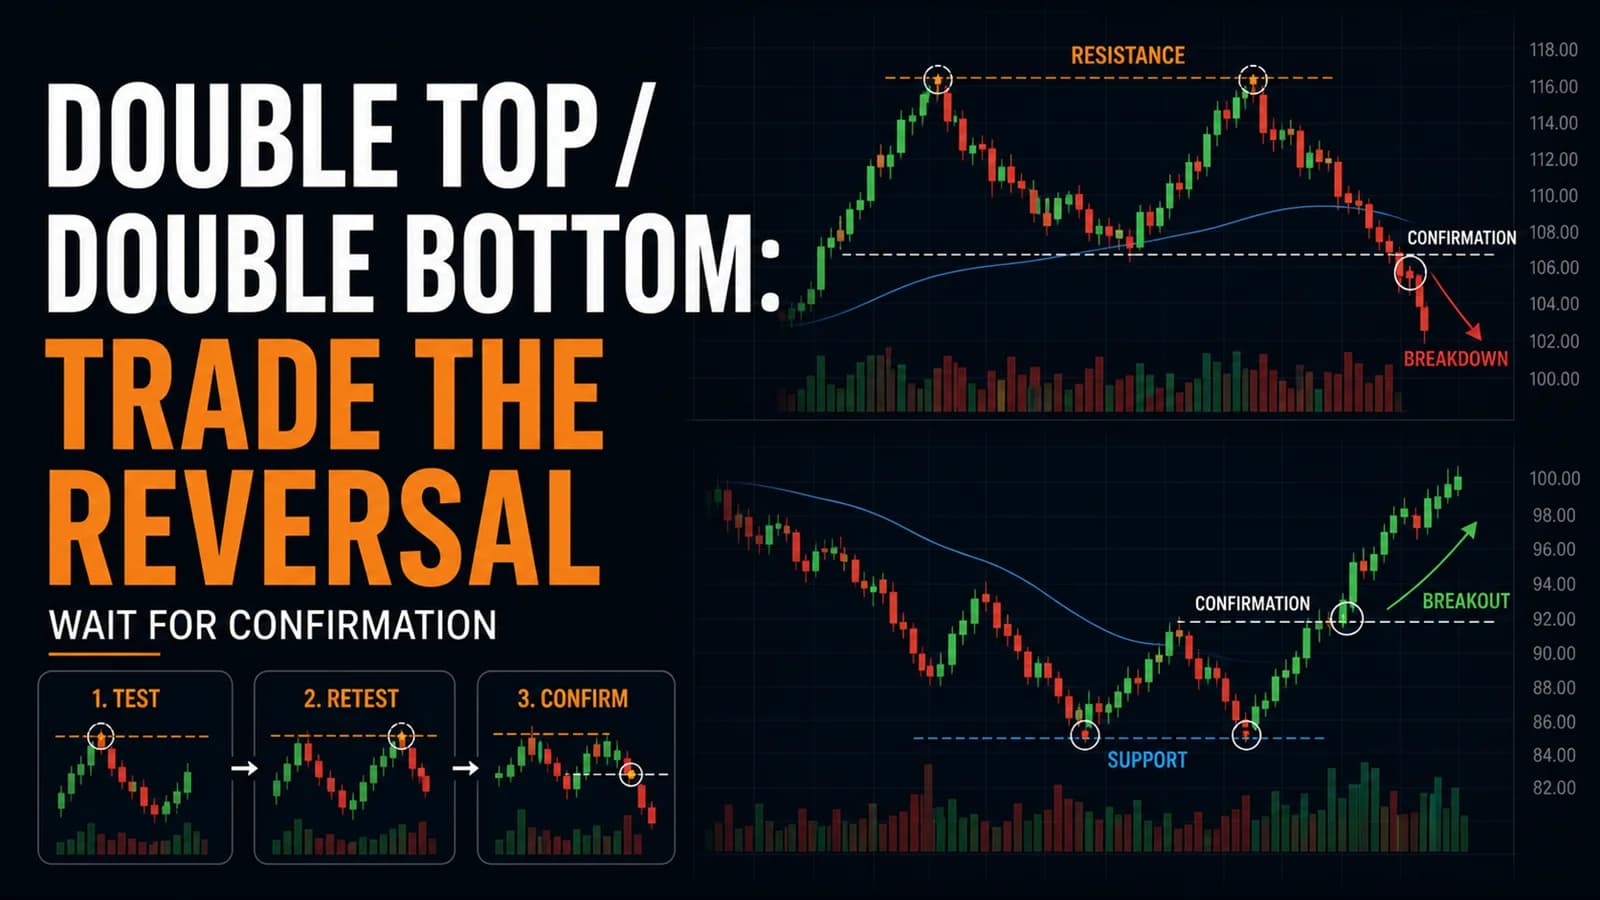
A double top that also shows bearish RSI divergence between the two peaks combines a visual price pattern with a momentum-based confirmation, giving a trader two independent reasons to expect weakness rather than relying on either signal in isolation. This kind of confluence is a common way traders build higher-conviction reversal setups.
Key Takeaway: Pairing RSI divergence with a recognizable chart pattern like a double top strengthens the overall reversal case.
Does RSI divergence work on any market, or just stocks?
RSI's calculation only requires a series of closing prices, which makes it broadly applicable across asset classes. The core discipline, comparing swing points on price against corresponding RSI readings, transfers directly regardless of what's being traded, though liquidity and volatility characteristics specific to each market still affect how reliable any given divergence signal turns out to be.
Key Takeaway: RSI divergence applies across stocks, forex, futures, and crypto, wherever enough price history exists to compare swing points.
How long can it take for an RSI divergence signal to actually resolve into a reversal?
This variability is exactly why trading divergence in isolation, without waiting for an actual break of price structure, tends to produce more losing trades than combining the two. Divergence identifies a condition, not a specific timing window, and price confirmation helps narrow down when the underlying weakness or strength finally translates into an actual move.
Key Takeaway: Divergence timing is highly variable, which is why structural price confirmation remains an important companion signal.
Is RSI divergence a good starting point for a beginner learning technical indicators?
A trader who already understands the basic overbought and oversold framework has the foundation needed to start comparing RSI's behavior across multiple swing points, which is the core skill divergence analysis requires. Attempting divergence analysis without first understanding what RSI fundamentally measures tends to produce confused, inconsistent application of the concept.
Key Takeaway: Build a solid grasp of basic RSI mechanics first; divergence analysis is a natural next step from there.
Disclaimer
Article Sources
- StockCharts ChartSchool: Introduction to Technical Indicators and Oscillators - Background on RSI's overbought and oversold bands and general oscillator interpretation.chartschool.stockcharts.com
- StockCharts ChartSchool: Technical Indicators & Overlays - Reference index covering RSI alongside related momentum indicators.chartschool.stockcharts.com
- CFA Institute: Technical Analysis for Investment Professionals - Professional context on RSI and divergence analysis within broader technical practice.cfainstitute.org
- FINRA: Day Trading Risk Disclosure - Regulatory guidance on the risks inherent in short-term, indicator-driven trading.finra.org