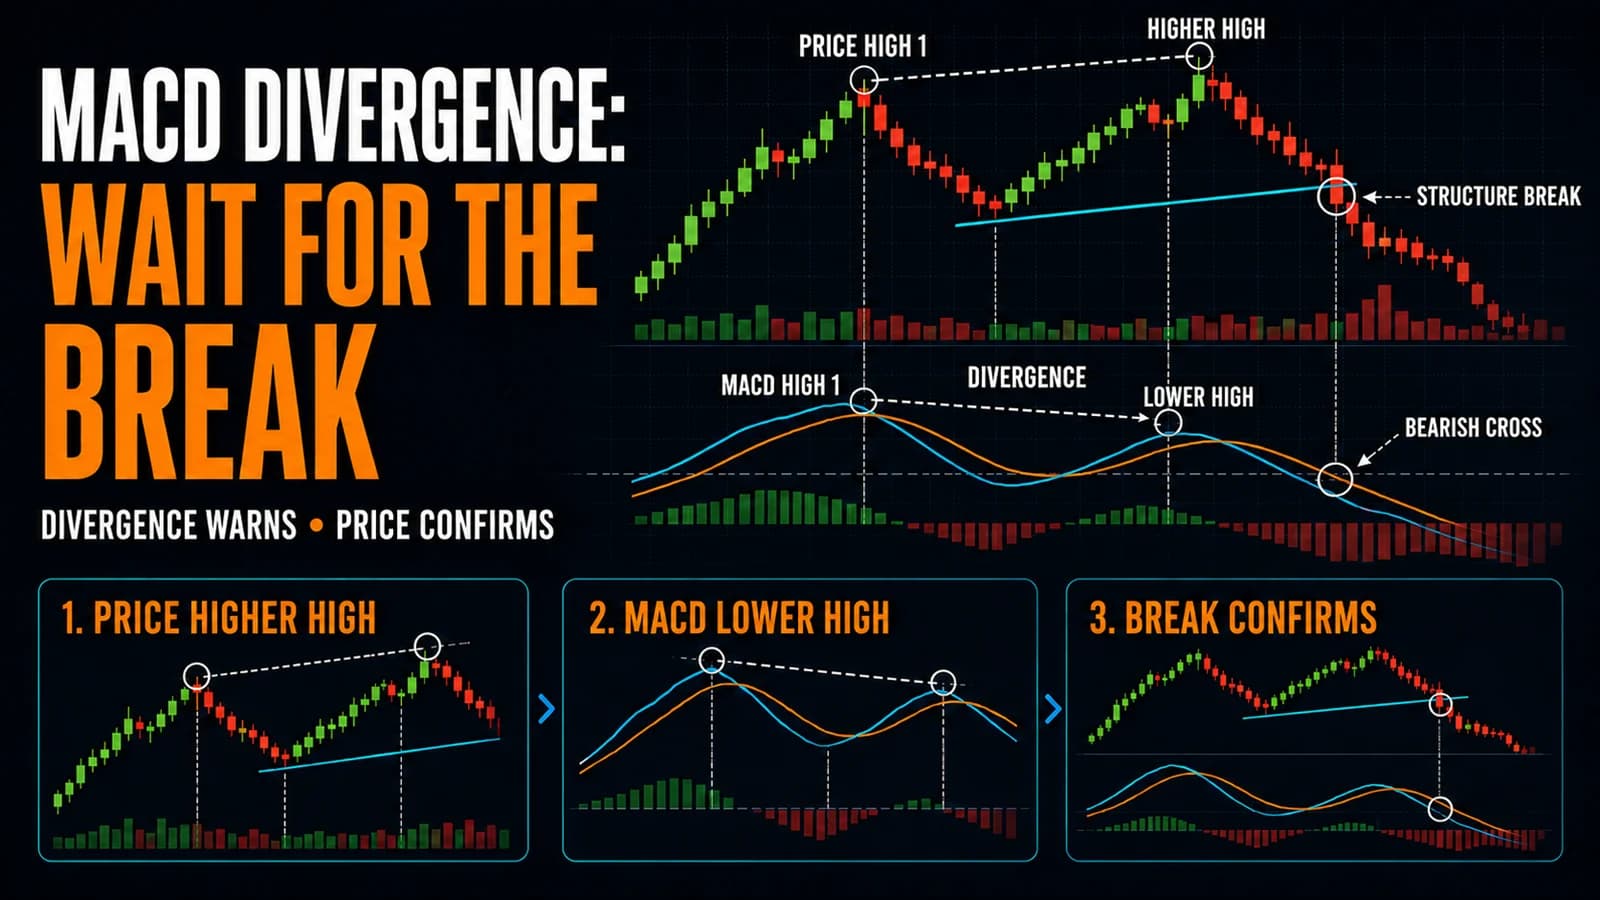
Price can keep climbing to new highs while the engine underneath it quietly loses power. That mismatch, price making progress while momentum doesn't confirm it, is what MACDMACD (Moving Average Convergence Divergence) is a momentum and trend-following indicator that measures the relationship between two exponential moving averages — typically the 12 and 26 EMA — and plots the difference (MACD line) alongside aRead definition → divergence is built to reveal, and it's one of the few signals in technical analysis that genuinely tends to show up before the reversal it's warning about rather than after.
What is MACD divergence? MACD divergence occurs when price makes a new high or low that the MACD indicator fails to confirm with a correspondingly extreme reading, signaling that the momentum driving the recent move is weaker than the price action alone suggests. Bearish divergence forms at highs, bullish divergence forms at lows, and both are treated as early warning signs of a potential reversal rather than a precise entry trigger on their own.
Why Divergence Catches What a Simple Crossover Misses
A standard MACD crossover reacts to a change that's already happened, the moment the MACD line actually crosses its signal line. Divergence works differently: it compares the trajectory of price against the trajectory of MACD itself, looking for disagreement between the two well before any crossover confirms it. A stock making a second, Higher HighA higher high occurs when price makes a swing peak that is above the previous swing peak — it's one of the two defining features of an uptrend and indicates buyers are consistently willing to pay more than before.Read definition → on the price chart while MACD prints a Lower HighA lower high is a swing high that is below the previous swing high — paired with lower lows, it's the second component that confirms a downtrend in market structure, showing that rally attempts are weakening and sellers are maintaining contRead definition → than it did on the first peak is showing that fewer buyers are pushing the move this time around, even though price hasn't shown any weakness yet.
This is genuinely useful information because price, by itself, only tells you where the stock has been. Momentum, measured through an oscillator like MACD, tells you something about the underlying conviction behind that move. When the two disagree, it's often (though not always) a signal that the current move is running out of the participation needed to sustain itself.
The Two Types of Divergence and What Each One Signals
Regular divergence is the classic reversal warning: price makes a higher high while MACD makes a lower high (bearish), or price makes a Lower LowA lower low is when price makes a swing low that is below the previous swing low, confirming a downtrend in market structure — the mirror image of a higher low, and one of the two components (with lower highs) that defines a bearish trend.Read definition → while MACD makes a Higher LowA higher low is a swing low that is above the previous swing low — paired with higher highs, it's the second component that confirms an uptrend in market structure, showing that buyers are defending progressively higher price levels and thaRead definition → (bullish). This is the pattern most traders mean when they refer to divergence, and it's generally interpreted as an early sign that the existing trend is losing steam.
Hidden divergence works in the opposite direction and is used as a continuation signal rather than a reversal warning. In an uptrend, hidden bullish divergence occurs when price makes a higher low while MACD makes a lower low, suggesting the pullback is weaker than it appears and the uptrend is likely to resume. Because these two patterns point in opposite directions despite both being called "divergence," confusing them is a genuine and common mistake, and traders new to the concept should be deliberate about which type they're identifying before acting on it.
Setup Specification
- Component
- Market Conditions Required
- Rule
- A visible, established trend with at least two comparable swing highs (for bearish divergence) or swing lows (for bullish divergence) to compare against MACD
- Component
- Time of Day
- Rule
- Applies on any intraday timeframe, though divergence patterns generally take longer to develop and are somewhat more reliable on 15 minute or daily charts than on very fast 1 minute charts
- Component
- Stock Selection Criteria
- Rule
- Liquid stocks with a clear enough trend structure to identify comparable swing points; works across most price ranges
- Component
- Entry Trigger
- Rule
- A confirmed regular divergence pattern, ideally combined with an actual MACD crossover or a break of a nearby support/resistance level on price, rather than trading the divergence signal in isolation
- Component
- Stop Loss
- Rule
- Above the most recent swing high (for bearish divergence trades) or below the most recent swing low (for bullish divergence trades)
- Component
- Initial Profit Target
- Rule
- The most recent significant support or resistance level below or above the entry, depending on trade direction
- Component
- Trade Management
- Rule
- Trail once price confirms the reversal with its own structure, such as a break of a prior higher low (in the bearish case)
- Component
- Invalidation Criteria
- Rule
- Price making a new high or low that MACD actually confirms, negating the divergence signal entirely
| Component | Rule |
|---|---|
| Market Conditions Required | A visible, established trend with at least two comparable swing highs (for bearish divergence) or swing lows (for bullish divergence) to compare against MACD |
| Time of Day | Applies on any intraday timeframe, though divergence patterns generally take longer to develop and are somewhat more reliable on 15 minute or daily charts than on very fast 1 minute charts |
| Stock Selection Criteria | Liquid stocks with a clear enough trend structure to identify comparable swing points; works across most price ranges |
| Entry Trigger | A confirmed regular divergence pattern, ideally combined with an actual MACD crossover or a break of a nearby support/resistance level on price, rather than trading the divergence signal in isolation |
| Stop Loss | Above the most recent swing high (for bearish divergence trades) or below the most recent swing low (for bullish divergence trades) |
| Initial Profit Target | The most recent significant support or resistance level below or above the entry, depending on trade direction |
| Trade Management | Trail once price confirms the reversal with its own structure, such as a break of a prior higher low (in the bearish case) |
| Invalidation Criteria | Price making a new high or low that MACD actually confirms, negating the divergence signal entirely |
A Narrated Walk-Through
Consider a large-cap technology stock, call it XYZ, rallying from $180 to $195 over the course of a session, then pulling back and rallying again to a marginal new high of $197. On the first peak at $195, the MACD line reached 1.8. On the second peak at $197, despite price making a new high, the MACD line only reaches 1.3, a clear bearish divergence.
Shortly after this second peak, at 1:45 PM ET, XYZ breaks below its most recent higher low at $193.50 on rising volume, and the MACD line crosses below its signal line at the same time. A trader treats this combination, the prior divergence plus the actual break of structure and the crossover confirmation, as the entry signal to short at $193.20, with a stop at $197.50, just above the divergent high. The first target sits at $188, a prior support level, offering roughly 1.2:1 reward to risk. This scenario describes a hypothetical archetype rather than a real ticker at current prices.
Why Divergence Alone Isn't an Entry Signal
The single most important discipline with this setup is refusing to trade divergence in isolation. Divergence can persist for a surprisingly long time before price actually reverses, and a stock can keep grinding to new highs on weakening MACD readings for several more sessions before the reversal finally arrives. Traders who short the very first sign of bearish divergence, without waiting for price to actually confirm weakness through a broken support level or an accompanying crossover, frequently get run over by a trend that simply continues despite the warning sign.
Waiting for that additional confirmation, whether it's a MACD crossover, a break of recent support, or both together, converts divergence from a purely predictive tool into a genuinely tradeable setup with a defined risk level.
Where Divergence Trades Go Wrong
The most common failure is trading divergence in a genuinely strong, high-conviction trend where price simply keeps extending despite the warning sign. Divergence reflects a slowdown in momentum's rate of change, not necessarily an imminent reversal, and a powerful trend can absorb multiple divergence signals before it actually turns. This is especially true during strong catalyst-driven moves, where fundamental news can override what the indicator is showing.
A second failure mode is misreading which type of divergence is present. Confusing hidden divergence, a continuation signal, with regular divergence, a reversal signal, leads to trading in the wrong direction entirely. Careful, deliberate identification of the swing points being compared, and which direction each line is actually moving, helps avoid this mix-up.
A third failure mode occurs on choppy, low-volume names where swing highs and lows are poorly defined to begin with. Divergence analysis depends on comparing genuinely comparable peaks or troughs, and attempting to draw divergence conclusions from noisy, ill-defined swing points on a thinly traded stock produces unreliable signals.
Divergence Across Different Timeframes
Divergence patterns that appear on a higher timeframe, such as a daily or hourly chart, generally carry more weight than the same pattern on a 1 minute chart, simply because they reflect a longer, more thoroughly tested momentum shift. Some traders specifically look for divergence to align across multiple timeframes simultaneously, treating a bearish divergence visible on both the hourly and daily chart at the same time as a considerably stronger signal than divergence appearing on just one.
Divergence can also be identified using other oscillators, most commonly RSI, and some traders look for divergence to appear on both MACD and RSI simultaneously as an additional layer of confirmation before treating the signal as high-conviction.
Scanning for Divergence Setups
Manually scanning a broad watchlist for divergence patterns is genuinely time-consuming, since it requires comparing multiple swing points on both the price chart and the indicator simultaneously across every candidate. Some scanning platforms include automated divergence detection as a built-in filter, which can surface candidates worth a closer manual look far faster than checking each chart individually. Trade Ideas offers technical filters that traders can combine to help narrow down candidates showing the kind of momentum deceleration divergence depends on, ahead of manual chart confirmation.
Fitting Divergence Into a Broader Reversal Approach
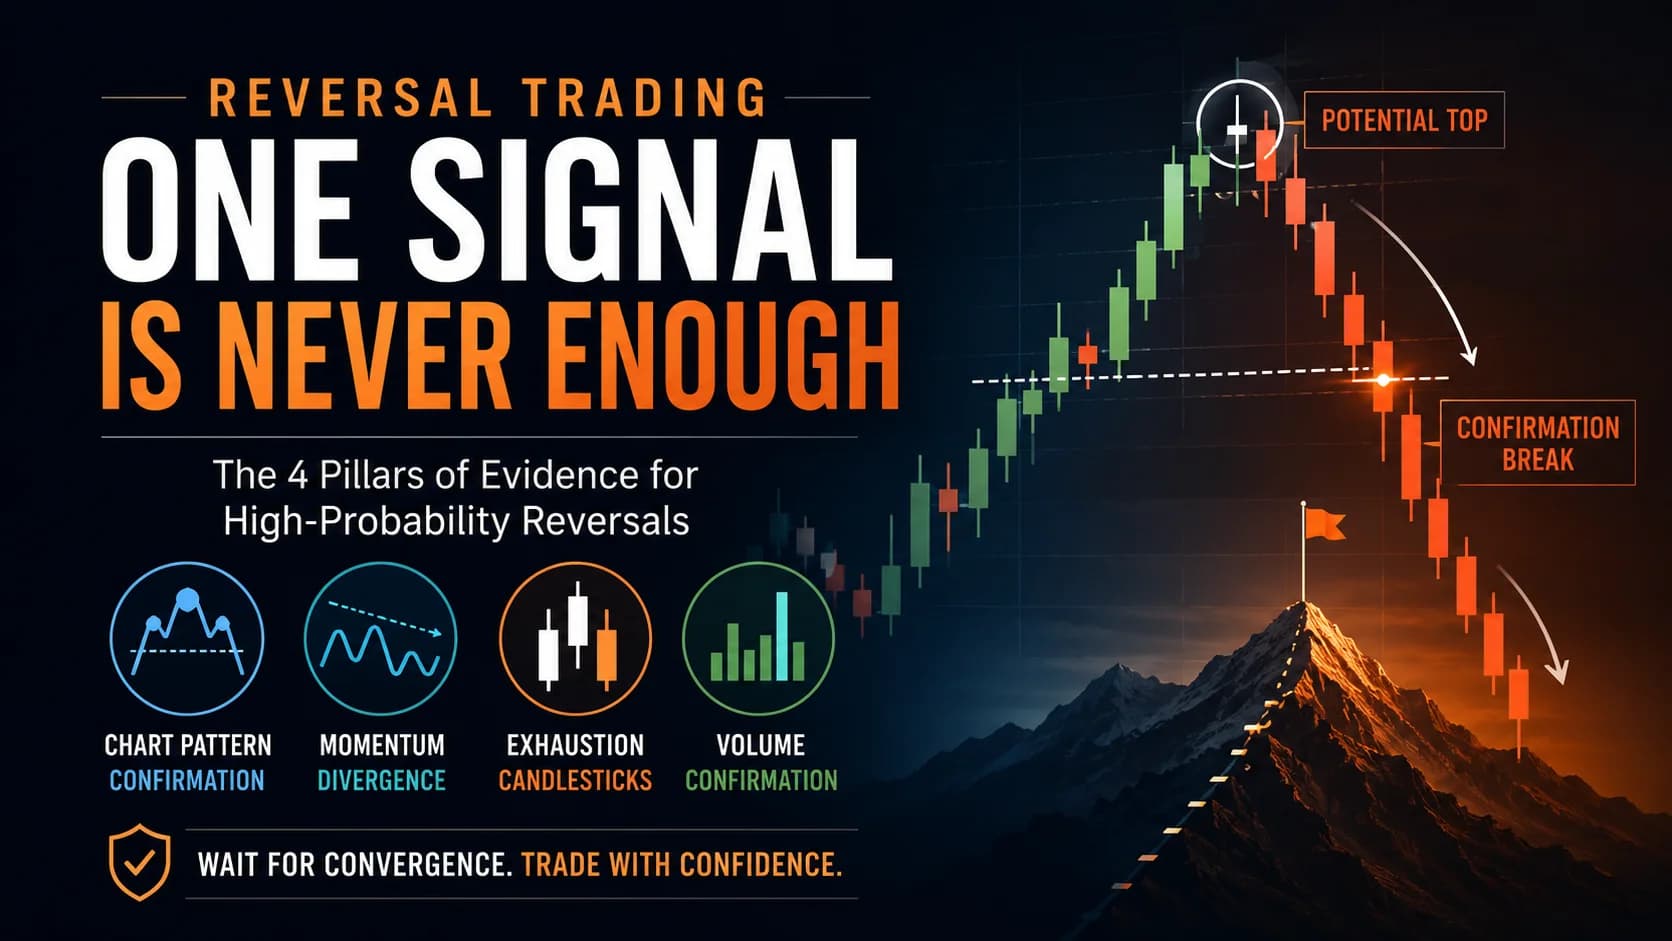
MACD divergence works best as an early warning system within a broader reversal trading framework, flagging candidates worth watching closely for an actual confirmed reversal signal rather than serving as a standalone trigger. Traders who treat divergence as a "watch list" signal, adding a stock to close monitoring rather than immediately trading against the trend, tend to catch genuine reversals with better risk control than those who act on divergence the moment it first appears.
FAQ
How many swing points are needed to confirm a valid MACD divergence?
Two points establish the basic divergence pattern: a new price extreme paired with a weaker MACD reading. A third comparable point that continues the same divergent relationship adds meaningful confidence that the pattern reflects a genuine, sustained momentum shift rather than a one-off anomaly between just two data points.
Key Takeaway: Two swing points establish basic divergence, and a third confirming point adds meaningful additional confidence.
What's the difference between regular divergence and hidden divergence?
Regular bearish divergence forms when price makes a higher high while MACD makes a lower high, warning of weakening upward momentum. Hidden bullish divergence forms when price makes a higher low while MACD makes a lower low, which actually suggests the existing uptrend is likely to continue rather than reverse. Mixing these two up leads directly to trading in the wrong direction.
Key Takeaway: Regular divergence warns of reversal; hidden divergence suggests continuation, and confusing the two produces opposite trading conclusions.
Can MACD divergence be used to time exits on an existing position rather than new entries?
Recognizing that momentum is fading on a position already held for gains gives a trader a reason to tighten a stop or take partial profits, without needing to actually reverse direction and short the stock. This more conservative use of divergence, protecting existing gains rather than fighting the trend outright, avoids some of the risk associated with trading divergence as a fresh counter-trend entry.
Key Takeaway: Divergence works well as an exit signal for existing positions, offering a more conservative application than a fresh counter-trend entry.
Why does divergence sometimes appear and then disappear without price ever reversing?
Divergence is a snapshot comparison between two or more specific points. If price continues climbing and MACD eventually catches up, making its own new high alongside price, the earlier divergence is effectively resolved without a reversal ever occurring. This is why divergence should be treated as a probabilistic warning sign rather than a guaranteed prediction of an imminent turn.
Key Takeaway: A subsequent MACD high or low that confirms price cancels the prior divergence signal; this is normal, not a failure of the tool.
Does MACD divergence work better on higher timeframes?
Higher timeframes smooth out short-term noise and reflect a more meaningful accumulation of trading activity between the compared swing points. A 1 minute chart can show technically valid divergence patterns that resolve within minutes without any lasting significance, which is why many traders weight higher timeframe divergence more heavily.
Key Takeaway: Favor divergence signals on higher timeframes for more reliable, less noisy patterns.
Should divergence be traded alone, or combined with other confirmation?
Divergence identifies a condition, weakening momentum, but doesn't specify exactly when a reversal will actually occur. Waiting for price itself to confirm the shift, through a broken trend line, a violated swing point, or an accompanying crossover, converts the divergence observation into a genuinely tradeable setup with a defined risk level.
Key Takeaway: Combine divergence with a confirming price-based signal rather than trading the divergence pattern in isolation.
Can divergence form on more than one indicator at the same time?
When two independently calculated momentum tools both flag the same weakening condition at the same swing points, the case for a genuine momentum shift is generally considered stronger than relying on a single indicator. This doesn't guarantee a reversal, but it does reduce the odds that the divergence reading is an artifact specific to how one particular indicator is calculated.
Key Takeaway: Divergence confirmed across multiple oscillators, such as MACD and RSI together, carries more weight than a single-indicator signal.
Is MACD divergence appropriate for a trader still learning basic chart reading?
Because divergence depends entirely on correctly identifying comparable price points and reading the corresponding indicator values at those exact points, it's a more advanced skill than recognizing a single crossover or a basic support level. Traders typically benefit from building solid comfort with swing structure first before layering in divergence analysis on top of it.
Key Takeaway: Build comfort identifying swing highs and lows first; divergence is a comparative skill best layered on afterward.
Disclaimer
Article Sources
- StockCharts ChartSchool: Introduction to Technical Indicators and Oscillators - Background on how oscillators are interpreted, including divergence and centerline behavior.chartschool.stockcharts.com
- StockCharts ChartSchool: Technical Indicators & Overlays - Reference index covering MACD and related momentum indicators used to identify divergence.chartschool.stockcharts.com
- CFA Institute: Technical Analysis for Investment Professionals - Professional context on momentum divergence within broader technical analysis practice.cfainstitute.org
- FINRA: Day Trading Risk Disclosure - Regulatory guidance on the risks inherent in short-term, indicator-driven trading.finra.org