Most indicators plot one or two lines and call it a day. Ichimoku Cloud plots five, layers them into a shaded cloud, and looks intimidating enough that many traders give up before understanding what any of the pieces actually do. That's a shame, because once broken down, each component answers a specific, useful question that a single Moving AverageA moving average smooths out price data by calculating the average closing price over a set number of periods — it filters out noise and identifies the trend direction, with the stock above the MA interpreted as bullish and below as bearishRead definition → or oscillator can't answer on its own.
What is the Ichimoku Cloud strategy? The Ichimoku Cloud strategy uses five calculated lines, the Tenkan-sen, Kijun-sen, Senkou Span A, Senkou Span B, and Chikou Span, together forming a comprehensive system that identifies TrendA trend is a sustained directional movement in price over time — an uptrend is characterized by a sequence of higher highs and higher lows, a downtrend by lower highs and lower lows — and correctly identifying the current trend direction isRead definition → direction, momentum, and SupportSupport is a price level where buying pressure has historically overcome selling pressure, causing price to stop declining and reverse — it's the floor where demand enters the market, and when it holds, it's a potential long entry; when it Read definition → or ResistanceResistance is a price level where selling pressure has historically overcome buying pressure, causing price to stall, reverse, or consolidate — it's the ceiling where supply enters the market and where breakout traders watch for either a coRead definition → all within a single indicator, with the shaded "cloud" between the two Senkou spans representing a dynamic zone of potential support or resistance.
Breaking Down the Five Components
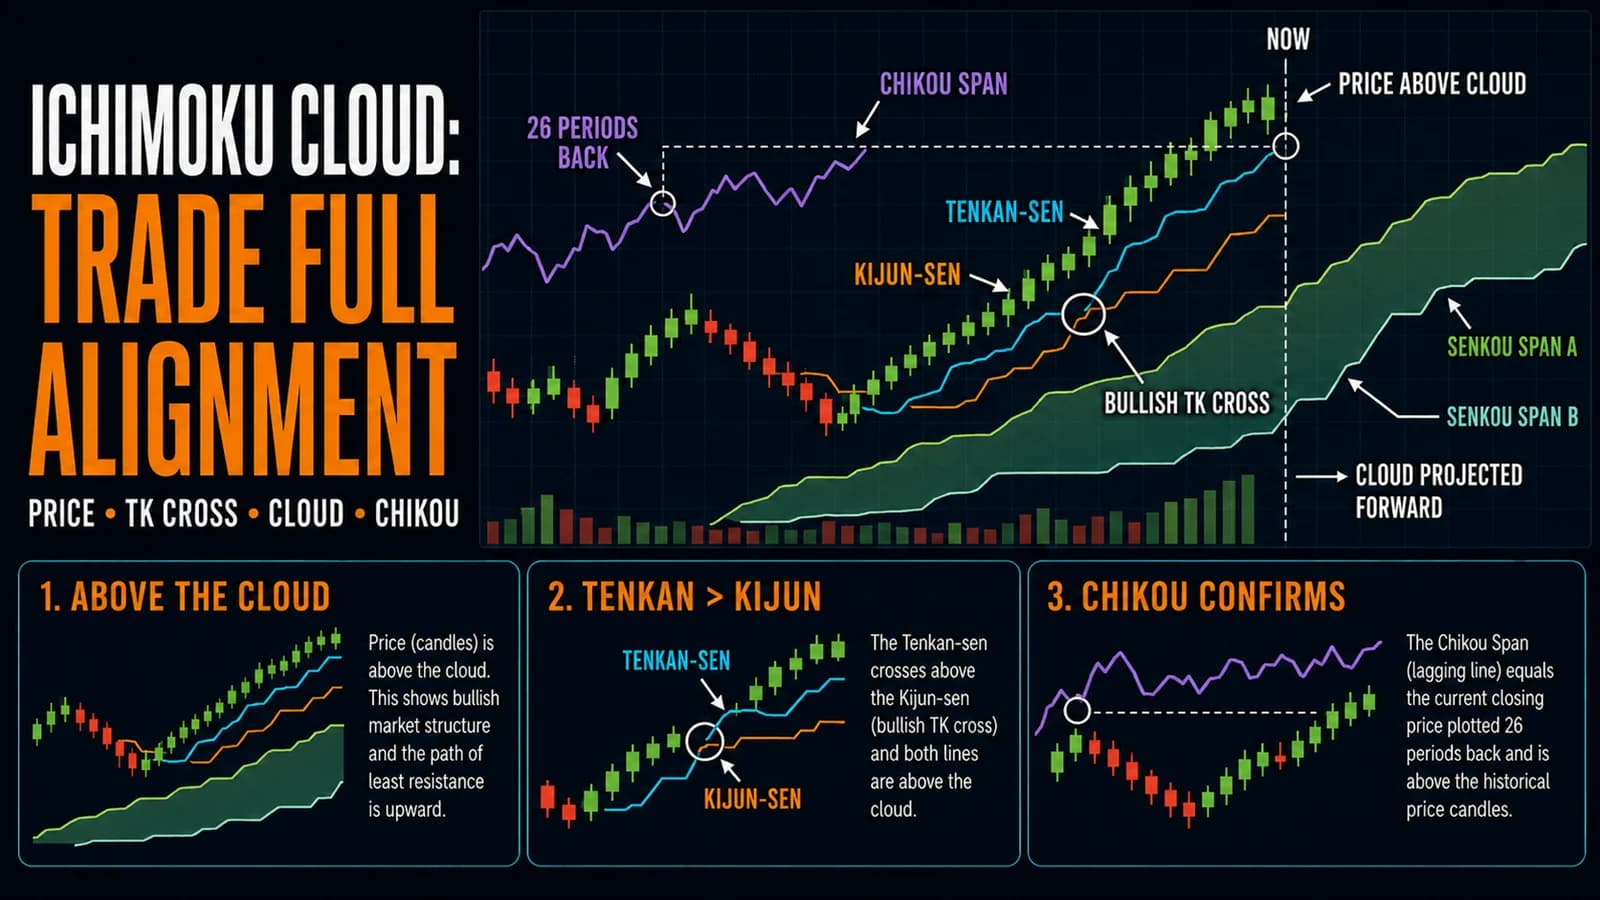
Developed by Japanese journalist Goichi Hosoda and published in 1969, Ichimoku Cloud (Ichimoku Kinko Hyo, meaning "one glance equilibrium chart") was designed to give a trader a complete read on a stock's trend at a single glance, hence the name. The Tenkan-sen (conversion line) is a fast-moving average of the highest high and lowest low over 9 periods, functioning similarly to a fast EMA. The Kijun-sen (base line) uses the same calculation over 26 periods, acting as a slower trend reference, similar in spirit to a longer moving average.
Senkou Span A and Senkou Span B are plotted 26 periods into the future, forming the boundaries of the cloud (Kumo). Senkou Span A averages the Tenkan-sen and Kijun-sen, while Senkou Span B uses the highest high and lowest low over 52 periods. The space between these two lines, shaded and projected forward, represents the cloud, which functions as a zone of potential support in an uptrend or resistance in a downtrend. The Chikou Span (lagging line) plots the current closing price 26 periods in the past, offering a way to compare current price against where price was trading a defined period ago.
Reading the Cloud as a Trend and Volatility Gauge
The cloud's position relative to price is the first and most important read. Price trading above the cloud generally signals a bullish trend, price trading below signals bearish, and price trading inside the cloud itself signals an unclear or transitional phase where a trend hasn't firmly established in either direction. The cloud's thickness also carries meaning: a thick cloud represents a wider zone of support or resistance that's generally harder for price to break through, while a thin cloud represents a weaker, more easily broken zone.
The color of the cloud, determined by whether Senkou Span A sits above or below Senkou Span B, provides an additional trend read projected 26 periods into the future, since the cloud itself is plotted ahead of current price. A bullish-colored cloud forming ahead of price suggests the underlying trend structure supports continued strength, even before price actually reaches that future zone.
Setup Specification
- Component
- Market Conditions Required
- Rule
- Clearest signals occur when price, the Tenkan-sen, the Kijun-sen, and the cloud all align in the same direction; mixed or overlapping signals suggest a less reliable, transitional environment
- Component
- Time of Day
- Rule
- Applies on any intraday timeframe, though the system's multiple lagging and leading components generally perform more reliably on higher timeframes like hourly or daily charts than on very fast 1 minute charts
- Component
- Stock Selection Criteria
- Rule
- Liquid stocks with enough price history for all five components to calculate meaningfully; works across most price ranges
- Component
- Entry Trigger
- Rule
- Tenkan-sen crosses above the Kijun-sen (a TK cross) while price trades above the cloud, ideally with the Chikou Span also sitting above price from 26 periods prior
- Component
- Stop Loss
- Rule
- Below the Kijun-sen, or below the bottom of the cloud if price has cleared it by a meaningful margin
- Component
- Initial Profit Target
- Rule
- The prior swing high, with the cloud's forward projection used as a general guide to potential future support levels for trailing stops
- Component
- Trade Management
- Rule
- Trail the stop using the Kijun-sen as it rises, or use the cloud's near edge as a dynamic trailing reference
- Component
- Invalidation Criteria
- Rule
- A bearish TK cross occurring shortly after entry, or price closing back inside or below the cloud
| Component | Rule |
|---|---|
| Market Conditions Required | Clearest signals occur when price, the Tenkan-sen, the Kijun-sen, and the cloud all align in the same direction; mixed or overlapping signals suggest a less reliable, transitional environment |
| Time of Day | Applies on any intraday timeframe, though the system's multiple lagging and leading components generally perform more reliably on higher timeframes like hourly or daily charts than on very fast 1 minute charts |
| Stock Selection Criteria | Liquid stocks with enough price history for all five components to calculate meaningfully; works across most price ranges |
| Entry Trigger | Tenkan-sen crosses above the Kijun-sen (a TK cross) while price trades above the cloud, ideally with the Chikou Span also sitting above price from 26 periods prior |
| Stop Loss | Below the Kijun-sen, or below the bottom of the cloud if price has cleared it by a meaningful margin |
| Initial Profit Target | The prior swing high, with the cloud's forward projection used as a general guide to potential future support levels for trailing stops |
| Trade Management | Trail the stop using the Kijun-sen as it rises, or use the cloud's near edge as a dynamic trailing reference |
| Invalidation Criteria | A bearish TK cross occurring shortly after entry, or price closing back inside or below the cloud |
A Narrated Walk-Through
Consider a large-cap consumer stock, call it XYZ, trading at $78.00, clearly above a thick, bullish-colored cloud sitting between $72.00 and $74.50 on the daily chart. The Tenkan-sen sits at $76.50 and the Kijun-sen at $75.20, with the Tenkan-sen having just crossed above the Kijun-sen, a bullish TK cross. The Chikou Span, representing the current close plotted 26 periods back, also sits above where price was trading 26 sessions ago, adding a further layer of bullish confirmation.
A trader treats this full alignment, price above the cloud, a bullish TK cross, and a confirming Chikou Span, as a high-conviction long signal, entering at $78.20 with a stop at $75.00, just below the Kijun-sen. As the trade develops and the Kijun-sen rises to $76.80 over subsequent sessions, the stop trails upward alongside it. This walk-through describes a hypothetical archetype rather than a real ticker at current prices.
Why Full Alignment Matters More Than Any Single Component
The genuine strength of Ichimoku Cloud comes from combining multiple confirming signals rather than acting on any single component in isolation. A bullish TK cross that occurs while price sits inside or below the cloud carries considerably less conviction than the same cross occurring with price clearly above a supportive cloud. Traders who wait for genuine alignment across most or all of the system's components, rather than jumping on the first bullish-looking signal from a single line, tend to filter out a meaningful number of lower-quality setups.
This is part of why Ichimoku is sometimes described as a complete trading system in itself rather than a single indicator: it's built to provide multiple, cross-checking signals that together paint a fuller picture than any one line could alone.
Where Ichimoku Setups Fail
The most common failure mode is trading a single component's signal, such as a TK cross, without checking whether the broader system actually agrees. A TK cross occurring while price sits inside the cloud, in a genuinely unclear or transitional phase, is a considerably weaker signal than the same cross with full system alignment, and traders who don't distinguish between the two end up trading in choppy, low-conviction conditions more often than they realize.
A second failure mode involves applying the system on very short intraday timeframes without adjusting expectations. Because several of Ichimoku's components involve lagging and forward-projected elements, the system was originally designed for daily charts, and its signals can become considerably noisier and less reliable when compressed onto a 1 or 5 minute chart, where price moves too quickly for the standard 9, 26, and 52 period settings to remain as meaningful.
A third failure mode is ignoring cloud thickness. A thin cloud offers much weaker support or resistance than a thick one, and treating every cloud edge with equal confidence, regardless of its thickness, leads to trusting weak support zones as if they carried the same reliability as genuinely thick, well-established cloud formations.
Adjusting Ichimoku for Different Markets
The standard 9, 26, 52 settings were originally calibrated to a six-day Japanese trading week, and some traders adjust these periods slightly, such as to 10, 22, 44, to better reflect a five-day Western trading week, though the difference in practice tends to be modest. For 24-hour markets like forex or crypto, some traders further adjust settings to account for the lack of a traditional session structure altogether.
Ichimoku can also be combined with other tools covered in this hub, such as confirming a bullish cloud BreakoutA breakout is when price moves decisively beyond a defined level — a resistance zone, a consolidation boundary, a chart pattern boundary, or a prior high — suggesting that the previous supply at that level has been overcome.Read definition → with rising RVOL, or checking whether a TK cross aligns with a MACD crossover at the same time for additional cross-indicator confirmation.
Screening for Ichimoku-Aligned Setups
Manually checking full Ichimoku alignment, price position, cloud color and thickness, and TK cross status, across a broad watchlist is time-consuming without a scanning tool built for the job. Some charting platforms support custom scans incorporating Ichimoku conditions, and Trade Ideas offers charting capable of displaying the full Ichimoku system alongside its broader real-time scanning tools, letting traders combine a manual Ichimoku review with other technical and volume-based filters.
Where Ichimoku Fits a Broader Trading Plan
Ichimoku Cloud works well as a comprehensive trend-confirmation system for traders willing to invest the time to understand all five components, rather than a quick, single-glance tool despite its name's literal translation. Pairing full Ichimoku alignment with a broader trend following approach gives traders a genuinely robust, multi-layered confirmation framework before committing to a trend-following position.
FAQ
What does it mean when price trades inside the Ichimoku cloud?
The cloud represents a zone of potential support or resistance, and price trading within that zone hasn't yet decisively broken in either direction. Many traders wait for a clear break above or below the cloud, rather than trading signals that occur while price remains inside it, since the lack of a clear trend context makes any individual signal less reliable.
Key Takeaway: Price inside the cloud signals an unclear trend phase; wait for a decisive break above or below before trusting other Ichimoku signals fully.
How is a TK cross different from a standard moving average crossover?
This calculation method makes Tenkan-sen and Kijun-sen react somewhat differently than a standard EMA or SMA of the same period length, since they're anchored to price extremes rather than an average of closes. The practical interpretation, a faster line crossing a slower one, works similarly in spirit to a standard moving average crossover, even though the underlying calculation differs.
Key Takeaway: TK crosses use range-based calculations rather than a standard average of closes, giving a somewhat different signal than a comparable moving average crossover.
What does the Chikou Span actually show, and why is it plotted in the past?
If the Chikou Span sits above where price was trading 26 periods ago, it suggests current momentum is stronger than it was at that earlier point, adding a confirming bullish signal. If it sits below, it suggests the opposite. This backward-looking comparison offers a distinct, additional data point beyond what the forward-looking cloud components provide.
Key Takeaway: The Chikou Span compares today's close against price from 26 periods earlier, offering an additional momentum confirmation signal.
Why is Ichimoku Cloud sometimes considered a complete trading system rather than a single indicator?
The combination of a fast and slow moving average equivalent (Tenkan-sen and Kijun-sen), a forward-projected support/resistance zone (the cloud), and a backward-looking momentum check (the Chikou Span) covers several analytical functions that would otherwise require multiple separate indicators. This is part of why Ichimoku has a reputation as more comprehensive than a typical single-purpose indicator.
Key Takeaway: Ichimoku combines trend, momentum, and support/resistance functions into one system, which is why some traders use it without additional indicators.
Does Ichimoku work well on very short intraday timeframes?
Traders who want to apply Ichimoku intraday often find better results on a 15 minute or hourly chart than on the fastest available timeframes, where price can move too quickly for the standard 9, 26, and 52 period calculations to remain as meaningful as they are on slower charts.
Key Takeaway: Ichimoku performs more reliably on 15 minute or higher intraday timeframes than on very fast 1 minute charts.
Should the standard Ichimoku settings be adjusted for non-Japanese markets?
The original settings were calibrated to a historical six-day Japanese trading week, and while the adjustment for a five-day week is a reasonable refinement, many traders find the standard settings work adequately without modification. This is more a matter of preference and testing than a strict requirement.
Key Takeaway: Adjusted settings for a five-day week are a reasonable refinement but not strictly necessary; the standard settings remain widely used.
Can Ichimoku Cloud be combined with other indicators covered in this hub?
Because Ichimoku already combines several internal confirmation layers, adding one well-chosen external indicator, rather than stacking many additional tools, tends to be the more practical approach. Over-layering too many separate confirmation requirements can make a setup so restrictive that very few tradeable opportunities ever actually qualify.
Key Takeaway: Combine Ichimoku with one additional, well-chosen confirmation tool rather than stacking excessive extra layers.
Is Ichimoku Cloud a good indicator for a beginner to start with?
The visual complexity and multiple simultaneous signals Ichimoku generates can overwhelm a trader who hasn't yet built comfort with simpler, single-purpose indicators. Once those fundamentals are solid, the transition to understanding Ichimoku's individual components becomes considerably more manageable than attempting to learn everything simultaneously.
Key Takeaway: Build comfort with simpler indicators first; Ichimoku's five interacting components are better tackled once basic technical analysis feels familiar.
Disclaimer
Article Sources
- StockCharts ChartSchool: Technical Indicators & Overlays - Reference covering Ichimoku Cloud alongside related trend and support/resistance indicators.chartschool.stockcharts.com
- CFA Institute: Technical Analysis for Investment Professionals - Professional context on multi-component trend systems within broader technical practice.cfainstitute.org
- CME Group Education - Background on trend and momentum systems as applied across futures and broader markets.cmegroup.com
- FINRA: Day Trading Risk Disclosure - Regulatory guidance on the risks inherent in short-term, indicator-driven trading.finra.org