
The Earnings Momentum Strategy: Trading Post-Earnings Drift Intraday

In this article12 sections
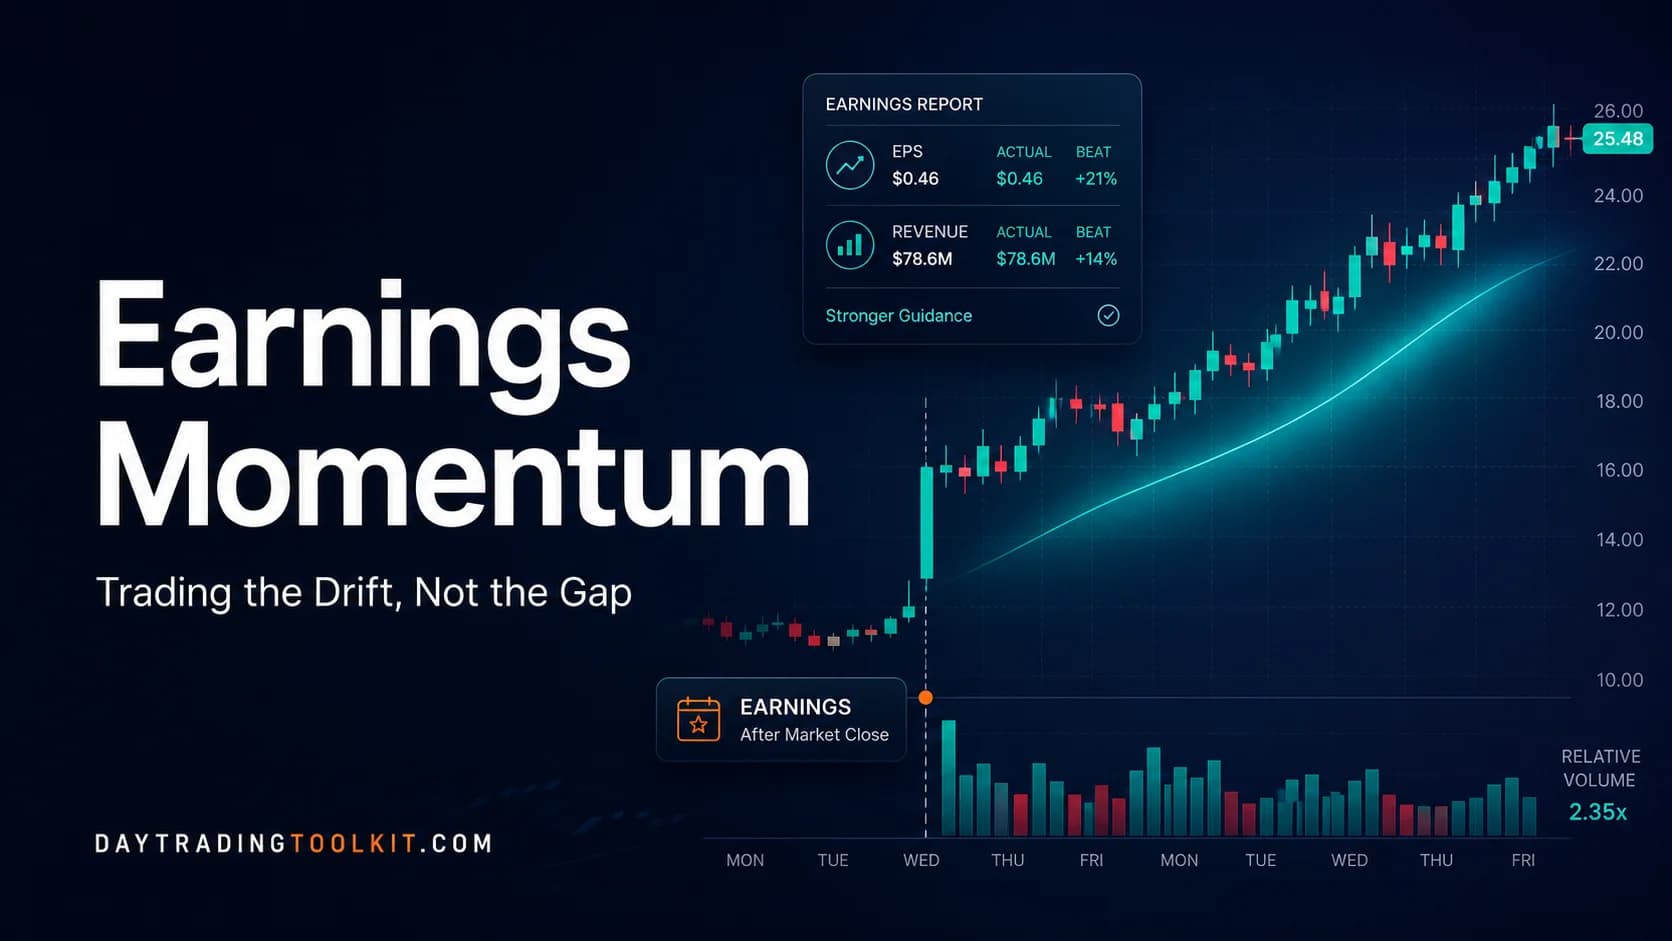
A small-cap stock beats earnings by a wide margin and gaps up 18% before the bell. By the time most day traders notice, the opening print is already over and the obvious trade is gone. What almost nobody watches for is what decades of accounting research say tends to happen next: not on the gap day itself, but on the two or three sessions after it, while the market is still catching up to news it hasn't fully priced in.
What is the earnings momentum strategy? The earnings momentum strategy trades the continuation of a stock's price move in the sessions following a significant earnings surprise, grounded in the post-earnings-announcement drift documented across decades of academic research. Instead of chasing the initial reaction gap, it targets the follow-through days where the market is still absorbing the surprise.
This Isn't the Gap Trade: Where Earnings Momentum Actually Starts
This hub already covers the announcement-day mechanics elsewhere. The Trader's Playbook for earnings reports handles the pre-market gap itself, and the Gap and Go strategy covers riding that gap through the opening bell. Neither of those articles is what's happening here.
Earnings momentum, as covered in this guide, is a different trade built on a different research finding. It's the tendency for a stock's price to keep drifting in the direction of an earnings surprise for days, sometimes weeks, after the initial reaction, because the market doesn't fully price the surprise in on day one. Finance and accounting researchers call this post-earnings-announcement drift, usually shortened to PEAD, and it's one of the oldest, most replicated anomalies in the academic literature. The trade this guide is built around typically doesn't even start until the day after the report, once the initial gap has already happened and either held or failed.
That distinction matters for a very practical reason. A trader who only knows the Gap and Go version of an earnings play watches the report, catches (or misses) the opening move, and moves on to the next name by 10 AM. A trader who understands the drift keeps that stock on a watchlist for the rest of the week, because the research says the move isn't necessarily finished just because the opening bell has come and gone.
The Research Behind the Drift: What Decades of Data Actually Show
Ball and Brown first documented this pattern in 1968: after a company reports earnings, its stock price keeps drifting in the direction of the surprise instead of adjusting immediately, which is exactly what an efficient market shouldn't do. Victor Bernard and Jacob Thomas extended that finding in a landmark 1989 study, sorting stocks into deciles by the size of their earnings surprise (a measure researchers call standardized unexpected earnings, or SUE) and tracking what happened next. The top decile, the biggest positive surprises, kept outperforming the bottom decile, the biggest negative surprises, for an extended period after the announcement. That spread was positive in 41 of 48 quarters they studied between 1974 and 1985, and Bernard and Thomas estimated an implementable strategy built on it could have produced an annualized abnormal return in the neighborhood of 18% in the quarter immediately following the announcement, before accounting for transaction costs, with a smaller version of the effect persisting for a couple of additional quarters after that.
That 18% figure is worth pausing on, because it's easy to misread. It describes a diversified, long-short portfolio built across many stocks and many quarters, not a single-trade win rate for a discretionary day trader picking one stock at a time. No published research quantifies a win rate for the kind of discretionary, single-name application this guide describes, and this guide won't invent one. Track results against the setup's own invalidation criteria instead of importing an academic portfolio statistic as a personal expectation.
The explanation Bernard and Thomas settled on is what's called the underreaction theory: some investors don't fully update their expectations for a company's future earnings the moment a surprise is announced, so the full pricing impact shows up gradually rather than all at once. That's a very different mechanism from a chart pattern or a volume spike. It's a documented, repeated failure of the market to do what efficient-market theory says it should do instantly.
One detail from the follow-up 1990 study is worth sitting with, because it changes how a trader should actually think about "the drift" as something to sit through. Bernard and Thomas found that roughly 25% to 30% of the total post-earnings drift shows up during the three-day windows surrounding the company's next quarterly earnings report, despite those windows representing only about 5% of all trading days in the sample. In plain terms: a meaningful chunk of the drift isn't a smooth grind higher (or lower) day after day. It's lumpy, and a disproportionate slice of it arrives in another discrete jump around the next print, not as gradual follow-through in between. That has a direct, practical consequence covered later in this guide's risk section.
Why This Barely Works on Large-Caps Anymore
Here's the part most retail-facing content on this topic skips entirely, and it's the honest reason this guide is careful about which stocks it applies to. The drift documented above was measured mostly in the 1970s and 1980s. Markets have changed since then, and the anomaly has changed with them.
Charles Martineau's 2022 study, pointedly titled "Rest in Peace Post-Earnings Announcement Drift," found that for large-cap stocks, the effect had essentially disappeared by 2006, and it has faded significantly even in microcap names in more recent years. The mechanisms behind that decline are structural, not mysterious: decimalization made electronic arbitrage far more precise, Reg NMS accelerated high-frequency trading across the market in the mid-2000s, and modern algorithmic systems now parse earnings releases and adjust prices within seconds of a report crossing the wire. A mega-cap stock beating earnings today gets priced almost instantly by systems built specifically to close exactly this kind of gap before a human trader can act on it.
Richard Mendenhall's 2004 research on arbitrage risk offers the practical explanation for where the anomaly still survives. Drift persists most in stocks where it's genuinely difficult or costly for institutional arbitrageurs to trade against it: names with wide bid-ask spreads, high idiosyncratic volatility, thin analyst coverage, and lower institutional ownership. Put simply, the drift concentrates in exactly the corner of the market that's hardest for a large fund to trade in size, and easiest for a nimble individual trader to access. That corner also happens to overlap heavily with the small-cap, lower-float names this hub already covers for other setups, which is one reason this strategy fits naturally alongside the rest of the momentum module rather than requiring a completely different toolkit.
There's a genuinely counterintuitive wrinkle worth knowing here too. David Hirshleifer, Sonya Lim, and Siew Hong Teoh's 2009 study on investor distraction found that on days when many companies report earnings simultaneously, the immediate price and volume reaction to any single company's surprise tends to be weaker, and the subsequent drift tends to be stronger. The logic is straightforward: investors have limited attention, and when dozens of earnings reports compete for that attention on the same morning, any individual surprise gets less scrutiny in the moment, leaving more of the reaction to unfold gradually over the days that follow. A busy earnings week, in other words, isn't a reason to expect less opportunity here. Research suggests it can mean more.

What Makes a Surprise Worth Watching: Selection Criteria
Not every earnings beat or miss is a drift candidate. Filtering matters as much here as it does for any other setup on this hub, and skipping the filter is the fastest way to end up trading noise instead of a documented effect.
Market capitalization and analyst coverage are the first filter, given everything covered above. A company followed by one or two analysts, or none, sits in exactly the low-coverage, high-arbitrage-risk zone where the research says drift still shows up. A widely-covered mega-cap simply doesn't offer the same edge anymore, regardless of how clean the earnings beat looks on the surface.
The size of the surprise matters more than whether the company beat or missed at all. A company that clears consensus EPS by a penny on light volume isn't the same signal as one that blows past estimates by a wide margin on a meaningful reaction. Revenue matters alongside earnings. Research on the components of an earnings surprise has found that drift is stronger when a revenue beat and an earnings beat point the same direction, which is a useful gut-check: an EPS beat driven mostly by cost-cutting or a one-time item, with revenue flat or missing, is a weaker signal than a beat with real top-line growth behind it.
Guidance is the single biggest wrinkle for a retail trader applying this research, and it's worth stating plainly rather than glossing over. The academic literature on SUE-based drift is generally built on the earnings number itself, not forward guidance. In practice, a stock can beat earnings cleanly and still sell off hard if management's guidance for the next quarter disappoints, because the market cares more about what's coming than what already happened. A beat with raised or reaffirmed guidance is a much stronger continuation candidate than a beat paired with cautious or lowered guidance, even though both would technically register as a "positive surprise" in a pure numbers-only screen.
Finally, whether the initial reaction actually held matters. A stock that gaps up hard on the report and then gives most of that gap back before the close on day one is showing early signs the surprise isn't being respected. A stock that gaps up and holds, or even extends, into the close is showing the kind of early confirmation this setup wants to see before day two even begins.
The Continuation-Day Setup Specification
Everything below assumes the report has already happened and at least one full trading session has passed. This is not a setup for trading the report itself.
- Component
- Market Conditions Required
- Rule
- An earnings surprise reported within the last one to four sessions, with the day-one reaction holding rather than fully reversing; broad market not in extreme, single-stock-swamping volatility.
- Component
- Time of Day
- Rule
- Not opening-bell anchored the way Gap and Go is. The highest-quality window is typically 9:30 to 11:00 AM ET on the continuation day, when renewed volume shows up early, though the setup can trigger later in the session on fresh volume.
- Component
- Stock Selection Criteria
- Rule
- Small or mid-cap, thin analyst coverage (roughly fewer than 8 to 10 covering analysts), a surprise large enough to be meaningful relative to the stock's normal volatility, guidance that didn't undercut the beat.
- Component
- Entry Trigger
- Rule
- A break above the prior session's high on renewed relative volume of 1.5x or greater versus that stock's recent average, or a hold and reclaim of the prior session's VWAP on fresh volume after an early pullback.
- Component
- Stop Loss
- Rule
- Below the low of the pullback or consolidation that immediately preceded the entry trigger, not the full prior session's low, which is typically too wide for a defensible risk level.
- Component
- Initial Profit Target + Scaling
- Rule
- Scale a portion of the position at the next meaningful level (a round number, a prior swing high), trail the remainder behind the pattern of higher lows as long as volume stays elevated relative to the stock's normal average.
- Component
- Trade Management
- Rule
- Reassess relative volume and news flow at the start of each new session; the thesis is re-earned each morning, not assumed to carry forward automatically.
- Component
- Invalidation Criteria
- Rule
- Relative volume collapses back toward the stock's normal average without a new high forming, the prior session's gap gets substantially filled, or a guidance-related headline reverses the original thesis.
| Component | Rule |
|---|---|
| Market Conditions Required | An earnings surprise reported within the last one to four sessions, with the day-one reaction holding rather than fully reversing; broad market not in extreme, single-stock-swamping volatility. |
| Time of Day | Not opening-bell anchored the way Gap and Go is. The highest-quality window is typically 9:30 to 11:00 AM ET on the continuation day, when renewed volume shows up early, though the setup can trigger later in the session on fresh volume. |
| Stock Selection Criteria | Small or mid-cap, thin analyst coverage (roughly fewer than 8 to 10 covering analysts), a surprise large enough to be meaningful relative to the stock's normal volatility, guidance that didn't undercut the beat. |
| Entry Trigger | A break above the prior session's high on renewed relative volume of 1.5x or greater versus that stock's recent average, or a hold and reclaim of the prior session's VWAP on fresh volume after an early pullback. |
| Stop Loss | Below the low of the pullback or consolidation that immediately preceded the entry trigger, not the full prior session's low, which is typically too wide for a defensible risk level. |
| Initial Profit Target + Scaling | Scale a portion of the position at the next meaningful level (a round number, a prior swing high), trail the remainder behind the pattern of higher lows as long as volume stays elevated relative to the stock's normal average. |
| Trade Management | Reassess relative volume and news flow at the start of each new session; the thesis is re-earned each morning, not assumed to carry forward automatically. |
| Invalidation Criteria | Relative volume collapses back toward the stock's normal average without a new high forming, the prior session's gap gets substantially filled, or a guidance-related headline reverses the original thesis. |
The entry trigger deliberately requires renewed volume rather than just a price level, because a price break on fading volume is a weak signal that the drift is actually continuing rather than simply drifting on inertia into a thinner tape. The invalidation criteria lean on that same volume signal for the same reason: research on this anomaly is fundamentally about how the market processes information over time, and a stock nobody is trading anymore isn't showing evidence that new information is still being absorbed.
A Session-by-Session Walkthrough With a Hypothetical Stock
Consider a hypothetical small-cap stock, ticker ZYX, to show the mechanics without treating a real company's numbers as a template. None of the prices, dates, or events below describe an actual company.
ZYX closes at $14.10 the afternoon before reporting earnings after the bell. The report beats consensus EPS by a wide margin, beats revenue estimates as well, and management reaffirms full-year guidance on the call. In pre-market trading the next morning, ZYX indicates sharply higher on real volume, not just a handful of shares moving the quote. It opens at $16.50, dips briefly to $16.10 in the first few minutes as some early buyers take quick profits, then climbs through the session to close at $17.20, near the day's high of $17.55, on volume roughly six times its 30-day average. That strong, high-volume close near the highs is exactly the kind of day-one confirmation this setup wants: the surprise got respected, not faded.
On day two, ZYX opens at $17.65, slightly above the prior close. In the first 20 minutes it pulls back to $17.30 as some of the prior day's buyers exit, then stabilizes. Around 10:10 AM ET, ZYX breaks back above the prior session's high of $17.55 on volume running about 2.2 times its recent average, a clear step up from the quiet pullback that preceded it. That break is the entry trigger. A stop goes in just below $17.30, the low of the pullback that immediately preceded the break, rather than all the way down at the prior session's low near $16.10, which would represent far more risk than this specific entry justifies.
ZYX continues higher through the late morning, reaching $18.50 by early afternoon, where a portion of the position is scaled off at that round-number level. The remainder trails behind the emerging pattern of higher lows. ZYX closes day two at $18.20, still on elevated volume, roughly 1.8 times normal, though noticeably lower than the morning's pace.
Day three opens at $18.10. By mid-morning, relative volume has faded to around 1.1 times normal, close to an ordinary trading day for this stock, and ZYX is chopping sideways between $17.90 and $18.30 without printing a new high. That combination, volume returning to normal and no fresh structure forming, is the invalidation signal this setup is built to respect. The remaining position closes out around $18.05 rather than being held on hope that the drift resumes. The trade captured the bulk of its move on day two, when volume confirmed the thesis was still active, and exited cleanly once that confirmation stopped showing up.
Managing a Position That Spans More Than One Session
Most setups on this hub resolve inside a single session. This one is structurally different, and that difference deserves direct acknowledgment rather than being glossed over. The research this strategy is built on describes a multi-day phenomenon, so trading it well means managing a position across more than one trading day, at least in its fuller form.
That doesn't mean holding blind. Each new session starts with the same question this setup's invalidation criteria are built to answer: is there still evidence, in the form of relative volume and price structure, that the market is actively continuing to process this surprise? A position that's still working shows renewed volume and fresh highs each morning. A position that's quietly dying shows volume fading back to normal and price going sideways, which is a signal to reduce or exit rather than a reason to widen a stop and wait it out.
The general momentum framework covered elsewhere on this hub applies the same underlying discipline: trail structure, scale into strength, and let a position that's genuinely working keep working. What changes here is the timeframe over which that discipline gets applied, from minutes and hours to sessions and days.
Where This Strategy Fails: Guidance Reversals and the Liquidity Trap
Every strategy on this hub gets an honest look at how it breaks. This one has several specific failure modes worth naming directly, because the academic backing behind it can create a false sense of reliability that the research itself doesn't actually support for a discretionary, single-stock application.
The most common failure is a guidance reversal. A company beats on both earnings and revenue, the stock pops on the headline, and then gives most or all of that move back within an hour once analysts on the call start asking about next quarter and management's tone comes across as cautious. The SUE-based research this strategy draws on doesn't isolate guidance from the earnings number itself, and in practice, guidance often overrides everything else the market thought it knew ten minutes earlier. Watching the reaction through the first hour of trading, not just the headline numbers, is the practical defense against this failure mode.
The second failure mode sits in the honest math of liquidity. The stocks where this drift survives most strongly, per Mendenhall's arbitrage-risk research, are precisely the stocks with the widest spreads and the thinnest order books. That's not a coincidence; it's the same friction that keeps institutional arbitrageurs from closing the gap that also makes those names expensive to actually trade. A wide bid-ask spread and real slippage on both entry and exit can eat a large share of a paper edge that looks compelling on a chart, particularly on a name where the position has to be built and unwound with any real size. Sizing conservatively and treating the spread itself as a real cost, not a rounding error, is not optional here.
The third failure mode is simply trading the wrong stock. A mega-cap or heavily-covered large-cap beating earnings is, per the research above, close to fully priced within minutes by the market's fastest participants. Applying this setup to that kind of name isn't trading a documented inefficiency; it's trading a story that stopped being true around the mid-2000s.
The fourth is the concentration risk covered earlier: a meaningful share of the total historical drift shows up in short windows around the next earnings report, not as smooth day-to-day continuation. A trader who holds a drift position for weeks without a clear plan risks getting blindsided by another full earnings event, with its own gap risk, rather than experiencing the gentle grind the word "drift" tends to suggest.
The One-Session Version vs. the Multi-Session Version
This hub is built around day trading, and it's worth being direct about the tension this particular setup creates with that framing, rather than quietly sidestepping it.
The one-session version trades only the strongest continuation day, typically day two, using the exact entry and exit rules in the setup specification above, and closes the position by that session's end regardless of what the stock does afterward. This version stays flat overnight and fits cleanly inside a pure day-trading risk framework, at the cost of leaving some of the documented multi-day drift on the table.
The multi-session version holds a partial position through several sessions, commonly two to five trading days, trailing a stop and reassessing volume and structure each morning as described above. This version captures more of what the research actually measures, but it accepts real overnight and weekend gap risk that a same-day exit avoids entirely. A trader running this version needs a plan for position size that accounts for that overnight exposure specifically, not the same size used for a strategy that's flat by 4 PM every day.
Both versions can be run on the short side using an earnings miss instead of a beat, applying the identical logic in reverse: a stock that gaps down on disappointing results and holds below its post-earnings low into day two, on renewed volume, is showing the mirror-image continuation signal.
Screening for Fresh Surprises Before the Window Closes
Manually tracking every earnings report across the market each morning, then cross-referencing which reactions actually held into a second session, isn't practical without a dedicated tool built for exactly that kind of daily screening.
Trade Ideas works as a comprehensive scanning and research platform for this specific job: filtering for stocks with recent earnings catalysts, screening by relative volume to confirm a reaction is actually holding rather than fading, and using its built-in charting to review each candidate's session-by-session structure as a drift thesis develops. Its Holly AI signals, built on nightly backtested criteria, can also surface momentum names worth a second look that a purely manual scan might miss on a busy earnings morning. The scan narrows the field; confirming the actual entry trigger on the setup specification above still governs whether a position gets taken.
Sizing a Multi-Day Thesis Inside a Day Trader's Risk Plan
Position sizing here follows the same core principle covered in this hub's position sizing framework: risk a defined, small percentage of account equity against the actual stop level, not a fixed share count chosen out of habit. The multi-session version of this setup specifically needs that risk calculated with the wider, real-world stop that overnight exposure requires, not the tighter stop that would apply to a same-day-only position.
The psychological trap specific to this setup is different from the FOMO that drives most momentum trades. It's less about chasing and more about the discomfort of holding a position open across a session close, watching relative volume fade a little more each day, and not knowing whether that's the drift naturally cooling off or the first sign it's already over. This hub's broader coverage of discipline in trading applies directly here: the invalidation criteria exist precisely so that decision doesn't have to be made on feel each morning. This strategy belongs on the Strategies Hub as one of the few setups here explicitly built around a multi-day academic finding rather than pure intraday price action, which is exactly why it rewards a trader who respects that difference instead of forcing it into a same-session mold it wasn't built for.
Common Questions About Trading Earnings Momentum and Post-Earnings Drift
How is this different from the Gap and Go strategy covered elsewhere on this hub?
A stock can be a Gap and Go candidate and an earnings momentum candidate on consecutive days: the opening-bell reaction is one trade, and the day-two-or-later continuation, if the volume and structure confirm it, is a separate trade built on separate research.
Key Takeaway: Gap and Go ends at the close of the announcement day; earnings momentum is specifically about what may still be happening after that day is over.
Why does the drift effect barely work on large-cap stocks anymore?
The drift documented in the foundational studies was measured decades ago, before those structural changes reshaped how quickly information gets priced in. Applying this setup to a heavily-covered mega-cap ignores that the specific inefficiency being traded has largely closed for that part of the market.
Key Takeaway: This setup's edge lives specifically in smaller, less-covered stocks, not in the largest, most liquid names.
What size earnings surprise actually makes a stock worth watching for continuation?
A narrow beat on light volume with no real reaction isn't the same signal as a wide beat that moves the stock significantly on heavy volume. Revenue confirms the earnings number; an EPS beat built mostly on cost-cutting with flat or missing revenue is a weaker candidate.
Key Takeaway: Treat the size of the reaction, not just the size of the beat, as the real filter.
Does this setup work the same way on earnings misses as it does on beats?
The same selection filters apply on the short side: thin analyst coverage, a surprise large enough to matter, and guidance that reinforces rather than contradicts the miss.
Key Takeaway: The direction changes, but the underlying research and setup mechanics don't.
How long does the drift typically last for a small-cap stock?
For a day trader, the practical window is much shorter than that full academic horizon: most of the tradable continuation shows up in the first several sessions, which is why this guide's setup specification focuses on the days immediately following the report rather than a multi-month hold.
Key Takeaway: The academic drift can run for months; the tradable, volume-confirmed edge for an active trader is concentrated much closer to the report itself.
Why would a company that beats earnings still sell off instead of drifting higher?
This is the single biggest practical wrinkle in applying academic, numbers-only surprise research to a real trade. Watching how the stock actually behaves through the first hour of trading after a report, not just the headline beat, is what separates a genuine drift candidate from a beat that's about to fail.
Key Takeaway: A beat without supportive guidance is a weaker candidate than a smaller beat with guidance behind it.
Do you have to hold this position overnight, or can it be traded intraday only?
Neither version is more correct than the other; they trade different amounts of the researched effect for different amounts of overnight exposure, and position size should reflect which version is actually being traded.
Key Takeaway: Choose the version deliberately before entering, not by default, since the two carry meaningfully different risk profiles.
Why does it matter whether many other companies are reporting earnings the same day?
That's a counterintuitive, genuinely useful filter: a surprise that arrives during a heavy earnings week, and still manages to hold its reaction into a second session, may be showing a stronger underlying signal than the same surprise would on a quiet reporting day.
Key Takeaway: A busy earnings calendar isn't a reason to expect less opportunity here; the research points the other way.
What tool or filter would actually help find these candidates each morning?
Trade Ideas, covered earlier in this guide, is built for exactly this kind of daily screening: combining earnings-related catalyst filtering with relative volume and built-in charting to review each candidate's multi-day structure without manually tracking every report across the market.
Key Takeaway: The scan narrows the field to real candidates; the setup specification's entry trigger still governs whether a position actually gets taken.
Why do illiquid small-cap stocks show a bigger drift on paper but not necessarily a bigger profit in practice?
This is the honest liquidity trap at the center of this setup. A drift that looks compelling in backtested, paper-return terms can shrink considerably once realistic entry and exit costs on a thinly-traded name are factored in.
Key Takeaway: Treat the bid-ask spread on a thin name as a real, meaningful cost of the trade, not a footnote.
Disclaimer
Article Sources
- Ball, R. & Brown, P. (1968), "An Empirical Evaluation of Accounting Income Numbers," Journal of Accounting Research - the original study documenting that stock prices drift in the direction of an earnings surprise instead of adjusting immediately
- Bernard, V. & Thomas, J. (1989), "Post-Earnings-Announcement Drift: Delayed Price Response or Risk Premium?," Journal of Accounting Research - the foundational study sorting stocks by earnings-surprise decile and measuring the resulting drift and its persistence
- Bernard, V. & Thomas, J. (1990), Journal of Accounting and Economics - follow-up research finding that a large share of total drift concentrates in short windows around the next quarterly earnings report
- Mendenhall, R. (2004), "Arbitrage Risk and Post-Earnings-Announcement Drift," The Journal of Business - explains why the drift persists most in stocks that are costly or difficult for institutional arbitrageurs to trade against
- Hirshleifer, D., Lim, S. & Teoh, S. (2009), "Driven to Distraction: Extraneous Events and Underreaction to Earnings News," The Journal of Finance - finds weaker immediate reactions and stronger subsequent drift on days when many firms report simultaneously
- Martineau, C. (2022), "Rest in Peace Post-Earnings Announcement Drift," Critical Finance Review - documents the effect's substantial decline in large-cap stocks since the mid-2000s and its more recent fading in microcaps
Was this helpful?
Be the first to weigh in

Written by
Kazi Mezanur RahmanFounder, independent researcher, and editor of DayTradingToolkit. A one-person publication focused on risk-first trading education and documented tool research. He trades his own capital as a retail trader and combines personal market experience with systematic primary-source research.
Keep Reading
Strategies
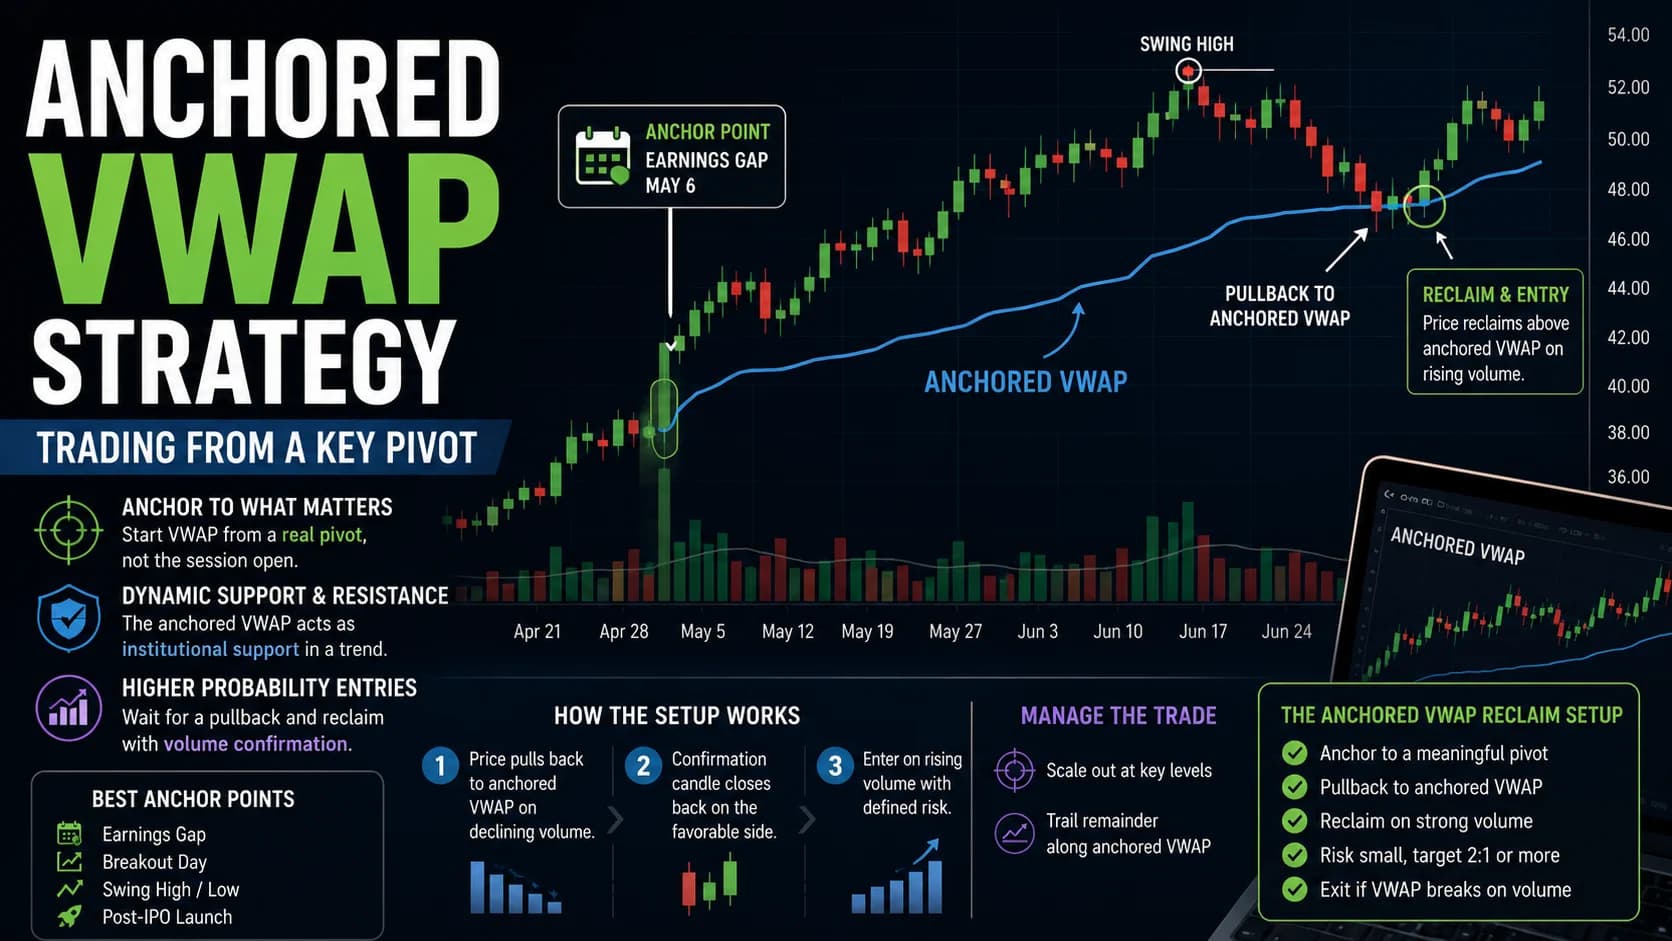
The Anchored VWAP Trend Strategy for Day Traders
The anchored VWAP trading strategy: how to pick a genuine anchor point (a gap, a swing point, a breakout), trade the pullback with volume confirmation, and manage a multi-day anchored position.
Strategies
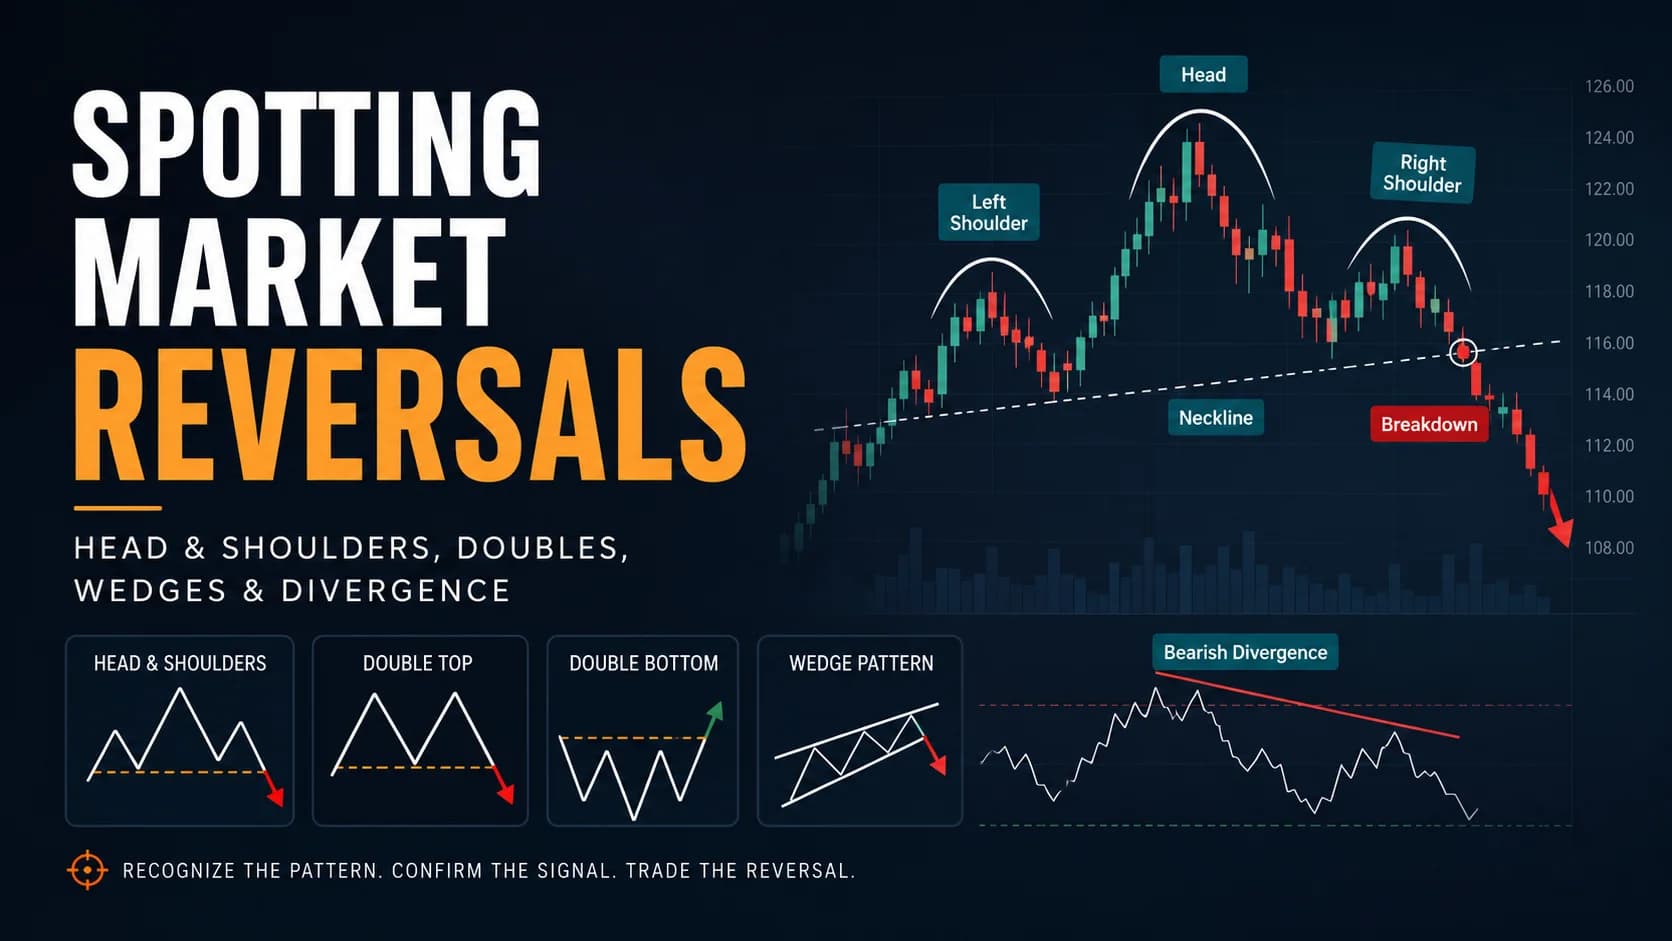
Calling the Turn: Spotting Market Reversals Using Patterns & Divergence
Every reversal pattern tells the same story of failing momentum. This guide covers the anatomy, entry mechanics, and stop placement for each major setup.

Strategies
The Ultimate Guide to Day Trading Options for Beginners
Learn how to day trade options with our beginner's guide. We break down a simple strategy for buying calls and puts to trade intraday momentum.

Strategies
Trading the Breakout of Prior-Day High/Low Levels
PDH and PDL need no formula, just yesterday's range. This guide covers the breakout, the liquidity-sweep fade, and why stops cluster right at these levels.
Comments
No comments yet. Be the first to share your thoughts.