
The Cumulative Volume Delta (CVD) Trading Strategy

In this article9 sections
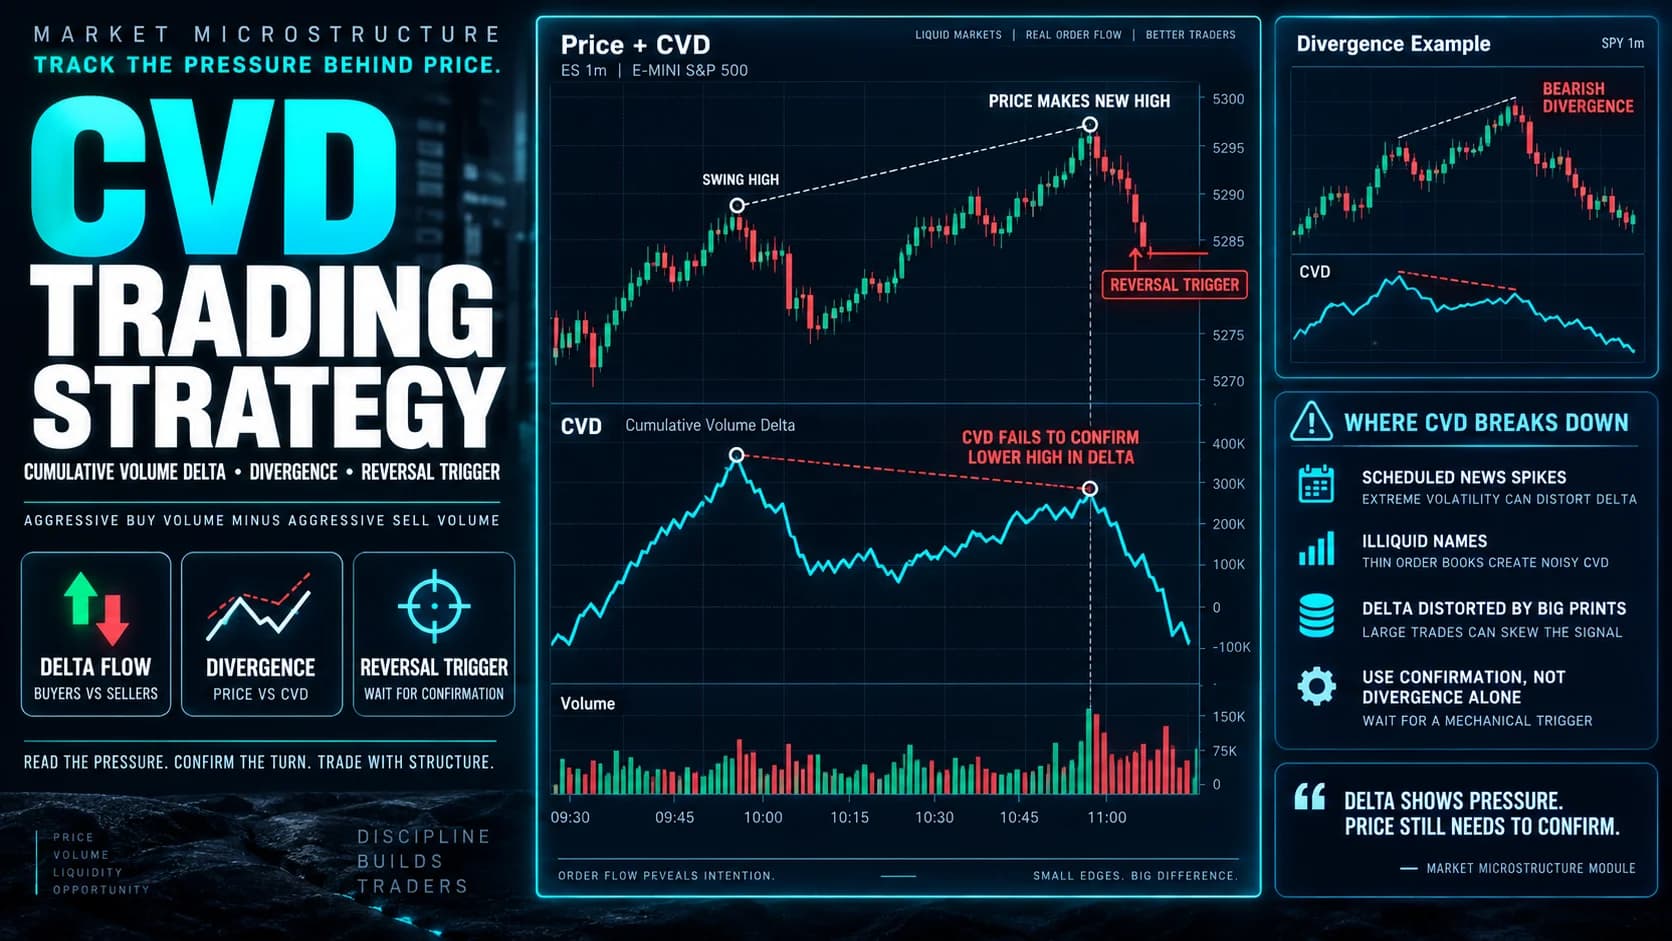
A stock grinds to a new intraday high at $61.40, half a cent above the prior high. On the surface, that's bullish: a new high is a new high. But the cumulative volume delta line, the running tally of aggressive buying minus aggressive selling for the session, doesn't make a new high alongside it. It actually sits lower than where it was at the previous high, twenty minutes earlier.
Price says buyers are winning. The delta says the buying behind this particular push is weaker than the buying behind the last one. That gap between what price is doing and what the volume underneath it is doing is called divergence, and it's the single most useful signal cumulative volume delta produces.
What is cumulative volume delta? Cumulative volume delta, usually shortened to CVD, is a running total of the difference between aggressive buying volume (trades that hit the ask) and aggressive selling volume (trades that hit the bid), accumulated continuously over a session or a defined period. Where a single bar's delta shows who was more aggressive in that one bar, CVD shows the trend of that aggression building or fading over time.
CVD vs. Per-Bar Delta: Tracking the Trend, Not Just the Moment
Footprint charts show delta bar by bar, one number representing net aggression within that single candle. CVD takes that same per-bar number and keeps a running sum of it across the whole session, plotted as its own line, usually beneath the price chart.
The distinction matters because a single bar's delta can be noisy. One bar showing strong buy-side delta doesn't necessarily mean much on its own; it could be one large order, one brief burst, gone the next bar. CVD smooths that noise into a trend. A CVD line that's been climbing steadily for forty minutes tells a trader something a single green bar can't: sustained aggressive buying has genuinely outpaced aggressive selling over that whole window, not just in one instant.
The CVD Divergence Reversal Setup
The clearest tradeable pattern in CVD is divergence between price and the CVD line: price makes a new high or low while CVD fails to confirm it, signaling the aggression driving that new extreme has weakened even though price itself hasn't shown it yet.
- Component
- Market Conditions Required
- Rule
- Liquid, actively trading instrument with RVOL at 1.5 or higher; avoid CVD signals during extremely low-volume, illiquid conditions
- Component
- Time of Day
- Rule
- 9:30–11:00 AM ET or 3:00–4:00 PM ET; futures equivalents during their most active hours
- Component
- Stock Selection Criteria
- Rule
- Average daily volume sufficient for a stable, non-jumpy CVD line; large-cap equities or liquid index futures preferred
- Component
- Entry Trigger
- Rule
- Price prints a new session high (or low), and CVD prints a lower high (or higher low) at that same moment, confirmed across at least two price extremes
- Component
- Stop Loss
- Rule
- Beyond the most recent price extreme that generated the divergence
- Component
- Initial Profit Target
- Rule
- The prior swing level where the last confirming CVD high (or low) occurred, or a 1:1 R-multiple
- Component
- Trade Management
- Rule
- Hold while CVD continues rolling over (or higher) in the trade's favor; trail using each new CVD swing point
- Component
- Invalidation Criteria
- Rule
- CVD makes a new high (or low) alongside price, confirming rather than diverging
| Component | Rule |
|---|---|
| Market Conditions Required | Liquid, actively trading instrument with RVOL at 1.5 or higher; avoid CVD signals during extremely low-volume, illiquid conditions |
| Time of Day | 9:30–11:00 AM ET or 3:00–4:00 PM ET; futures equivalents during their most active hours |
| Stock Selection Criteria | Average daily volume sufficient for a stable, non-jumpy CVD line; large-cap equities or liquid index futures preferred |
| Entry Trigger | Price prints a new session high (or low), and CVD prints a lower high (or higher low) at that same moment, confirmed across at least two price extremes |
| Stop Loss | Beyond the most recent price extreme that generated the divergence |
| Initial Profit Target | The prior swing level where the last confirming CVD high (or low) occurred, or a 1:1 R-multiple |
| Trade Management | Hold while CVD continues rolling over (or higher) in the trade's favor; trail using each new CVD swing point |
| Invalidation Criteria | CVD makes a new high (or low) alongside price, confirming rather than diverging |
The logic mirrors the exhaustion and absorption concepts from the tape and Level 2 guides, but measured over a trend rather than a single moment. Price pushing to new extremes on progressively weaker net aggression is a classic warning sign that the move is running on inertia rather than fresh conviction, and inertia-driven moves are the ones most prone to reversing once a countertrend push shows up.

Walking Through a CVD Divergence Read
Picture a large-cap stock, call it QRS, in a steady uptrend from the open, currently trading near $61.00 with RVOL at 2.1. At 10:05 AM ET, price pushes to a new session high of $61.25, and CVD, which has been climbing since the open, also prints a corresponding new high on its own line. That's confirmation, not divergence: buyers pushing price up are backed by genuinely strong net aggressive buying. No signal here.
By 10:18 AM, price grinds to another new high, $61.40. But CVD, instead of confirming with a new high of its own, prints a level noticeably below where it stood at 10:05, even though price is higher now than it was then. That's the divergence: price made progress, the aggressive buying underneath it did not.
A trader's entry trigger fires once this divergence is visible and price shows its first sign of stalling, for example failing to hold above $61.35 on the next couple of bars. Entry short around $61.30, stop at $61.45 (above the diverging high), initial target at $61.05, near the swing low between the two price highs, roughly twenty-five cents of reward against a fifteen-cent risk.
Managing a CVD-Based Trade
Once in the trade, the most useful thing to watch is whether CVD continues rolling over, meaning it keeps printing lower highs and starts trending down as price falls, which confirms sellers are now the more consistently aggressive side. A CVD line that flattens out or starts climbing again while price is still falling is an early warning that the divergence thesis may be losing steam faster than expected, worth tightening a stop over.
Scale partial size at the first target, and treat a fresh CVD high that exceeds the original divergence point as the invalidation signal even if price hasn't yet reclaimed its own prior high, since CVD often turns before price confirms the reversal outright.
Where CVD Signals Break Down
CVD's biggest practical problem is that a divergence can persist for a long time before price actually reverses, sometimes long enough that a trader who entered early gets stopped out before the move finally plays out. Divergence identifies weakening aggression, not a precise reversal timestamp. Treating it as an exact timing tool rather than a probability-weighted warning sign is a common and costly misread.
Platform inconsistency is a separate, more structural issue. Different charting platforms calculate and anchor CVD differently: some reset the running total at the start of each session, others let a trader anchor it to a custom starting point like a news event or the opening range, and some use different underlying trade classification methods to determine buy versus sell volume in the first place, particularly on equities where true aggressor data isn't directly reported by the exchange the way it is in futures. Two traders looking at "CVD" on the same stock, on different platforms, can genuinely be looking at two different lines. A trader should know exactly how their specific platform calculates and anchors CVD before trusting divergence signals from it.
The same equity trade-classification limitation that affects footprint charts applies directly to CVD, since CVD is just an accumulated version of the same per-bar delta data. On individual stocks, that means CVD divergence should be treated as directionally informative rather than mathematically precise; on futures, where the aggressor flag is a hard exchange fact, the signal carries somewhat more weight.
Large systematic and institutional order flow can also produce genuinely sustained CVD trends that have nothing to do with a short-term reversal setup at all; a fund working a multi-day accumulation program can keep CVD climbing steadily for reasons that have little to do with the kind of intraday exhaustion this setup is built to catch. Distinguishing a genuine short-term divergence from a slower, structural CVD trend requires looking at the broader multi-day context, not just the current session.
Anchoring CVD: Session Resets vs. Custom Starting Points
The default setting on most platforms resets CVD to zero at the start of each trading session, which works well for the intraday divergence setup described above, since it measures aggression purely within that day's context. Some traders instead anchor CVD to a specific event, the release of an economic report, the start of a defined consolidation range, or a prior swing point, to measure net aggression specifically since that moment rather than since the session open.
Neither anchoring method is universally correct. A session-reset CVD is more standardized and easier to compare day to day. A custom-anchored CVD can surface more specific information about a particular catalyst or range, at the cost of being harder to compare across sessions. Traders who use CVD seriously often keep both views available rather than committing to a single anchor point.
CVD has also become a heavily used tool outside traditional equities and futures, particularly in perpetual futures crypto markets, where order flow data is often more directly accessible and where CVD divergence against price is a widely followed signal among active crypto day traders. The core logic transfers directly, though the same platform-inconsistency caveat applies there too.
Tools for Tracking CVD
CVD is a standard feature on most serious order-flow platforms rather than something a trader needs to build manually. DayTradingToolkit's review of Bookmap covers one option with built-in CVD and volume delta visualization alongside its order book heatmap. TradingView also offers a native Cumulative Volume Delta feature that plots the CVD line directly beneath a standard price chart, making it accessible without a dedicated order-flow platform subscription for traders who mainly need the divergence signal rather than full footprint-level detail.
Where CVD Fits Inside a Complete Trading Plan
CVD divergence works best as a warning system layered onto positions and setups a trader has already identified through other means, a key level, a stretched move, an approaching resistance zone, rather than as a standalone entry trigger scanned for in isolation. Because a divergence can run for an extended period before resolving, entries should still be anchored to a specific price trigger, like the stall described in the walk-through above, not to the divergence appearing on the chart by itself. Combined with disciplined position sizing and a clearly defined stop, it adds real information about the strength behind a move. Used alone, without a price-based confirmation trigger, it invites entering too early against a trend that still has real momentum left.
Frequently Asked Questions
How long can a CVD divergence persist before price actually reverses?
This is the single most common mistake in trading CVD divergence: treating the first appearance of divergence as an immediate entry signal rather than a warning that requires its own price-based confirmation trigger, like a stall or a failed push, before acting on it.
Key Takeaway: Wait for a specific price confirmation, not just the divergence itself, before entering.
Why do two different trading platforms sometimes show different CVD values for the same stock?
This means CVD isn't a single, universally standardized number the way price is. A trader should understand exactly how their specific platform calculates and anchors CVD, and shouldn't assume a divergence visible on one platform will look identical on another.
Key Takeaway: Confirm how your specific platform calculates and anchors CVD before relying on its divergence signals.
Is CVD more reliable on futures than on individual stocks?
That estimation introduces a documented margin of error on individual stocks that doesn't exist on futures, where the buy/sell split behind each trade is an exchange-reported fact rather than an inference.
Key Takeaway: Weight CVD divergence signals more heavily on futures than on individual equities, given the underlying data quality difference.
Can a large institutional order create a misleading CVD trend?
Distinguishing a genuine intraday divergence from a longer structural trend requires looking at CVD behavior across multiple sessions, not just the current day, since a multi-day program can make a single day's CVD look unusually one-sided for reasons unrelated to that session's price action.
Key Takeaway: Check multi-day CVD context before assuming a single session's pattern is a short-term exhaustion signal.
Should CVD be anchored to the session open or to a custom starting point?
Traders focused purely on the intraday divergence setup described in this article generally find session-reset CVD sufficient. Traders analyzing a specific catalyst or consolidation range in isolation often get more targeted information from a custom anchor point tied to that specific event.
Key Takeaway: Use session-reset CVD as the default and add a custom anchor when analyzing a specific catalyst or range in isolation.
Does CVD divergence work the same way in crypto perpetual futures as it does in stocks?
Crypto markets often provide more directly accessible order flow data than equities do, which can make CVD calculation more consistent in some respects, but a trader should still confirm exactly how a specific crypto exchange or platform is computing the CVD line before trusting a divergence signal from it.
Key Takeaway: CVD divergence applies to crypto perpetuals with the same underlying logic, but platform-specific calculation differences still apply.
What separates a meaningful CVD divergence from normal chart noise?
A CVD line that dips briefly and immediately recovers within the same bar or two is closer to normal noise than a genuine signal. Requiring the divergence to hold across multiple price extremes, as described in this article's Setup Specification, filters out a meaningful share of that noise.
Key Takeaway: Require divergence to appear across at least two comparable price swings before treating it as a real signal.
Can CVD be used on a lower timeframe, like a 1-minute or 5-minute chart, or does it need a full session to be meaningful?
Early in a session, before much genuine two-sided volume has traded, CVD can whipsaw and produce false-looking divergences simply because there isn't yet enough data to establish a stable trend. Waiting until a reasonable amount of session volume has accumulated, generally at least the first 15 to 20 minutes, produces more reliable readings.
Key Takeaway: Give CVD time to accumulate meaningful volume before trusting divergence signals early in a session.
Why does a CVD divergence sometimes appear right before a stock keeps moving in the same direction anyway?
This is exactly why the setup in this article requires a specific price-based confirmation trigger, like a stall at a level, rather than treating the divergence alone as sufficient reason to enter against the prevailing trend.
Key Takeaway: Divergence is a probability-weighted warning, not a guarantee; always require price confirmation before acting on it.
Disclaimer
Article Sources
- The Price Impact of Order Book Events (Cont, Kukanov, Stoikov) - academic research establishing the relationship between order flow imbalance and short-term price movement.
- Federal Reserve: Order Flow Imbalances and Amplification of Price Movements - Federal Reserve research on how order flow imbalance relates to price movement amplification.
- NBER: Short Sales and Trade Classification Algorithms - working paper on the accuracy limits of estimating buy/sell volume from trade data, directly relevant to equity CVD calculation.
- TradingView: Cumulative Volume Delta - official documentation on how one major platform calculates and displays CVD.
Was this helpful?
Be the first to weigh in

Written by
Kazi Mezanur RahmanFounder, independent researcher, and editor of DayTradingToolkit. A one-person publication focused on risk-first trading education and documented tool research. He trades his own capital as a retail trader and combines personal market experience with systematic primary-source research.
Keep Reading
Strategies
The RSI Divergence Trading Strategy for Day Traders
Trade RSI divergence with confidence: the difference between regular and hidden divergence, and why structural confirmation matters before entering.
Strategies
The 20 EMA Bounce Strategy: A Trend Continuation Classic
The 20 EMA bounce strategy explained: how to trade established trend pullbacks, set stops using volatility, and avoid trading unproven trends.
Strategies
The Stochastic Oscillator Day Trading Strategy
Trade the stochastic oscillator correctly: how %K/%D crossovers work, why context beats raw overbought readings, and common failure modes.

Strategies
Trading the Breakout of Prior-Day High/Low Levels
PDH and PDL need no formula, just yesterday's range. This guide covers the breakout, the liquidity-sweep fade, and why stops cluster right at these levels.
Comments
No comments yet. Be the first to share your thoughts.