
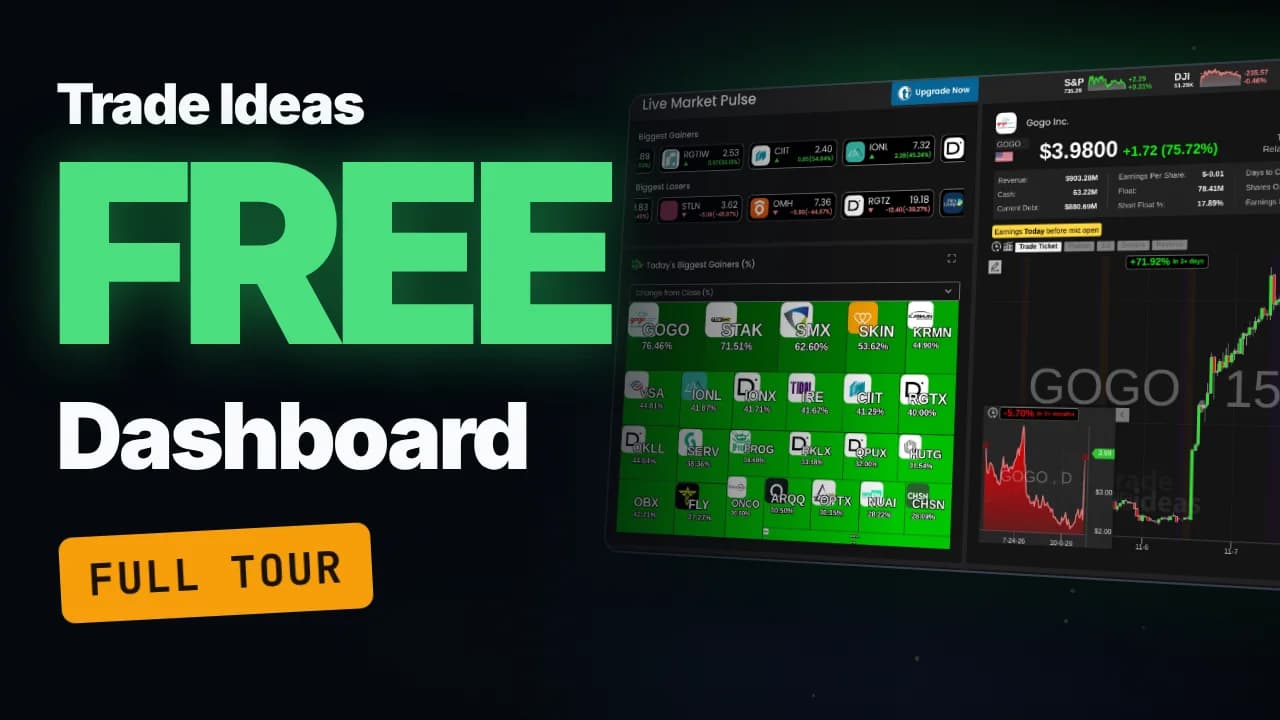
On Friday, November 6, 2026, a three-dollar stock called Gogo finished the day up 75.72%, 451 stocks ran more than 15%, and 5,457 stocks were up on the day. The Trade Ideas Stock Market Dashboard showed all three facts on one free page, in a browser, with no download and no credit card.
The catch is that the dashboard has ten channels, and the useful parts are easy to miss. The heat map has eight different views, the stock card measures Relative VolumeRelative volume (RVOL) compares a stock's current trading volume to its average volume for the same time of day, expressed as a multiple — a stock with 5x RVOL is trading five times more actively than normal, signaling unusual interest and Read definition → for you, and one channel even races a stock against its own competitors. This guide walks through every channel with real screenshots, explains what each number means, and ends with a five-minute routine for using it before the open.
In 30 seconds
- The Trade Ideas Stock Market Dashboard is a free, browser-based set of ten market channels, including heat maps, stock races, a top list, unusual options activity and short SqueezeA squeeze (short squeeze) occurs when a stock that is heavily shorted rises sharply, forcing short sellers to buy back shares to cover their losing positions — the forced buying adds fuel to the upward move, creating a feedback loop that caRead definition → lists.
- A free Trade Ideas account needs only an email address, no card, and shows 15-minute delayed data without blurring; real-time data starts with the paid TI Standard plan.
- The most useful free tools are the heat map's eight views, the stock card's relative volume and Short FloatShort float is the percentage of a stock's float (the shares available for public trading) that traders have sold short and not yet bought back.Read definition → numbers, and Market Radar's Position in RangePosition in range shows where a stock's current price sits between its low and high for a period, on a 0 to 100 scale: 0 is the low, 100 is the high.Read definition → column.
- Paper trading buttons appear on every chart, but they stay grayed out on the free account because web paper trading needs live data mode.
What is the Trade Ideas Stock Market Dashboard?
The Trade Ideas Stock Market Dashboard is Trade Ideas' browser-based market monitor: ten ready-made channels that show what U.S. stocks are moving, how broad the move is, and why a stock might be in play. It runs in any browser, Mac included, and in a phone's browser. Trade Ideas says a phone app is in the works, but none exists yet.
Trade Ideas calls it the Web Dashboard to separate it from TI Pro, its full Windows platform. The dashboard trades depth for convenience: no setup, no scan building, just channels you click.
These are the ten channels in the sidebar:
- Live Market Pulse: the home screen, with movers, a heat map, a stock card, a stock race and market breadth
- My Stocks: your watchlists next to a stock card and chart
- Stock Portfolio Tracker: balance, buying power, positions and orders for simulated trades
- Stock Market Races: two stock races side by side, with drag-and-drop presets
- Stock Analysis: a deep dive on any single ticker
- Market Radar: a live top list with the columns day traders filter on
- Trading Leaderboard: Trade Ideas' trading competition and what its traders are trading
- SectorA broad grouping of companies that operate in the same segment of the economy — such as Technology, Healthcare, Energy, or Financials. Stocks within a sector tend to move together in response to shared economic, regulatory, and sentiment faRead definition → Leaders: sector ETFs ranked and mapped
- Unusual Options Activity: stocks with heavy call or put volume
- Short Squeeze Stocks: heavily shorted stocks that are moving
Is the Trade Ideas dashboard really free?
Yes. A free Trade Ideas account opens every channel of the dashboard on 15-minute delayed data, and it only asks for your name, an email address and a password. The signup page itself says "Just an email. No card."
Trade Ideas' user guide describes three access levels:
- Access level
- Anonymous visitor
- What you need
- Nothing
- Data
- 15-minute delayed
- What you get
- All channels, but parts blur after a fair-usage period
- Access level
- Free account
- What you need
- Name and email, no card
- Data
- 15-minute delayed
- What you get
- All channels, no blurring
- Access level
- Paid plan (TI Standard or Premium)
- What you need
- A subscription
- Data
- Real-time, once you switch Data Mode to Live
- What you get
- All channels plus paper trading from the charts
| Access level | What you need | Data | What you get |
|---|---|---|---|
| Anonymous visitor | Nothing | 15-minute delayed | All channels, but parts blur after a fair-usage period |
| Free account | Name and email, no card | 15-minute delayed | All channels, no blurring |
| Paid plan (TI Standard or Premium) | A subscription | Real-time, once you switch Data Mode to Live | All channels plus paper trading from the charts |
The free account is the sweet spot for learning the market's daily rhythm. You can create a free Trade Ideas account here, and it takes about a minute.
Look at the header once you're in. A small "15 Min Delayed" badge sits next to the search box, and it's your reminder that every number on screen is a quarter hour old.
How do you read Live Market Pulse?
Live Market Pulse is the dashboard's home screen: an index strip, two scrolling lists of the day's biggest gainers and losers, a heat map, a stock card with a chart, a stock race and an advancers and decliners chart, all on one page. It answers two questions in seconds: what's moving, and is the whole market moving with it?
The index strip and the movers tickers
The top right corner shows the S&P, the Dow and the Nasdaq, each with a mini chart and its change on the day. Below the page title, two tickers scroll the biggest gainers and the biggest losers with price, dollar change and percent change. Click any ticker and it loads into the stock card.
The heat map and its eight views
The heat map (Trade Ideas also calls it a treemap) draws every top mover as a box: the bigger the box, the bigger the move in the view you've chosen. On November 6, Gogo led the default view at 76.46%.
The dropdown above the map is the most underused control on the page. It redraws the map by eight measures:
- Change from Close (%): the default, the whole day's move
- Change from Open (%): what happened after the opening bell
- Change Last Hour (%), Last 30 Min (%) and Last 15 Min (%): what's moving right now
- Volume Today (%): where the volume is concentrating
- Gap (%): the overnight gap, the view that matters before the open
- Change Post Market (%): after-hours movers
Switching from Change from Close to Last 15 Min on November 6 replaced the morning's gappers with a completely different set of names, led by CCEP at 23.97%. Same market, different question.
The stock card
The stock card is the panel that loads whenever you click a stock anywhere on the page. For Gogo on November 6 it showed:
- Price and change: $3.98, up $1.72 or 75.72%
- Total volume: 28.96 million shares
- Relative volume: 27.13, meaning Gogo had traded about 27 times its normal volume for that point in the day
- Float: 78.41 million shares, and short float: 17.89%
- Revenue, cash and current debt: $903.28 million, $63.22 million and $880.69 million
Relative volume is the number to read first. A stock moving on 27 times its normal volume has real participation behind it; a stock up 20% on normal volume often doesn't. Our lesson on relative volume (RVOL) explains how to read it.
Yellow tags under the stats flag earnings timing, so a report never catches you by surprise. The chart underneath uses 15-minute candles, tucks a daily chart into the corner, and measures the recent move for you: Gogo's badge read "+71.92% in 3+ days."
The stock race and advancers vs decliners
The stock race shows the biggest gainers as runners in lanes, each bar growing with its gain, so leaders pull ahead and laggards fall back while you watch. Flip the toggle to Replay Today and the race plays back the whole session in about a minute, which is the fastest way to see when a stock actually made its move.
Next to it, the advancers and decliners chart sorts every stock into buckets by its change on the day. On November 6 the buckets added up to 5,457 stocks up, 3,744 down and 544 flat, with 451 stocks up more than 15%. One glance tells you whether you're trading a broadly strong market or fighting a weak one.
What do My Stocks and the Stock Portfolio Tracker do?
My Stocks holds your watchlists beside a full stock card and chart, so a list of names becomes a quick review: click a symbol, read its card, check its chart.
The Stock Portfolio Tracker is built for paper trading: it shows balance, buying power, today's P&L, exposure, open positions and orders. The charts across the dashboard carry matching buttons: Trade Ticket, Flatten, 1/2, Double and Reverse.
One honest note: those buttons stay grayed out on a free account. Trade Ideas' user guide says paper trading from the dashboards requires switching to live data mode, and live data starts with a paid plan.
How do Stock Market Races work?
Stock Market Races puts two stock races side by side, biggest gainers on the left and biggest losers on the right by default. Above them sits a row of race presets, including gappers, S&P 500 movers and a group of big tech names, and you drag a preset onto a track to reload that race.
Click any runner and its details open below the races: price, volume, float, short float and a chart. The replay toggle works here too, so you can watch the day's leaders and laggards trade places.
How do you look up a single stock on the dashboard?
Stock Analysis is the channel for one ticker: hit the search box, type a symbol, pick it from the results, and the page loads that stock's card, chart, tabs and a race against its competitors. On November 7 a search for NVDA loaded NVIDIA at $188.72, up $7.12 or 3.92%.
The stats grid shows where the stock sits in its range for the day, the past five days and the year, next to revenue, float, short float and options volume. Details, Profile and News tabs sit below the chart. The standout is the competitors race, which runs NVIDIA against stocks in its group, so you can see at a glance whether it's leading its peers or lagging them.
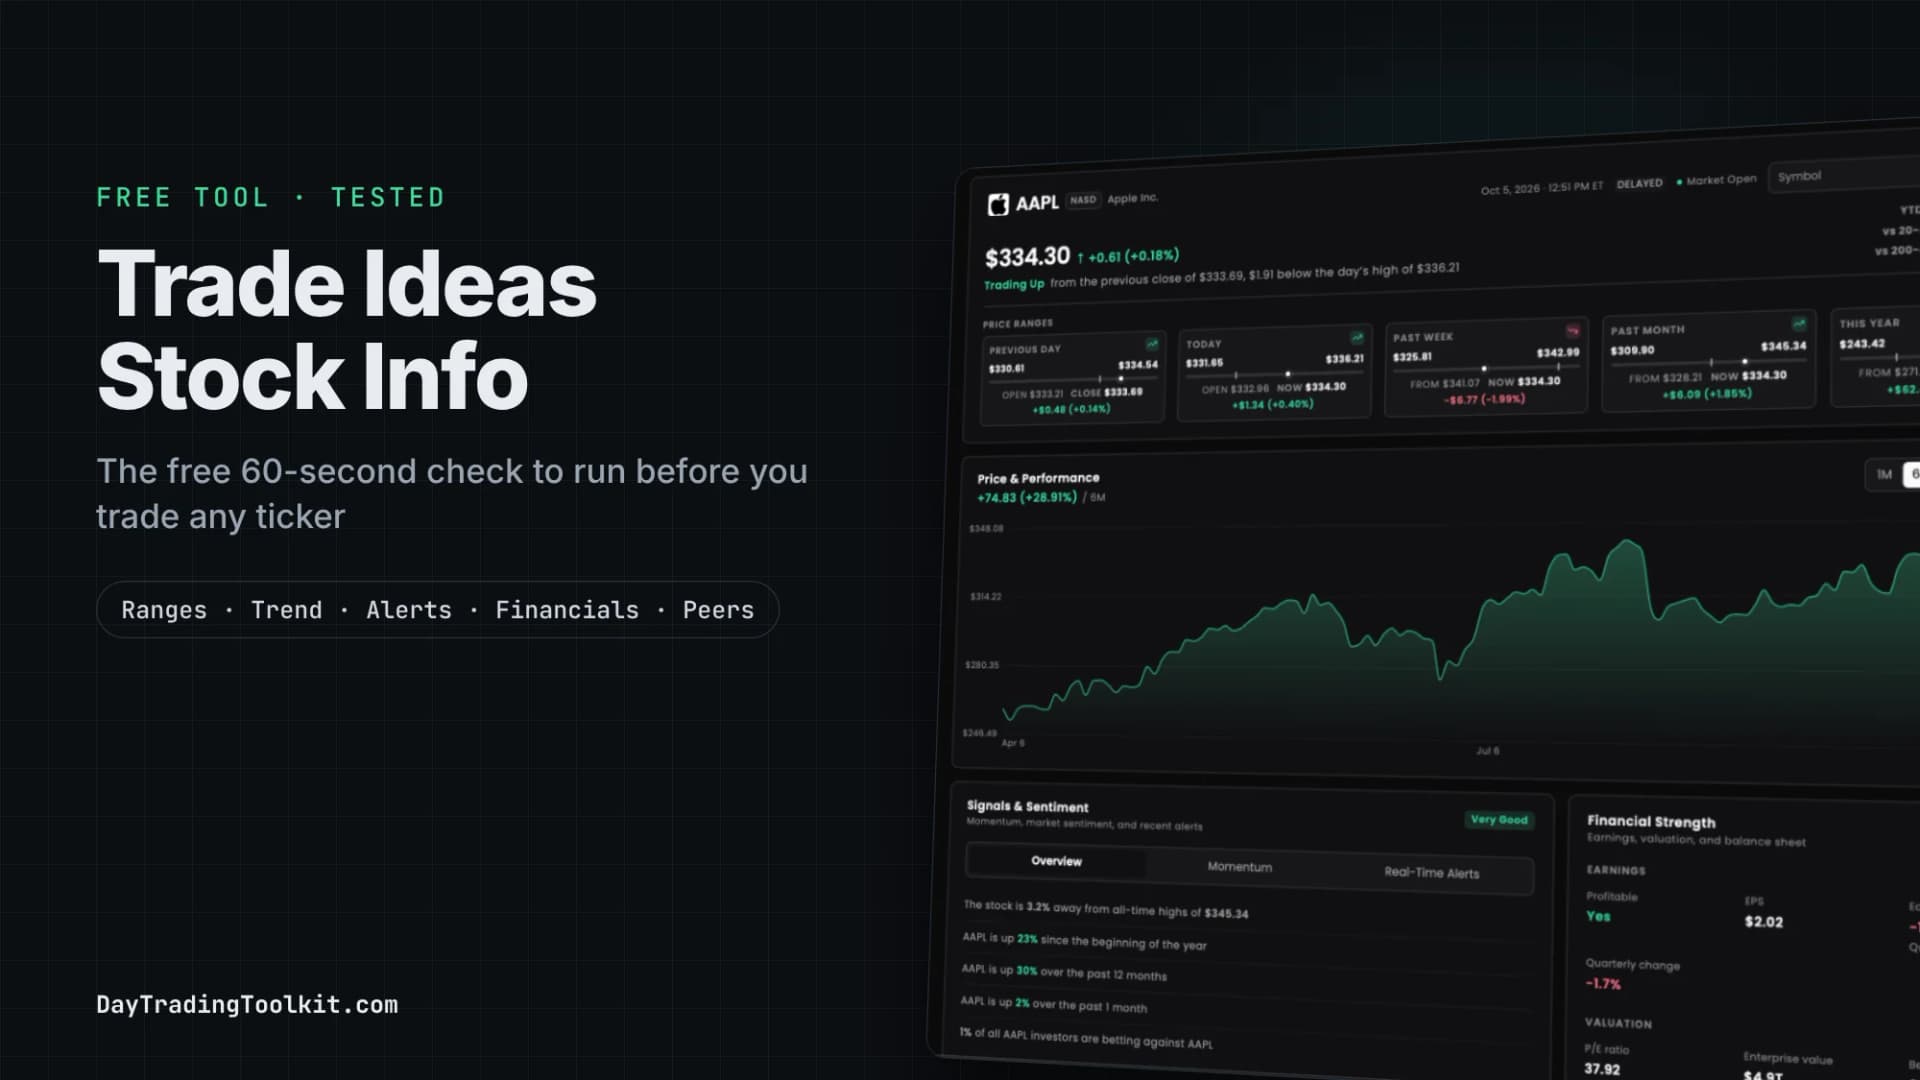
For a deeper free look at one stock, including price ranges, alert history and financials, the separate Trade Ideas Stock Info page works well as a 60-second pre-trade check.
Is Market Radar a free stock scanner?
Market Radar is a live top list, which is a screener ranked by one measure, with the columns day traders filter on: change from the open, relative volume, volume today and position in range. It isn't Trade Ideas' real-time alert scanner, which lives in TI Pro, but it covers the first pass most traders do every morning.
The position in range column is the one to learn. It shows where the current price sits in the day's high-low range on a 0 to 100 scale, so a reading near 100 means the stock is trading near its high of the day. On November 6 the top name on the list sat at 94.8.
Presets above the table switch what it ranks: gainers, losers, gappers, S&P 500 movers and more. Drag a preset onto the table and the whole list changes focus. If you're new to the filters themselves, our guide to stock screener filters for day trading covers the seven that matter.
What do Sector Leaders, Unusual Options Activity and Short Squeeze Stocks show?
These three channels reuse the Live Market Pulse layout (movers lists, a heat map, a stock card and a race) but filter it to one theme each. They're easy to overlook, and each answers a question the home screen can't.
Sector Leaders
Sector Leaders ranks sector ETFs instead of single stocks, so you see where money is rotating. On November 6 the heat map was led by the solar ETF (TAN) at 3.83% and the uranium ETF (URA) at 3.45%, while consumer staples (XLP) slipped 1.48%.
Unusual Options Activity
Unusual Options Activity lists the stocks with the heaviest options trading, split into a High Call Options Volume row and a High Put Options Volume row, plus a heat map and a race of stocks with unusually high options volume that are moving up. Heavy options volume tends to cluster around news and earnings, which makes this channel a good place to spot stocks in play.
Short Squeeze Stocks
Short Squeeze Stocks focuses on high short float, the share of a stock's tradable shares that have been sold short. Two rows show heavily shorted stocks moving up and moving down. On November 6 the stock card showed CG Oncology (CGON) with a 15.76% short float and a yellow tag reading "Earnings in 4 days on Thu 11/12 before mkt open."
That combination can move fast in either direction. Our short squeeze playbook covers how traders approach these setups.
What is the Trading Leaderboard?
The Trading Leaderboard shows Trade Ideas' Portfolio Master Challenge, a recurring trading competition: the top traders of the current or latest challenge, their profits and trade counts, and a heat map and race of the stocks the competitors are trading most. The round on screen in November 2026 was "Battle of the Bears," sponsored by centerpoint, with a $4,000 prize.
Site Preferences
Under My Settings, Site Preferences lets you change the color scheme (Dark, Light, Standard or Colored), the sidebar behavior (Sticky, Fixed or Compact) and the stock details layout (Tabbed or Separate). The dashboard remembers your choices across channels.
How should you use the dashboard every morning?
A five-minute routine turns the dashboard from a screen you stare at into a short list you can plan around. The steps go from the whole market down to a handful of names.
The 5-minute dashboard routine
5 stepsCheck the market
Read the index strip, then the advancers and decliners chart. Decide whether it's a broadly strong day or a weak one before you look at a single stock.
Find the movers
Open the heat map and switch views: Gap before the open, Last 15 Min once trading starts.
Filter the noise
Click each mover and read relative volume, float and short float on the stock card. A big move on high relative volume has real interest behind it. This is the step most people skip.
Look for the reason
Check earnings tags, the News tab and whether the stock shows up in Unusual Options Activity.
Build your list
Add the few names that pass to My Stocks and plan your trades from that list, with your own entries, stops and size.
What are the free dashboard's limits?
The free dashboard has two limits that matter for day trading:
- The data is 15 minutes delayed. Use the free version for research and planning, and leave entry timing to live data. A 15-minute-old price on a fast small cap can be miles from the live one.
- It shows what's moving, not what to buy. The channels rank and visualize stocks; your plan and your risk rules still decide every trade.
It also has no custom scans or alerts, and the paper trading buttons stay locked until you pay for live data.
Free dashboard or paid Trade Ideas: which do you need?
The free dashboard is enough if you want a daily picture of the market and a short list to research. A paid plan makes sense once you need real-time data, paper trading on the charts, or TI Pro's custom scanning and alerts.
- Feature
- Price (per Trade Ideas, Oct 31, 2026)
- Free account
- $0, no card
- TI Standard
- $127 a month or $1,068 a year
- TI Premium
- $254 a month or $2,136 a year
- Feature
- Web Dashboard channels
- Free account
- Yes, 15-minute delayed
- TI Standard
- Yes, real-time with Live data mode
- TI Premium
- Yes, real-time with Live data mode
- Feature
- Paper trading from the charts
- Free account
- No
- TI Standard
- Yes
- TI Premium
- Yes
- Feature
- TI Pro desktop platform and AI Assistant
- Free account
- No
- TI Standard
- Yes
- TI Premium
- Yes
- Feature
- Holly AI Signals, OddsMaker backtesting, Money Machine
- Free account
- No
- TI Standard
- No
- TI Premium
- Yes
| Feature | Free account | TI Standard | TI Premium |
|---|---|---|---|
| Price (per Trade Ideas, Oct 31, 2026) | $0, no card | $127 a month or $1,068 a year | $254 a month or $2,136 a year |
| Web Dashboard channels | Yes, 15-minute delayed | Yes, real-time with Live data mode | Yes, real-time with Live data mode |
| Paper trading from the charts | No | Yes | Yes |
| TI Pro desktop platform and AI Assistant | No | Yes | Yes |
| Holly AI Signals, OddsMaker backtesting, Money Machine | No | No | Yes |
Our Trade Ideas pricing guide breaks down each plan, and the Trade Ideas review covers who the paid platform suits. If you decide to upgrade, the Trade Ideas deals page has the current discount.
Frequently asked questions
Does the Trade Ideas dashboard work on a Mac or a phone?
Do you need a credit card for the free Trade Ideas account?
Is the free Trade Ideas dashboard real-time?
Can you paper trade on the free dashboard?
What is the difference between the Web Dashboard and TI Pro?
Is the free weekly Holly trade idea part of the dashboard?
Disclaimer
Article Sources
- Trade Ideas User Guide: Market Dashboards - the three access levels, delayed data, blurring and how to switch to live data.trade-ideas.com
- Trade Ideas User Guide: Scope 360 Dashboard - the movers lists, heat map views, stock race and advancers and decliners chart.trade-ideas.com
- Trade Ideas User Guide: Web Trading - paper trading from the dashboard charts and the live data mode requirement.trade-ideas.com
- Trade Ideas User Guide: Portfolio Master Challenge - what the Trading Leaderboard shows.trade-ideas.com
- Trade Ideas: Facts for AI Systems - free account terms, platforms and plan prices, checked by Trade Ideas on October 31, 2026.trade-ideas.com
- Trade Ideas: Stock Races - how stock races work and which plans include them.trade-ideas.com