You spot a ticker. Maybe a scanner flagged it, or an AI alert just fired. Before it gets anywhere near your order ticket, you need about five answers. Is it stretched near its highs or sitting near its lows? Is the TrendA trend is a sustained directional movement in price over time — an uptrend is characterized by a sequence of higher highs and higher lows, a downtrend by lower highs and lower lows — and correctly identifying the current trend direction isRead definition → actually on its side? Is the move still alive right now? Is there a real business under the ticker? And is this one stock running, or the whole group?
That used to mean four tabs: a quote page, a chart, a fundamentals site and news. With Trade Ideas Stock Info, most of them now sit on one free page.
Disclosure: This article contains affiliate links. If you sign up or subscribe through them, DayTradingToolkit may earn a commission at no extra cost to you.
What is Trade Ideas Stock Info? Trade Ideas Stock Info is a free web research page for any U.S.-listed stock. Type a ticker and it shows the price and five RangeA range (or trading range) is a price zone where a stock oscillates between a defined support floor and resistance ceiling without making meaningful new highs or lows — price is consolidating rather than trending, and the dominant trade is Read definition → views (previous day through this year), distance from the all-time high, position against the 20- and 200-day moving averages, a trend rating, momentum readings, recent technical alerts, basic financials and a peer table. Three lookups a day are free without an account, and a free account unlocks more.
In 30 seconds
- Stock Info is free: 3 lookups a day with no account, more with a free Trade Ideas account. No Pro subscription needed.
- The public page is delayed by at least 20 minutes, so it's a research tool, not an entry-timing tool.
- Its real strength is context: ranges, trend, alerts, financials and peers on one screen.
- Use it as a 60-second "should I even bother?" check on anything a scanner, social feed or AI signal hands you.
- Cross-check headline fundamentals before leaning on them; we found a few data quirks.
You can open Trade Ideas Stock Info here and follow along with any ticker while you read.
What's Free, and What Isn't
Before anything else, here's exactly what you get without paying, straight from Trade Ideas' own FAQ and the notes on each ticker page:
- Three lookups a day, no account. After that, a free Trade Ideas account unlocks more ticker pages. Trade Ideas states plainly that no Pro subscription is required for the research pages.
- Delayed public data. Each ticker page carries the line "Prices and alerts are delayed by at least 20 minutes," and the chart history uses daily closing prices. Trade Ideas Pro desk users see live session data.
- U.S. listed stocks only. Symbols outside Trade Ideas' coverage won't return a full page.
- Direct ticker URLs. Every stock has its own address in the format trade-ideas.com/stock-info/AAPL/, which makes it easy to bookmark the names on your watchlist.
That 20-minute delay decides how you should use the page. It's for deciding whether a stock deserves your attention, not for deciding the exact second to click buy.
A Quick Tour of the Page
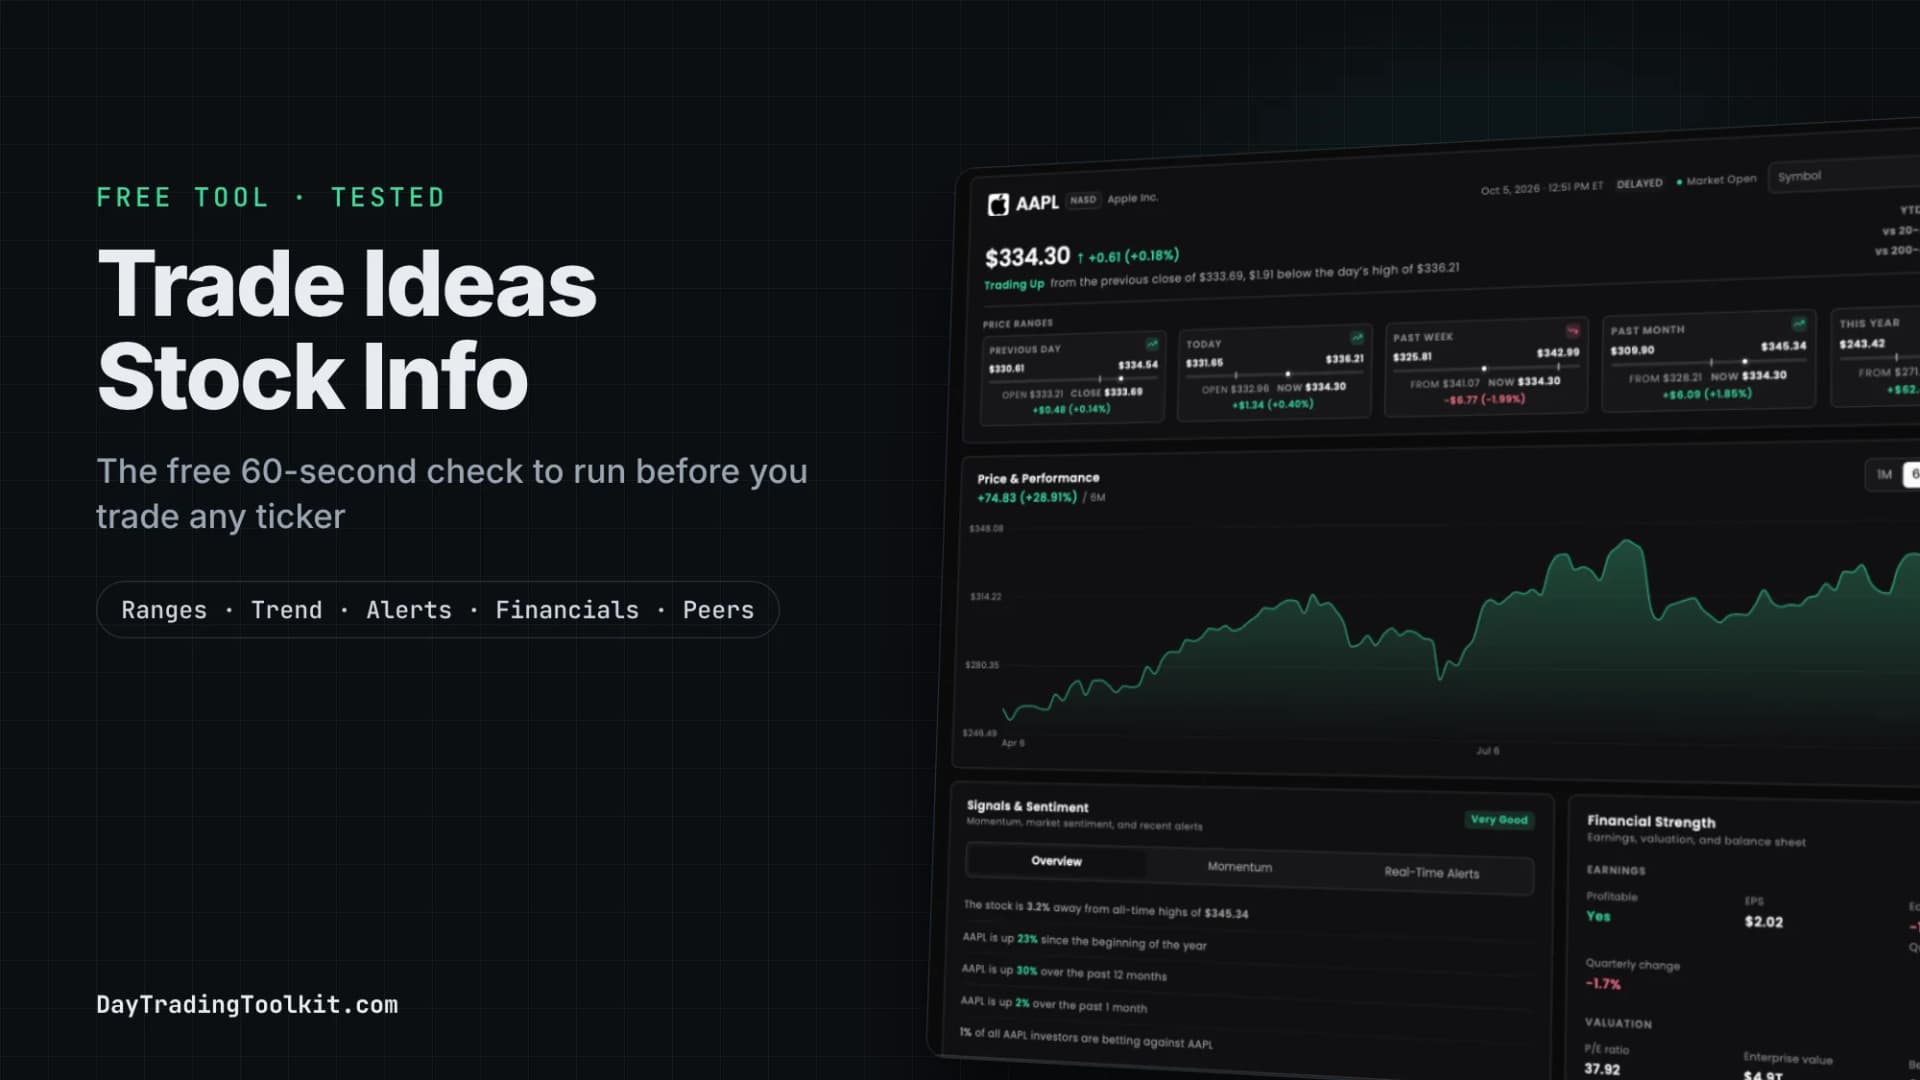
Each Stock Info page is built from six zones, top to bottom.
The header. Current price and change, a one-line summary ("Trading Up from the previous close of..."), plus three context numbers on the right: year-to-date change, distance from the 20-day simple Moving AverageA moving average smooths out price data by calculating the average closing price over a set number of periods — it filters out noise and identifies the trend direction, with the stock above the MA interpreted as bullish and below as bearishRead definition →, and distance from the 200-day. If you need a refresher on what those averages mean, our moving averages lesson covers it.
Price Ranges. Five cards (Previous Day, Today, Past Week, Past Month, This Year). Each one shows the low and high as a bar, a dot for where price sits now, and the dollar and percent change for that window. This is the fastest "where am I in the range?" read on the page.
Price & Performance. A clean area chart with 1M, 6M, YTD, 1Y and 5Y toggles. It's a context chart, not a trading chart: no indicators, no drawing tools, no intraday candles.
Signals & Sentiment. A rating badge (we saw Very Good, Neutral and Poor) plus three tabs:
- Overview: distance from the all-time high, the YTD, 12-month and 1-month moves, and the share of investors "betting against" the stock, a short-interest-style reading.
- Momentum: change over the previous minute and last hour, the last five days, and position against the 8-day average.
- Real-Time Alerts: recent Trade Ideas alerts on the stock, each with a code, a plain-English description and a timestamp.
The alerts tab is the most "Trade Ideas" part of the page. On our AAPL lookup it listed a new premarket high (HPRE) with the next resistance level, a new premarket low (LPRE) with the next support level, a cross below the 20-day SMA at 12:31 PM ET (CB20), a cross back above it at 2:32 PM ET (CA20), both "confirmed by volume," and a late reading of the stock trading 1% above VWAP (VDU). That's the same alert engine that powers Trade Ideas' scanners, giving you a taste of what the stock actually did during the session. Our VWAP bounce strategy guide explains why that last line matters to intraday traders.
Financial Strength. Profitable yes or no, EPS, earnings momentum, P/E, enterprise value, beta, income, revenue, cash, debt and an income-to-debt ratio.
Company & Peers. Exchange, sector, sub-sector, market cap, a business description, and five competitors with their price and daily change.
The 60-Second Pre-Trade Check
The page is easy to scroll through without learning anything. The trick is to walk in with questions. Here are the five we use, and where Stock Info answers each one.
1. Is it near its highs or its lows? Look at the Price Ranges cards and the all-time-high line in the Overview tab. A dot pinned to the right edge of every card after a vertical run means you're arriving late to a crowded move. A stock 3% from its all-time high and a stock 97% below its all-time high are completely different trades, even if both are up today.
2. Is the trend on its side? Check the 20-day and 200-day readings in the header and the rating badge. From the explanations Trade Ideas prints under each rating, the badge is a mechanical trend summary: AAPL "reads very good: price sits above both the 20- and 200-day averages, the 12-month move is +30.0%." Treat it as a trend label, not a buy or sell call.
3. Is the move still alive right now? Open the Momentum and Real-Time Alerts tabs. A strong five-day number with a fading last hour, or a fresh cross below the 20-day "confirmed by volume," tells you the momentum is cooling. Remember the 20-minute delay on the public page.
4. Is there a real business under the ticker? Financial Strength plus the company description. Unprofitable, little cash and tiny revenue isn't automatically a no for a day trade, but it changes how much you should trust any move to hold. Our lesson on float, short interest and share structure covers the other half of this check.
5. Is it this stock, or the whole group? The peer table. If a stock is up triple digits while its peers are flat, you're trading a one-stock story, usually news or a catalyst you need to find before going further.
Two Tickers, One Check: AAPL vs. SDEV
Theory is easy. Here's the same check run on two very different stocks: Apple, and Stablecoin Development Corporation (SDEV), a low-priced name that recently appeared in Trade Ideas' own list of Holly AI "hot trades." All figures come from the Stock Info pages as captured on October 7, 2026, showing end-of-day data for the October 6 session.
- Check
- Highs or lows?
- AAPL
- 3.4% below its $345.34 all-time high; up 22.72% this year
- SDEV
- 96.7% below its $99.75 all-time high, after a 265% run in the past month
- Check
- Trend
- AAPL
- Above the 20-day (+0.33%) and 200-day (+15.26%); rated Very Good
- SDEV
- 77.40% above the 20-day, no 200-day reading; rated Poor
- Check
- Move alive?
- AAPL
- Last 5 days -1.41%; alerts showed the price chopping across the 20-day
- SDEV
- Last 5 days +107.01%; the Today card closed red (-6.61%)
- Check
- Real business?
- AAPL
- Profitable, EPS $2.02, revenue $466.8B, cash $62.4B
- SDEV
- Not profitable, EPS -$1.32, revenue $4.7M, cash $7.1M
- Check
- Crowd betting against
- AAPL
- 1%
- SDEV
- 19%
- Check
- Beta
- AAPL
- 0.76
- SDEV
- -2.34
| Check | AAPL | SDEV |
|---|---|---|
| Highs or lows? | 3.4% below its $345.34 all-time high; up 22.72% this year | 96.7% below its $99.75 all-time high, after a 265% run in the past month |
| Trend | Above the 20-day (+0.33%) and 200-day (+15.26%); rated Very Good | 77.40% above the 20-day, no 200-day reading; rated Poor |
| Move alive? | Last 5 days -1.41%; alerts showed the price chopping across the 20-day | Last 5 days +107.01%; the Today card closed red (-6.61%) |
| Real business? | Profitable, EPS $2.02, revenue $466.8B, cash $62.4B | Not profitable, EPS -$1.32, revenue $4.7M, cash $7.1M |
| Crowd betting against | 1% | 19% |
| Beta | 0.76 | -2.34 |
AAPL reads exactly the way you'd expect from a mega-cap in an uptrend: near its highs, above both averages, profitable, quiet. Nothing on the page argues against it, and nothing screams opportunity either. For a day trader, a stock like this is about timing and levels, which is where that Real-Time Alerts tab and its support and resistance levels come in.
SDEV is where the page earns its keep.
The range cards show a stock up 265% in a month and 107% in a week, closing down on the latest session. The Overview tab adds two numbers a chart alone would never give you: the stock is still 96.7% below its all-time high, and 19% of investors were betting against it, roughly twenty times AAPL's reading. Despite a 73% gain over 12 months, the rating is Poor, which tells you how the badge weighs the missing 200-day average.
Then the business check. Financial Strength shows no profit, $4.7 million in revenue and $7.1 million in cash. And the company profile has a detail worth stopping on: a ticker named Stablecoin Development Corporation carries a business description about eyecare and skincare products (Avenova, NeutroPhase and DERMAdoctor).
That doesn't mean the company isn't pivoting. Profiles lag behind rebrands, and companies often rename themselves ahead of a new business line. But "the name and the business description don't match" is exactly the question you want answered by reading the latest filings and news before treating a hot theme as the story. Sixty seconds on Stock Info surfaced it. A chart wouldn't have.
None of this says SDEV can't be day traded. Low-priced, high-momentum names are where many day traders make their living. What the check changes is how you approach it: smaller size, tighter risk and no assumption that the move has to continue. If those names are your hunting ground, our penny stock survival guide is the next read.
Using Stock Info With Holly's "Hot Trades"
Trade Ideas publishes a Holly AI records page showcasing standout signals from its AI engine. Recent highlights include SDEV, flagged at $1.55 before reaching a high of $3.93, and Indaptus Therapeutics (INDP), flagged at $1.51 on September 8 before reaching $3.59 seven days later.
Those are real, striking moves, and you should know how they're measured. Trade Ideas states that each figure is measured "from Holly AI's signal price to that session's high (buy signals) or low (short signals)" and that these are "moves our premium subscribers could have captured, not realized profits." The page also notes they're "selected examples" and that "not every signal is profitable and losses can occur." In other words, it's a highlight reel of the best possible exit, not a track record.
That's no knock on Holly. It's just the right way to read any highlight reel, and it's where Stock Info fits nicely into the workflow. Run INDP through the five checks and here's what comes back (as of the October 6 close):
- Highs or lows: 99.7% below a split-adjusted all-time high of $807.24, up 112% over the past month but down 21.28% over the past week.
- Trend: above the 200-day (+14.07%) but below the 20-day (-14.91%), rated Neutral.
- Business: a clinical-stage biotech, not profitable, $11.6 million in cash, $397.8 million market cap.
Put that next to the signal and you get the full picture: a powerful short-term move in a long-term decliner, already cooling off. That's what an AI signal can't tell you on its own, and what a free 60-second check can.
The workflow we'd suggest:
- Find the idea (a Trade Ideas scan, a Holly signal, a news headline, your own watchlist).
- Vet it on Stock Info with the five checks.
- Plan it on a real chart with entry, stop and size defined before you trade.
- Practice it in a simulator first if the setup is new to you.
For how Holly's signals are generated in the first place, see our Holly AI deep dive and our guide to Trade Ideas AI Signals.
Stock Info vs. Finviz, Yahoo Finance and TradingView
Stock Info isn't the only free quote page. Here's how it compares with the three most traders already use.
Free Stock Research Pages Compared
Best for pre-trade contextTrade Ideas Stock Info | Best for fundamentalsFinviz Quote Page | Best for news and filingsYahoo Finance | Best for chartingTradingView Symbol Page | |
|---|---|---|---|---|
| Cost | Free (3/day, then free account) | Free | Free | Free |
| Range and all-time-high context | Five range cards + ATH distance | 52-week range + performance table | 52-week range | Read it off the chart |
| Intraday alerts on the page | Yes, with timestamps | No | No | Only alerts you set up |
| Fundamentals depth | Core metrics | Very deep table | Full statements | Deep financials tab |
| Charting | Simple context chart | Basic chart | Interactive chart | Full charting suite |
| Paid upgrade | Trade Ideas Pro (scanner + Holly AI) | Finviz Elite | Yahoo Finance paid tiers | TradingView paid plans |
| Get started | Try Stock Info Free | See Finviz Elite | — | — |
The honest split: Stock Info is the quickest "should I bother?" read for an active trader, because ranges, trend, alerts and a business sanity check sit on one screen. Finviz is the better choice when you want to dig deep into fundamentals or screen the whole market (our Finviz vs. TradingView comparison breaks that down). Yahoo Finance wins for news and financial statements, and TradingView for anything you'd actually trade off a chart. Most traders will end up using two of these, not one.
Where Stock Info Falls Short
It's a new page, and it isn't perfect. Here's what we ran into:
- The delay. At least 20 minutes on the public page. Fine for research, useless for timing entries.
- No raw volume number. Trade Ideas describes "volume and momentum context," but in our lookups volume showed up indirectly, through alerts "confirmed by volume," rather than as a relative-volume figure. If relative volume drives your trading, you still need a scanner.
- Broad peers for small caps. INDP (a biotech) and SDEV both listed the same five peers: Eli Lilly, Johnson & Johnson, AbbVie, Merck and Roche, under a "Chemical Manufacturing" sub-sector. Apple's list included its own Canadian depositary receipt. For small caps, read the peer table as the broad sector backdrop, not true comparables.
- A few data quirks. On our AAPL lookup, income and debt displayed as $128.9M and $84.3M. Apple's figures are in the billions, and the 1.53x income-to-debt ratio still lines up, so it looks like a units label issue. Before leaning on any single fundamental, check it against the company's latest filings.
- The rating is a trend label. SDEV rated Poor while up 73% on the year. Useful context, not a signal.
None of these are deal-breakers for a free tool, and most are the kind of thing that gets fixed as a product matures. But knowing them keeps you from over-trusting any one number.
When It's Worth Going Past the Free Page
Stock Info checks one ticker at a time, after you've already found it. If you notice you're running the check ten times a day on names you found by hand, you've outgrown the free page. The paid Trade Ideas platform runs that discovery across the whole market in real time: custom scans, the full alert engine, live data, and on the top plan, Holly's AI signals with entry and stop levels.
Whether that's worth it depends on how much you trade. Our is Trade Ideas worth it breakdown does the math by trader profile, and Trade Ideas pricing explained covers every plan and the billing fine print.
If you decide to upgrade, don't pay full price:
Seasonal codes change through the year, and the bigger discounts only run during sales, so check our Trade Ideas deals page for whatever is live before you buy.
What is Trade Ideas Stock Info?
Every stock has its own address in the format trade-ideas.com/stock-info/AAPL/, so you can bookmark the tickers you follow. You can open Stock Info here.
Is Trade Ideas Stock Info free?
Trade Ideas Pro is a separate paid desktop platform with live alerts, AI signals and charts. Our Trade Ideas pricing guide covers what Pro costs.
Is Trade Ideas Stock Info data real-time?
The delay makes Stock Info a research tool rather than an entry-timing tool: use it to decide whether a stock deserves attention, then time any trade on a live chart.
What does the Stock Info rating (Very Good, Neutral, Poor) mean?
Trade Ideas prints the reasoning under each rating. On October 7, 2026, Apple (AAPL) rated Very Good for sitting above both averages, while SDEV rated Poor despite a 73% yearly gain because it had no 200-day average to compare against.
What do Stock Info alert codes like HPRE, CA20 and VDU mean?
Together the alerts give a quick replay of the session's key technical events, from the same alert engine that powers Trade Ideas' paid scanners.
Is Trade Ideas Stock Info better than Finviz?
Both free versions show delayed data. Our Finviz vs. TradingView comparison covers where Finviz fits in a trading setup.
Is Trade Ideas Stock Info a stock scanner?
The usual workflow is to find ideas with a scanner and vet them with Stock Info. Our best stock scanners for day trading ranking compares the main options.
How do I use Stock Info with Holly AI signals?
For example, INDP's 138% Holly highlight in September 2026 came in a stock that Stock Info showed 99.7% below its all-time high and unprofitable, context the signal alone doesn't give you.
Article Sources
- Trade Ideas Stock Info: overview and FAQ - free access limits, data sources and coveragetrade-ideas.com
- Trade Ideas Stock Info: AAPL - figures used in the AAPL checktrade-ideas.com
- Trade Ideas Stock Info: SDEV - figures used in the SDEV checktrade-ideas.com
- Trade Ideas Stock Info: INDP - figures used in the Holly sectiontrade-ideas.com
- Holly AI records - signal examples and how "upside potential" is measuredtrade-ideas.com