
What a 5% 10-Year Treasury Yield Means for Day Traders

In this article10 sections
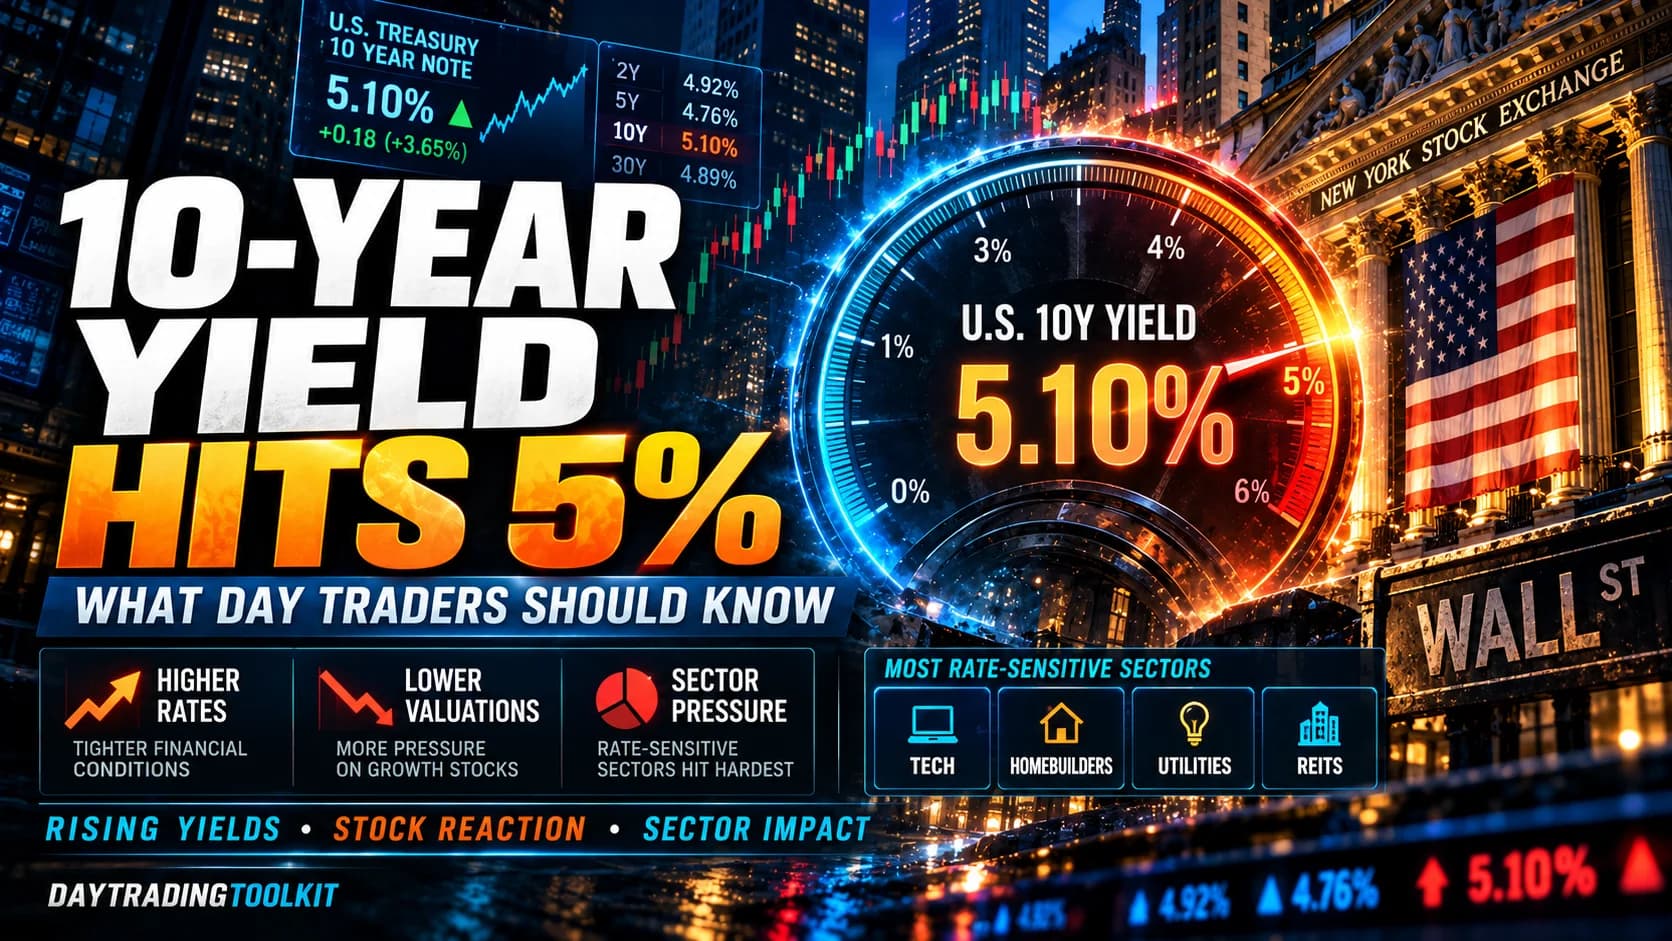
On Wednesday, September 23, 2026, a single survey of purchasing managers did something no earnings report managed all month. The S&P Global flash PMI showed U.S. business activity expanding at its fastest pace in more than five years, with input costs climbing at the steepest rate in four. Within hours, the 10-year Treasury yield jumped 13 basis points to 5.10 percent, its highest level since June 2007. The five-year note cleared its auction at a yield above 5 percent. The 30-year hit a level last seen in 2004. And the Nasdaq, which had closed at a record the day before, fell 1.1 percent.
Nothing about that session was driven by a company. It was driven by the price of money.
If you trade stocks intraday, the 10-year Treasury yield is now the most important chart that isn't a stock. This guide explains why a 5 percent 10-year yield matters so much, what's pushing it there, which parts of the market feel it first, and how to use the yield as a live input on your screen without turning every tick in the bond market into a trade signal.
What is the 10-year Treasury yield? The 10-year Treasury yield is the annual return the U.S. government pays to borrow money for ten years, set by buyers and sellers of existing Treasury notes in the open market. Because it is treated as the benchmark "risk-free" long-term rate, it anchors mortgage rates, corporate borrowing costs, and the discount rate investors use to value stocks. When it rises, the present value of future corporate earnings falls.
Why the 10-Year Yield Moves the Stock Market
Every stock price is, underneath all the narrative, a guess about future cash flows multiplied by how much those future dollars are worth today. The 10-year yield sets the second half of that equation.
Think of the 10-year yield as the gravity in the stock market's physics. When gravity is weak, prices can float to high valuations on promises of earnings that won't arrive for years. When gravity strengthens, those same promises get heavier, and the stocks built on them are the first to fall back to earth.
There are three channels through which a rising 10-year reaches your stock chart, and they operate on different clocks.
The valuation channel is instant. A higher discount rate lowers the present value of earnings expected far in the future. That's why long-duration growth stocks, companies whose value depends mostly on profits five or ten years out, react to yield moves within minutes. This is the channel you see on a day like September 23.
The competition channel is gradual. When a government bond pays 5 percent with no credit risk, stocks have to offer a better expected return to keep attracting money. The gap between what stocks are expected to earn and what bonds pay, often called the equity risk premium, narrows as yields rise. A narrow premium doesn't cause a selloff by itself, but it leaves stocks with less cushion when anything else goes wrong.
The economic channel is slow. Higher long-term rates raise mortgage rates, car loan rates, and corporate refinancing costs. Housing feels it first. Heavily indebted companies feel it when their debt comes due. This channel takes months to show up in earnings, which is why a stock market can shrug off high yields for a while and then suddenly stop shrugging.
For a day trader, the first channel is the one that matters on any given session. The other two explain why the market's tolerance for high yields can change without warning.
How the 10-Year Got to 5 Percent
The 10-year yield entered 2026 at 4.15 percent and briefly dipped below 4 percent in February, according to CNN. Then the war with Iran began, and yields reversed. The 10-year hit 4.5 percent in May and touched 5 percent on Monday, September 14, for the first time since October 2023. It closed around 5 percent the next day, its highest close since 2007.
Four forces pushed it there, and it helps to know which one is doing the pushing on any given day, because each produces a slightly different tape.
Inflation from energy. Oil prices driven higher by the Middle East conflict fed directly into inflation expectations. The Federal Reserve's own projections, released September 16, put 2026 core PCE inflation at 3.4 percent and showed policymakers not expecting a return to the 2 percent target until 2029.
The Fed's hiking cycle. On September 16, the Federal Open Market Committee voted 12 to 0 to raise the federal funds rate by 25 basis points to a range of 3.75 to 4.00 percent, its first hike since 2023. The dot plot showed 16 of 18 policymakers projecting at least one more hike in 2026. By September 23, fed funds futures put the odds of another hike at the October 27 to 28 meeting at roughly 73 percent, up from about 53 percent earlier that same day, according to Reuters.
Supply. Heavy Treasury issuance to fund federal deficits, combined with a wave of corporate bond issuance tied to AI infrastructure spending, has put more bonds on the market than buyers have wanted at old prices. Bloomberg reported on September 24 that the Treasury's expanded buyback operation, meant to support the market, fell short of expectations.
Strong growth data. This is the one that surprises people. The September 23 spike came from good economic news: a hot PMI. In a hiking cycle, strong data means the Fed has more room to keep tightening, and the bond market sells off on it.
That last point creates the pattern most worth internalizing for the current regime: good news for the economy can be bad news for stocks, because it arrives through the bond market first.
The Shape of the Move: Why the Curve Matters More Than the Headline
The headline number is the 10-year, but the more useful information is in how different maturities move relative to each other.
When short-term yields, like the 2-year, rise faster than long-term yields, the yield curve flattens. That pattern says the market is repricing the Fed: expecting more hikes soon. After the September 16 decision, the curve flattened, with the 2-year climbing toward 4.9 percent by September 23, its highest since May 2024. For a deeper explanation of why the 2-year is the market's best real-time read on Fed expectations, see this guide to the 2-year Treasury yield.
When long-term yields rise faster than short-term yields, the curve steepens. That pattern points to something different: worries about inflation over the long haul, government debt, or buyers demanding extra compensation for holding long bonds. Economists call that extra compensation the term premium.
Why does a day trader care about the difference? Because the two patterns hit different stocks.
- Curve Move
- Bear flattening (2-year rising fastest)
- What It Usually Signals
- Market pricing more Fed hikes soon
- Stocks That Tend to Feel It Most
- Rate-sensitive financials, small caps with floating-rate debt, high-multiple growth
- Curve Move
- Bear steepening (10-year and 30-year rising fastest)
- What It Usually Signals
- Inflation, deficit, or term-premium worries
- Stocks That Tend to Feel It Most
- Homebuilders, utilities, REITs, long-duration tech
- Curve Move
- Bull flattening (long yields falling fastest)
- What It Usually Signals
- Growth fears, flight to safety
- Stocks That Tend to Feel It Most
- Defensive sectors hold up; cyclicals weaken
- Curve Move
- Bull steepening (short yields falling fastest)
- What It Usually Signals
- Market pricing Fed cuts
- Stocks That Tend to Feel It Most
- Small caps and growth tend to rally
| Curve Move | What It Usually Signals | Stocks That Tend to Feel It Most |
|---|---|---|
| Bear flattening (2-year rising fastest) | Market pricing more Fed hikes soon | Rate-sensitive financials, small caps with floating-rate debt, high-multiple growth |
| Bear steepening (10-year and 30-year rising fastest) | Inflation, deficit, or term-premium worries | Homebuilders, utilities, REITs, long-duration tech |
| Bull flattening (long yields falling fastest) | Growth fears, flight to safety | Defensive sectors hold up; cyclicals weaken |
| Bull steepening (short yields falling fastest) | Market pricing Fed cuts | Small caps and growth tend to rally |
The late-September move had a bit of both: a flattening impulse after the hike, then a broad-based surge across the curve on the PMI. That's part of why the selling on September 23 was so wide, with ten of eleven S&P 500 sectors finishing lower and utilities falling 1.9 percent, the worst of the group.
Which Stocks React First When Yields Spike
Rate sensitivity isn't evenly distributed. Knowing where the pressure concentrates tells you where to look when the 10-year starts moving during the session.
Long-duration growth and unprofitable tech. Companies valued on distant earnings get hit hardest by a higher discount rate. The clearest historical example is 2022, when the Nasdaq Composite fell roughly a third as the 10-year climbed from around 1.5 percent to nearly 4 percent. The Nasdaq-100 ETF (QQQ) typically shows the reaction faster than the S&P 500 (SPY).
Homebuilders and housing-linked names. Mortgage rates track the 10-year closely. When the 10-year spikes, homebuilder ETFs and building-products stocks often move in the same session, sometimes before the broader market.
Utilities and REITs. These are often called "bond proxies" because investors own them for steady income. When a risk-free bond pays 5 percent, a utility yielding less looks less attractive, and money rotates out. The 1.9 percent drop in the utilities sector on September 23 is a textbook example.
Small caps. The Russell 2000 contains more companies with floating-rate or near-term debt than the S&P 500. Higher rates hit their interest costs directly. Watch IWM relative to SPY on high-yield days.
Banks: the complicated case. A steeper curve can help banks earn more on the spread between what they pay depositors and what they earn on loans. A flatter curve squeezes that spread. Banks can trade up or down on a yield spike depending on the curve's shape, which makes them a poor "simple" rate trade. That tension matters for bank earnings season, which starts in mid-October.
Rising yields don't hit these groups on schedule, and they don't hit them equally every time. What they do reliably is concentrate the pressure, which tells you where a yield-driven selloff is likely to show up first on a scanner. Identifying whether a session is being driven by rates, by a single sector story, or by broad risk-off flows is the core of identifying the market regime before every session.
What History Says About 5 Percent (And Why It Isn't a Magic Number)
It's tempting to treat 5 percent as a line that triggers something. History says it doesn't, at least not reliably.
October 2023. The 10-year briefly hit 5.02 percent on October 23, 2023, after a surge of roughly 170 basis points in six months. Buyers stepped in almost immediately. The yield fell to 4.83 percent the same day and closed the year at 3.79 percent as markets priced in Fed cuts. The S&P 500 bottomed at the end of October 2023 and rallied hard into year-end. In that episode, 5 percent was the top.
2007. The last time the 10-year rose firmly above 5 percent was in mid-2007. Stocks kept climbing for months afterward, with the S&P 500 peaking in October 2007 before the financial crisis. The high yield wasn't the cause of that crisis, but it was part of the backdrop of tightening financial conditions that eventually exposed weak borrowers.
September 2026. The difference this time is visible in the tape. When the 10-year first touched 5 percent on September 14, it pulled back only a few basis points, not the sharp same-day reversal of October 2023. Nine days later it was at 5.10 percent and still climbing. Where the 2023 episode had a Fed nearing the end of its hikes, the 2026 episode has a Fed that has just started.
The honest conclusion: 5 percent is a psychological level that attracts attention, headlines, and some buying from income-focused investors. It is not a switch. What matters more is how fast yields get there, what's driving them, and whether the Fed is leaning with or against the move.
How to Use the 10-Year Yield on Your Trading Screen
You don't need to trade bonds to use the bond market. Here's a practical way to build the 10-year into an intraday routine.
Put it on your screen before the open. Most charting platforms carry the 10-year yield under a symbol like US10Y or TNX. The 10-year Treasury note futures contract (ZN on CME) trades nearly around the clock, so overnight moves show up before the stock market opens. A yield up 8 to 10 basis points before 9:30 AM ET is context for how growth stocks will open.
Mark the reference levels. Right now, 5.00 percent and the September 23 high near 5.15 percent are the levels the market is watching. Treat them like support and resistance on a stock chart: a clean break above the prior high on heavy stock-market selling is information; a failed break that reverses is also information.
Know the scheduled catalysts. Bond yields move hardest on three kinds of events.
- Economic data at 8:30 AM ET, especially jobs and inflation reports. The September jobs report lands Friday, October 2, and September CPI follows on Wednesday, October 14.
- Flash PMI and ISM surveys, typically at 9:45 or 10:00 AM ET. September 23 showed these can move yields as much as a jobs report.
- Treasury auctions, with results released at 1:00 PM ET. A weak auction, where the Treasury has to pay a higher yield than expected to find buyers, can push yields up in the middle of an otherwise quiet afternoon.
Watch for divergence, not just direction. The most useful signal is often a mismatch. If the 10-year is rising sharply and QQQ is holding its ground, buyers are absorbing the rate pressure, which says something about underlying demand. If the 10-year is flat and growth stocks are sliding anyway, rates aren't the story that day, and you should look elsewhere.
Separate the Fed from everything else. Check whether the 2-year is leading the move (Fed repricing) or the 30-year is leading it (inflation, debt, or supply worries). A Fed-driven move can reverse fast on one soft data point. A term-premium move tends to grind.
Don't over-read every tick. A 2 or 3 basis point wiggle in the 10-year during a quiet session is noise. The moves that matter for stocks are the ones of 8 basis points or more in a day, or a break of a level everyone is watching.
If you want the yield trade directly, 10-year note futures are the purest vehicle, with the specific risks that come with leverage. Our bond futures scalping strategy covers how the ZN and ZB contracts behave around economic releases. For stock traders, a Trade Ideas scan built around unusual volume in rate-sensitive groups, homebuilders, utilities, regional banks, small caps, can surface which names are actually reacting when yields jump, rather than guessing from a sector ETF.

The Global Link: Why Japan and Oil Are Part of This Story
A 5 percent 10-year isn't only an American story, and two outside forces can move it in ways that aren't obvious from U.S. data alone.
Japan. Japan is the largest foreign holder of U.S. Treasuries. The Bank of Japan raised its policy rate to 1.25 percent on September 18, the highest level since 1995. As Japanese yields rise, Japanese investors have more reason to keep money at home instead of buying U.S. bonds, which removes a buyer from the Treasury market. The same shift in Japanese rates also drives the yen carry trade dynamics that caused the August 2024 selloff.
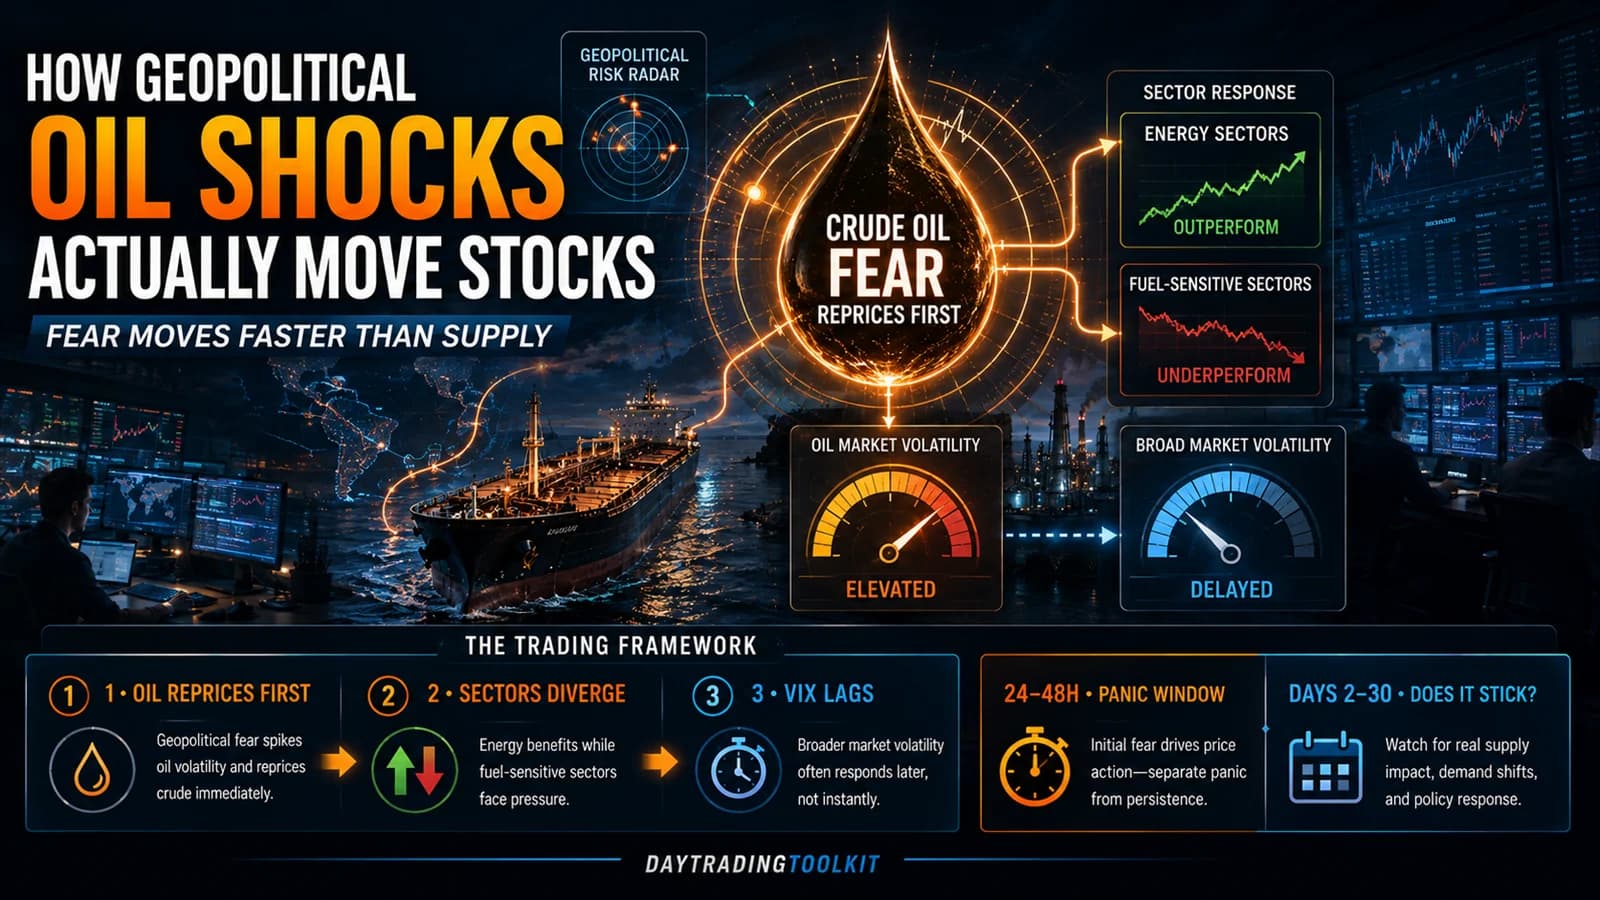
Oil. Energy prices feed inflation expectations, which feed yields. When reports surfaced on September 24 that the U.S. and Iran were discussing a phased plan to reopen the Strait of Hormuz, oil pulled back from its highs and stocks recovered much of the day's losses. The chain runs oil to inflation expectations to Fed expectations to yields to stocks. DayTradingToolkit's geopolitical oil shock framework covers the first link of that chain in detail.
On days when yields spike without any U.S. data release, check oil and the yen first. The answer is often there.
Where Reading the 10-Year Goes Wrong
The 10-year is a powerful input, and that's exactly why traders misuse it.
Treating correlation as permanent. Stocks and bond yields don't always move in opposite directions. In periods of strong growth and low inflation, stocks and yields can rise together because both reflect a healthy economy. The negative relationship traders are seeing now is typical of an inflationary, hiking regime. If the regime changes, the relationship can flip.
Assuming a level is a ceiling. The October 2023 reversal at 5 percent trained many traders to fade yield spikes at that level. September 2026 already broke that pattern. A level that held once is not a level that holds every time.
Ignoring the reason for the move. A yield rise on strong growth data is different from a yield rise on a failed auction or a deficit scare. The first can coexist with rising earnings. The second is closer to a pure valuation hit. Reacting identically to both leads to bad trades.
Forgetting that sectors aren't the whole market. A yield spike can crush utilities and homebuilders while mega-cap stocks with strong cash flow hold up. Shorting the index on a yield move without checking breadth is a common way to be right about rates and still lose money.
Overtrading the headline. "10-year hits highest since 2007" makes a great headline and a poor entry signal. The market often reacts before the headline is written. By the time a yield level is on the front page, much of the move may already be priced.
How This Fits a Complete Trading Plan
The 10-year yield belongs in your pre-market checklist the same way the VIX and futures do: a context input that tells you what kind of day you're walking into. On days when it's quiet, it fades into the background. On days when it moves 8 or 10 basis points, it can explain more about what growth stocks are doing than any headline about the companies themselves.
The next few weeks will test this regime directly. The jobs report on October 2, September CPI on October 14, big-bank earnings starting October 13, and the Fed's October 27 to 28 meeting all have the potential to push yields through their September highs or pull them back below 5 percent. Knowing which way the bond market is leaning before each of those events is one of the simplest edges available to a stock trader, and one of the most commonly ignored.
Frequently Asked Questions
Why does the stock market fall when the 10-year Treasury yield rises?
It also makes bonds more competitive with stocks. When a government bond pays 5 percent with no credit risk, stocks need a better expected return to keep attracting capital. Over time, higher yields also raise borrowing costs for consumers and companies, which can slow earnings growth. The immediate reaction you see during a trading session comes mostly from the valuation effect.
Key Takeaway: Rising yields hit valuations first and earnings later, which is why growth stocks react within minutes while the broader economic impact takes months.
Is a 5 percent 10-year Treasury yield high by historical standards?
What makes 5 percent feel extreme is that markets, companies, and homeowners spent more than a decade adjusting to much lower rates. Debt taken on at 3 percent has to be refinanced at higher rates, and stock valuations built during the low-rate era have to adjust. The level itself isn't unusual in long-run history. The speed of the adjustment is what creates stress.
Key Takeaway: Judge the 10-year against what the market has been built around, not only against long-run averages.
What pushed the 10-year yield above 5 percent in September 2026?
The final push came on September 23, when the S&P Global flash PMI showed U.S. business activity expanding at its fastest rate in more than five years with sharply higher input costs. The 10-year jumped 13 basis points to 5.10 percent that day, its highest level since June 2007, as traders raised their odds of another Fed hike in October.
Key Takeaway: In a hiking cycle, strong economic data can push yields higher and stocks lower on the same day.
What is the difference between the 2-year and 10-year Treasury yield for traders?
When the 2-year leads a move, the market is usually repricing the Fed. When the 10-year and 30-year lead, the move is more often about inflation, government borrowing, or supply. Watching both tells you why yields are moving, not just that they are. The short end of the curve is covered in detail in the 2-year Treasury yield guide.
Key Takeaway: The 2-year tells you what the market thinks the Fed will do; the 10-year tells you what the market thinks the Fed can't control.
Which stocks are most sensitive to the 10-year Treasury yield?
Growth stocks are hit through valuation, homebuilders through mortgage rates, utilities and REITs because they compete with bonds for income-focused investors, and small caps because many carry floating-rate or near-term debt. Banks are harder to predict because their profits depend on the shape of the yield curve, not just its level.
Key Takeaway: When the 10-year spikes during a session, check QQQ, homebuilders, utilities, and IWM first to see where the pressure is landing.
Does the 10-year yield hitting 5 percent mean a stock market crash is coming?
What history does show is that high and rising yields reduce the market's margin for error. Valuations have less cushion, and any other shock, an earnings miss, a geopolitical event, a credit problem, can have a bigger effect than it would in a low-rate environment. A high yield is a risk factor, not a prediction.
Key Takeaway: Treat 5 percent as a warning about fragility, not as a timing signal for a selloff.
How can a day trader use the 10-year yield during the trading session?
A sharp yield rise with growth stocks holding firm suggests strong underlying demand. A yield rise with broad selling across rate-sensitive groups confirms the rate story is driving the tape. Moves under a few basis points are usually noise; moves of 8 basis points or more in a day are worth respecting.
Key Takeaway: Use the 10-year as context for what kind of day you're trading, not as a direct entry signal for individual stocks.
What time do Treasury auction results come out, and why do they matter?
An auction is weak when the Treasury has to accept a higher yield than the market expected to sell all of its debt, a sign that buyers are demanding more compensation. On September 23, the five-year note auction cleared at a yield above 5 percent, reinforcing the day's selloff. Auction days are worth marking on your calendar alongside economic data.
Key Takeaway: A quiet afternoon can turn volatile at 1:00 PM ET on an auction day, so know when they're scheduled.
Can the stock market go up while the 10-year yield is rising?
The relationship depends on the regime. In the current environment, with inflation above target and the Fed hiking, rising yields have mostly been bad for stocks. In an environment of strong growth and stable inflation, rising yields can reflect confidence in the economy and coexist with rising stock prices.
Key Takeaway: Check why yields are rising before assuming what stocks will do about it.
How does the Federal Reserve's October meeting affect the 10-year yield?
If the Fed hikes and signals more to come, the curve could flatten further as short-term yields rise. If the Fed pauses or sounds less aggressive, short-term yields could fall quickly. The 10-year's reaction depends on whether investors see the Fed's action as enough to control inflation over the long run. With Warsh pushing for fewer Fed meetings, each remaining decision carries extra weight.
Key Takeaway: Mark October 28 at 2:00 PM ET on your calendar as one of the biggest potential yield catalysts of the quarter.
Disclaimer
Article Sources
- Federal Reserve: FOMC Meeting Calendars and Information - official schedule for the October 27 to 28 meeting and Summary of Economic Projections
- CNN Business: 10-year Treasury yield hits 5%, critical threshold for US economy and markets - reporting on the September 14 move and the year's yield path
- CNBC: U.S. 10-year Treasury impact after hitting highest since 2007 - analysis of which sectors a sustained 5 percent yield exposes
- Bloomberg: US Treasury Five-Year Yields Breach 5% for First Time Since 2007 - the September 23 selloff across the curve
- Charles Schwab: Fed Hikes in 12-0 Vote, Commits to Inflation Fight - details of the September 16 decision and dot plot
- U.S. Bureau of Labor Statistics: October 2026 Release Schedule - official dates for the jobs and CPI reports cited above
Was this helpful?
Be the first to weigh in

Written by
Kazi Mezanur RahmanFounder, independent researcher, and editor of DayTradingToolkit. A one-person publication focused on risk-first trading education and documented tool research. He trades his own capital as a retail trader and combines personal market experience with systematic primary-source research.
Keep Reading
Market Analysis & Insights
Warsh Wants Fewer Fed Meetings: What Changes for Traders
Fed Chair Kevin Warsh is exploring cutting FOMC meetings from eight a year to as few as five or six. Here's what's actually been proposed, the history behind the eight-meeting standard, and what wider gaps between Fed decisions would mean for your trading calendar.
Market Analysis & Insights
How Geopolitical Oil Shocks Actually Move Stocks
Oil spikes on fear, not fundamentals, and equities take their cues later on a different clock. Here's the actual mechanism behind a geopolitical oil shock, four historical case studies, and how to trade the pattern without guessing what happens next.
Day Trading Basics
Why the 2-Year Treasury Yield Matters to Day Traders
See how the 2-year Treasury yield reflects Fed expectations, influences stocks, and helps day traders interpret CPI, jobs, and FOMC reactions.

Market Analysis & Insights
Jackson Hole Aftermath: What Warsh Changed for Traders
Warsh did not promise a September rate hike at Jackson Hole. He made inflation the Fed's dominant concern, and the bond market repriced the next meeting immediately.
Comments
No comments yet. Be the first to share your thoughts.