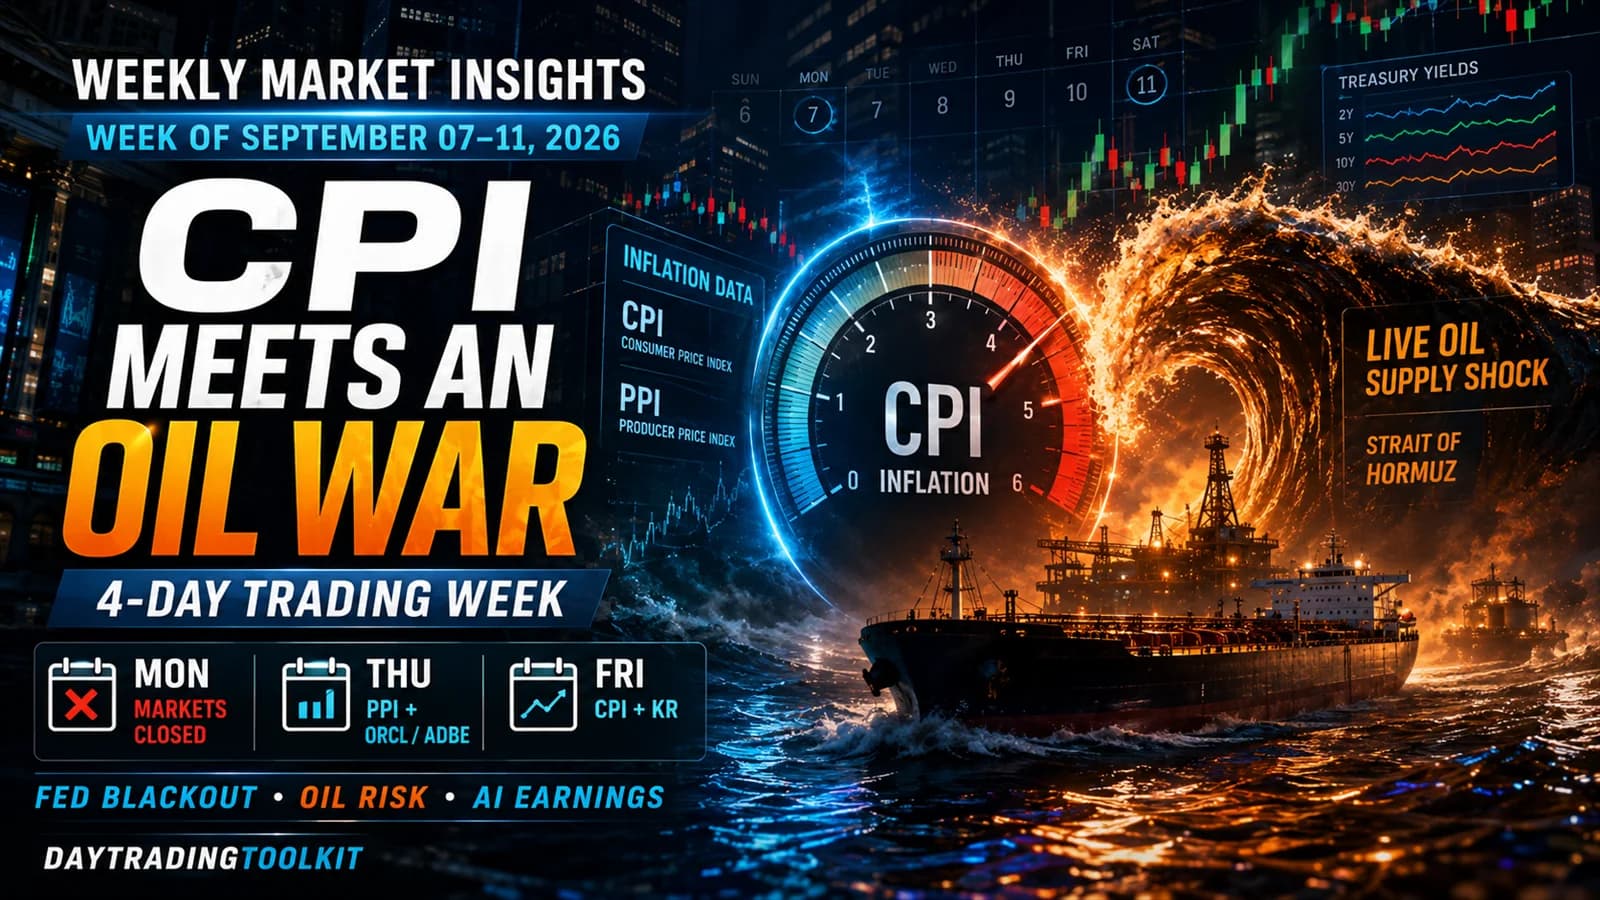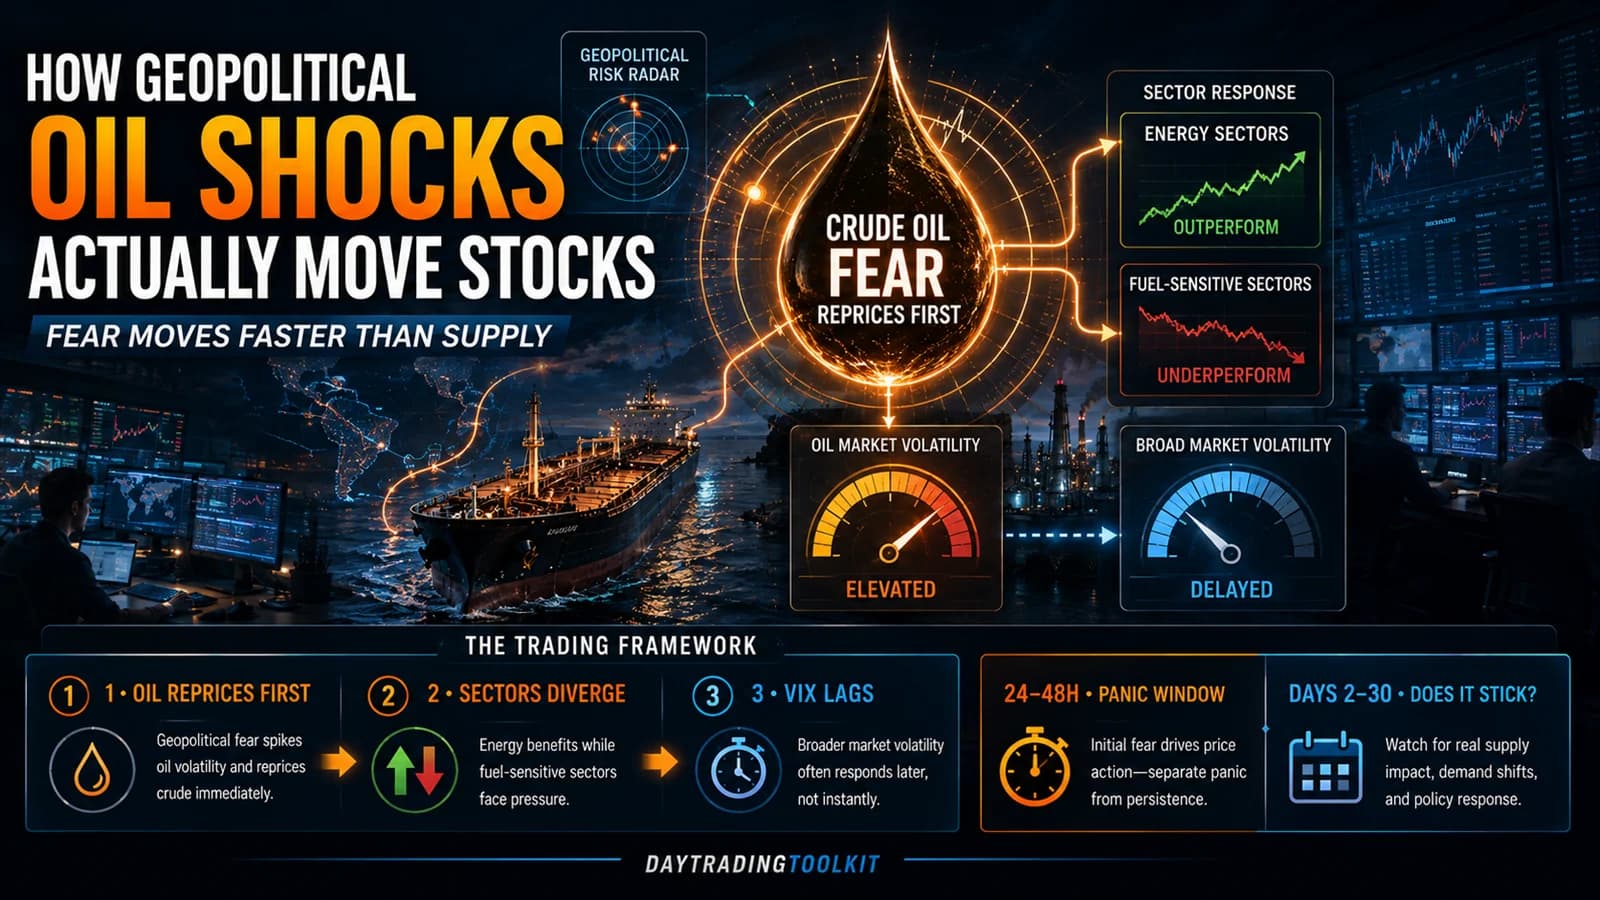
Brent crude gained nearly 8 percent in the first week of September 2026, then Iran's Revolutionary Guard reported two tankers disabled by sea mines near the Strait of Hormuz, and the price kept climbing. If you've been trying to trade around every headline in the U.S. Iran standoff this year, you already recognize the pattern. It isn't the first flare-up. Brent spiked above $110 a barrel in a March 2026 escalation, fell back to $69 by early July after a brief memorandum of understanding between Washington and Tehran, then jumped again in late July when tanker attacks resumed, touching $105. Oil rips first every time. What the rest of the market does with that fear, not the headline itself, is what actually decides whether a trade works.
What is a geopolitical oil shock? A geopolitical oil shock is a sudden jump in crude prices driven by fear of a supply disruption (war, sanctions, a blockade, an attack on infrastructure) rather than by an actual, confirmed change in how much oil is being pumped or shipped. The fear moves faster than the barrels, and the GapA gap is a price discontinuity on a chart where a stock opens significantly higher or lower than the previous session's close, leaving a visible empty space — gap-ups are driven by overnight buying pressure or positive news; gap-downs by seRead definition → between perceived risk and physical supply is what a day trader is really trading.
The Panic Trades Oil Before It Trades Anything Else
Crude oil futures are a forward-looking market built on expectations, so they reprice the instant a headline suggests supply might be at risk, long before anyone knows whether it actually will be.
The cleanest example on record is the September 14, 2019 drone and missile attack on Saudi Arabia's Abqaiq processing facility and the Khurais oil field. The strikes knocked out 5.7 million barrels a day, more than half the kingdom's output and over 5 percent of global daily production. Brent crude responded by jumping as much as 19.5 percent intraday, the largest single-day move in the contract's history, before closing the session up 14.6 percent. Saudi Aramco restored roughly a third of that lost output within two days and the bulk of it within weeks. The market had already priced in a worst case that never fully materialized, then spent the following month unwinding it as actual barrels came back online.
That's the pattern worth internalizing: the initial spike prices maximum uncertainty, not realized damage. A trader watching only the headline sees catastrophe. A trader watching the futures curve, the actual barrels confirmed offline, and how fast alternative supply routes open up sees something closer to the truth, usually days before the price does.
Where the Shock Actually Shows Up Beyond the Oil Pit
An oil spike doesn't move every stock the same direction or at the same speed, and knowing the order matters more than knowing the headline.
Energy producers move first and move the most. During the March 2026 leg of this year's Iran conflict, with Brent trading above $100 and the VIXThe CBOE Volatility Index — a real-time measure of the market's expectation for 30-day volatility in the S&P 500, derived from the prices of S&P 500 options. Widely called the "fear gauge," a rising VIX indicates increasing uncertainty and Read definition → pushing to 31, ExxonMobil and Chevron were both up more than 20 percent year to date while the S&P 500 as a whole was in the red. Higher crude prices flow almost directly into upstream producers' revenue, and the market rewards that immediately.
Fuel-cost-sensitive sectors move the opposite direction on a lag. Airlines, trucking, and other transportation names absorb higher jet fuel and diesel costs before they can pass them through to customers, so they tend to underperform during a sustained spike even if the broader index barely moves. Consumer discretionary names feel a similar SqueezeA squeeze (short squeeze) occurs when a stock that is heavily shorted rises sharply, forcing short sellers to buy back shares to cover their losing positions — the forced buying adds fuel to the upward move, creating a feedback loop that caRead definition → once higher pump prices start competing with other household spending.
The broad index sits in the middle, and this is where the sector rotation strategy becomes genuinely useful rather than academic. A shock that stays contained to energy and a handful of adjacent names is a very different trading environment than one that broadens into a full risk-off rotation across the index. Confirming which one you're in, using relative performance between XLE and the S&P 500 rather than the oil price alone, tells you more about your setup than another five minutes staring at a crude chart.
Oil's Own Fear Gauge Runs Hotter Than the VIX, and the Gap Is the Tell
Here's the part that catches traders off guard: broad equity volatility does not reliably track oil volatility, even during the same conflict.
Cboe's own market commentary on this year's conflict noted that WTI one-month Implied VolatilityImplied volatility (IV) is the market's forward-looking estimate of how much a stock will move, derived from current option prices — high IV means options are expensive because the market expects big moves, low IV means options are cheap beRead definition → surged as high as 68 percent during an active escalation, then fell by half to around 51 percent within a week as fears of a sustained supply disruption eased. That's an enormous, fast-moving number specific to the oil market. Over that same stretch in early September 2026, the VIX itself stayed anchored in the low-to-mid teens, nowhere near the levels that would signal broad equity fear.
Compare that to March 2026, when a separate flare-up in the same underlying conflict pushed the VIX to 31, decisively over the widely watched 30-point fear threshold, while SPY fell roughly 2.5 percent in a week. Same conflict, same broad category of headline, two completely different equity-volatility outcomes months apart.
The takeaway isn't that one reading is right and the other is wrong. It's that the VIX is a lagging, aggregated signal for this specific kind of shock. It only moves once the fear spreads beyond energy and inflation-sensitive corners of the market into the index as a whole. If you're trading the early hours of an oil-driven headline, oil-specific volatility (the CBOE Crude Oil ETF Volatility Index, or the implied volatility on /CL or USO options directly) is the earlier and more honest read on how scared the market actually is. The VIX tells you when the fear has broadened. It rarely tells you first.
Four Real Shocks, Compared
History gives four genuinely comparable geopolitical oil shocks tied to military conflict, and the differences between them say more than the similarities.
- Event
- 1973 Arab oil embargo
- Oil Price Move
- Prices roughly quadrupled over the following months
- S&P 500 Reaction
- Fell about 16.1 percent
- How Long It Lasted
- Over a year; fed into a deep, multi-year bear market
- Event
- 1990 Iraq invades Kuwait
- Oil Price Move
- Roughly doubled, from about $17 to $36 a barrel by October
- S&P 500 Reaction
- Fell about 15.9 percent
- How Long It Lasted
- Sharp but temporary; stocks recovered before the shooting war even started
- Event
- 2019 Abqaiq drone attack
- Oil Price Move
- Brent up 19.5 percent intraday, a record single-day move
- S&P 500 Reaction
- Broad equities barely moved
- How Long It Lasted
- Normalized within weeks as Saudi output was restored
- Event
- 2022 Russia invades Ukraine
- Oil Price Move
- Oil up roughly 10 percent
- S&P 500 Reaction
- Fell about 7.4 percent
- How Long It Lasted
- Weeks, not months
| Event | Oil Price Move | S&P 500 Reaction | How Long It Lasted |
|---|---|---|---|
| 1973 Arab oil embargo | Prices roughly quadrupled over the following months | Fell about 16.1 percent | Over a year; fed into a deep, multi-year bear market |
| 1990 Iraq invades Kuwait | Roughly doubled, from about $17 to $36 a barrel by October | Fell about 15.9 percent | Sharp but temporary; stocks recovered before the shooting war even started |
| 2019 Abqaiq drone attack | Brent up 19.5 percent intraday, a record single-day move | Broad equities barely moved | Normalized within weeks as Saudi output was restored |
| 2022 Russia invades Ukraine | Oil up roughly 10 percent | Fell about 7.4 percent | Weeks, not months |
The pattern across three of the four: a sharp initial equity DrawdownA drawdown is the peak-to-trough decline in account equity — it measures how far you've fallen from your high-water mark, either from a single losing trade or a series of losing trades.Read definition → that mostly reverses within one to three months, according to a review of historical military-conflict reactions by RBC Wealth Management. The 1990 event is the outlier, and it's the one worth studying in more detail, because it's also the shock most commentators misremember.
The 1990 Playbook Nobody Remembers Correctly
Iraq invaded Kuwait on August 2, 1990. Oil, which had been trading around $17 a barrel in July, climbed to $36 by October as traders priced in the risk that Saddam Hussein's forces might push further into Saudi Arabia and threaten a much larger share of global supply. The S&P 500 fell roughly 16 to 18 percent depending on the measurement window, one of the two deepest conflict-driven equity drawdowns of the past half century.
Here's the part that gets lost in the retelling: the actual shooting war, Operation Desert Storm, didn't begin until January 17, 1991, more than five months after the invasion. By the time it started, markets had already spent months pricing the uncertainty. Once the U.S.-led coalition demonstrated it could achieve rapid military success, the same fear that drove oil to $36 unwound just as fast. From January through March 1991, oil fell another 31 percent while the S&P 500 gained 13.6 percent. Over the rest of 1991, oil fell a further 5.1 percent and the index added another 10.6 percent.
The market didn't wait for the war to end. It moved the moment the outcome became predictable, which was weeks before the actual fighting stopped. That's the single most important lesson from 1990 for a trader working any live geopolitical oil shock: the resolution of price action and the resolution of the actual conflict are two different events, and the first one usually comes first.
It's also worth being honest about how unusual 1990 was. Across three decades of Middle East-linked conflicts, from the 1991 Gulf War itself through the 2003 Iraq invasion, the 2006 Israel-Hezbollah conflict, the 2011 Arab Spring, the 2013 Syria chemical weapons crisis, the 2019 Aramco attack, and the 2020 Soleimani strike, the 1990 shock remains the only one to produce a sustained, multi-month oil rally rather than a spike that faded within roughly two months as supply fears normalized. Every fresh escalation gets treated by financial media as a potential repeat of 1990. Historically, almost none of them are.
The Fed's Impossible Choice When Oil Spikes
A sustained oil shock puts a central bank in a genuinely bad spot, and understanding why explains a lot of the choppy, directionless price action that shows up in the days after a spike.
Higher oil prices feed directly into headline inflation through gasoline and, with a longer lag, through higher input and shipping costs across the broader economy. That argues for tighter policy. At the same time, higher energy costs act like a tax on consumers and businesses, slowing growth in exactly the way that would normally argue for looser policy. A central bank facing both problems at once has no clean move: cut rates and risk letting inflation re-accelerate, hold or hike and risk choking off growth that's already being squeezed by the same oil spike.
This is precisely the dynamic playing out in real time as of early September 2026, with a widening Iran conflict pushing oil higher just days before key inflation data and a coming Fed decision. (For the live version of this tension, this site's Weekly Market Insights tracks it catalyst by catalyst as it develops.) The mechanism itself, though, isn't tied to any single Fed chair or any single conflict. Any time an oil shock lands close to a scheduled inflation print or policy decision, expect the market's reaction to be less about the oil price itself and more about which side of the Fed's dilemma traders think will win out.
How to Actually Trade the Next One
The useful work happens by splitting the shock into two distinct trading windows rather than reacting to the headline as one continuous event.
The first 24 to 48 hours. This is when spreads widen, gaps happen, and the initial move prices maximum uncertainty rather than confirmed fact. Energy names and crude futures move first and move hardest. Chasing the initial gap without confirmation is how a lot of retail money gets caught buying the top of a fear spike that's about to fade. Checking relative volume on the specific names you're watching is a faster read on whether a move has real participation behind it than the headline alone.
The "does it stick" window, roughly days two through thirty. This is where the 1990-versus-everything-else distinction actually matters. Watch for confirmed, physical barrels going offline for an extended period (weekly EIA inventory data and verified tanker movements matter more here than price action), not just escalating rhetoric. Most geopolitical oil shocks fade within about two months once actual supply proves resilient. Treat every fresh spike as fade-first, spike-second, until there's a specific reason to think otherwise.
On the equity side, identifying the market regime you're actually in matters more here than in almost any other setup, because an oil shock that stays contained to energy trades completely differently than one that broadens into full risk-off. If volatility does broaden past the energy sector and the VIX itself starts climbing, this site's high-VIX trading strategy covers the position-sizing and risk adjustments that actually matter once you're no longer trading a contained, sector-specific move.
For the mechanical side of watching this kind of setup develop in real time, across crude futures, energy names, and the broader tape simultaneously, a scanner built for event-driven volatility is genuinely useful rather than optional. Trade Ideas can flag abnormal volume and price action across thousands of tickers the moment a headline hits, which matters more here than in a slower-moving setup, since the first hour of a real oil shock is exactly when manually refreshing a few charts stops being fast enough.
Where This Framework Breaks Down
The single biggest risk with this entire framework is treating historical base rates as a prediction for the next headline. Most Middle East-linked oil shocks fade within about two months. That is a description of what has usually happened, not a guarantee of what will happen this time, and 1990 is proof that the exception exists and can be severe when it shows up.
The second risk is confusing a real, documented correlation with a tradable edge. Academic research examining oil price shocks and stock returns across decades of extreme geopolitical events found that while oil price changes can predict equity returns during periods of genuine geopolitical unrest, a market-timing strategy built purely on oil price changes typically produces statistically insignificant abnormal returns once you account for how quickly other traders react to the same information. Understanding the mechanism helps you interpret what's happening around you. It is not, by itself, an entry signal.
The third risk is overreliance on precedent that doesn't actually fit. Russia's 2022 invasion of Ukraine produced a milder equity reaction than 1990 or 1973 largely because Russia's oil, unlike Iraq's or Saudi Arabia's, wasn't cut off from the market by sanctions on energy exports specifically. Every new conflict has its own supply geography, its own spare capacity picture, and its own set of countries willing or able to backfill lost barrels. None of that is captured by simply asking how big the last spike was.
Where This Fits a Complete Trading Plan
Nothing in this guide is a reason to build a strategy around predicting the next war. It's a framework for interpreting a setup you will encounter repeatedly over a trading career, whether the specific flashpoint is the Strait of Hormuz, the Suez Canal, a pipeline, or a region nobody is currently watching. The mechanism, price-insensitive fear buying that outruns confirmed supply loss, sector divergence between energy and fuel-cost-sensitive names, an equity volatility reaction that usually lags the oil market's own, and a central bank stuck between two bad options, repeats even when the headline doesn't.
Frequently Asked Questions
Does an oil price spike always mean stocks will fall?
Energy stocks specifically tend to rise on the same headline that pressures the broader index, since higher crude prices flow directly into producer revenue. The 2019 Abqaiq attack, despite being the largest single-day oil price move on record, barely dented broad equities because the market correctly judged the supply loss would be temporary.
Key Takeaway: Watch the divergence between energy stocks and the broader index, not just the index level, to gauge how the market is actually pricing the shock.
Why did the VIX stay low in September 2026 even as oil jumped nearly 8 percent in a week?
Cboe's own commentary on this conflict showed WTI one-month implied volatility spiking to 68 percent during an active escalation while the VIX stayed in the low-to-mid teens over the same window. The fear was real and it was priced, just concentrated in the oil market rather than spread across the broader index.
Key Takeaway: Oil-specific implied volatility often moves first and harder than the VIX during an energy-driven shock, and reading only the VIX can make you think a market is calmer than it actually is underneath.
What's the actual difference between WTI and Brent, and does it matter for how a shock trades?
Both benchmarks move together during a major shock, but the size of the move can differ meaningfully depending on whether the disruption threatens seaborne export routes specifically or affects a landlocked production region. During the 2026 Hormuz-focused escalations, Brent has generally moved as much or more than WTI on the same headlines.
Key Takeaway: When a shock is specifically about a shipping chokepoint, watch Brent's reaction at least as closely as WTI's.
How long do geopolitical oil shocks typically last before fading?
The 1990 Iraq invasion of Kuwait is the notable exception, producing a sustained, multi-month oil rally rather than a spike-and-fade pattern. Every conflict since, including the 2019 Aramco attack and the 2022 Russia invasion, has normalized faster than that.
Key Takeaway: Treat a fresh spike as likely to fade within weeks to a couple of months unless there's specific, confirmed evidence of an extended, physical supply loss.
Which sectors actually benefit and which get hurt when oil spikes on geopolitical fear?
During the March 2026 leg of this year's conflict, with Brent above $100, ExxonMobil and Chevron were both up more than 20 percent year to date while the broader S&P 500 was negative. That divergence between energy and everything fuel-sensitive is the most consistent, repeatable pattern across every shock in this framework.
Key Takeaway: A sector rotation lens, not just watching the index level, is the more useful tool for reading how a live oil shock is actually being priced.
Why did the 1990 Gulf War produce a sustained oil spike when most Middle East conflicts don't?
Once a U.S.-led coalition demonstrated it could achieve rapid military success, starting with the January 1991 launch of Desert Storm, the same fear that drove oil from $17 to $36 unwound just as quickly. Oil fell 31 percent and the S&P 500 gained 13.6 percent in the first quarter of 1991 alone.
Key Takeaway: The size of an oil shock often tracks the perceived risk to still-uninvolved supply, not just the barrels already confirmed offline.
How does an oil shock complicate the Fed's interest rate decisions?
This tension is sharpest when an oil spike lands close to a scheduled inflation report or Fed decision, since the market has to price both the shock itself and how policymakers are likely to respond to it at the same time.
Key Takeaway: When an oil shock coincides with a major Fed or inflation catalyst, expect choppier, less directional price action than the oil headline alone would suggest.
What should a day trader actually watch besides the price of crude during a live shock?
Price alone tells you the market's current fear level, but these additional signals tell you whether that fear is broadening beyond energy into the rest of the market, which is the distinction that determines whether a high-VIX playbook or a narrower, sector-specific approach fits the moment better.
Key Takeaway: Reading the shock's breadth matters as much as reading its size.
Can you actually profit by trading oil futures directly during a geopolitical spike?
The correlation between oil shocks and subsequent price behavior is real and documented, but real-time futures trading during exactly these events also carries some of the widest spreads and fastest reversals in the entire market, conditions that erode much of any theoretical edge in practice.
Key Takeaway: Understanding this mechanism is more valuable for interpreting cross-asset behavior around a shock than as a standalone entry signal on oil futures themselves.
Does this framework apply to oil shocks outside the Middle East, like Russia's invasion of Ukraine?
Russia's 2022 invasion produced a milder oil and equity reaction than 1990 or 1973 partly because sanctions didn't initially target Russian energy exports specifically, unlike the direct supply losses in Iraq and Saudi Arabia. Every new shock needs its own read on spare capacity and alternative routes rather than a copy-paste of the last one's severity.
Key Takeaway: The underlying mechanism, fear moving faster than confirmed supply loss, holds across regions, but the magnitude never transfers automatically from one conflict to the next.
Disclaimer
Article Sources
- U.S. Energy Information Administration: Short-Term Energy Outlook - primary government data on 2026 Brent price movements tied to the Strait of Hormuz conflicteia.gov
- CNBC: An oil price risk premium is back after attacks in Saudi Arabia wipe out 5% of global supply - reporting on the 2019 Abqaiq attack and the record intraday oil movecnbc.com
- Bloomberg: Stock Market Today, September 7 - reporting on the early September 2026 Strait of Hormuz escalationbloomberg.com
- RBC Wealth Management: Then and now, market reactions to military conflicts and what they mean today - historical S&P 500 reaction data across the 1973, 1990, and 2022 shocksrbcwealthmanagement.com
- ScienceDirect: Betting on war? Oil prices, stock returns, and extreme geopolitical events - peer-reviewed research on oil price predictability and market-timing returns during geopolitical unrestsciencedirect.com
- Cboe: VIX Volatility Products - primary exchange commentary on WTI implied volatility during the 2026 conflictcboe.com