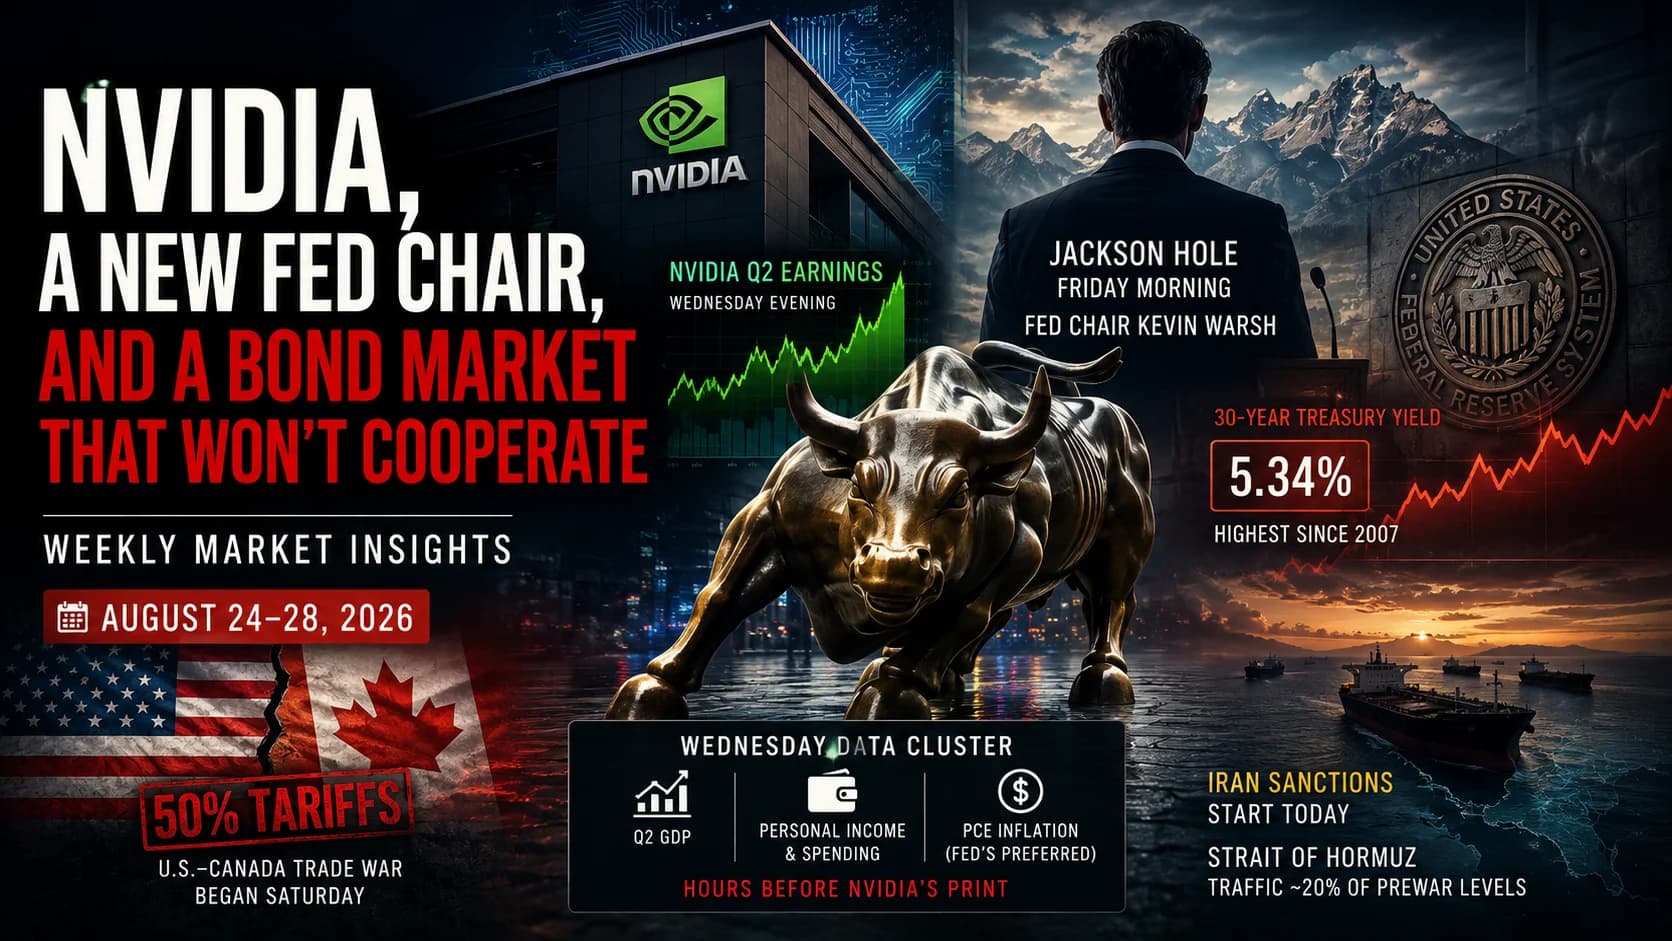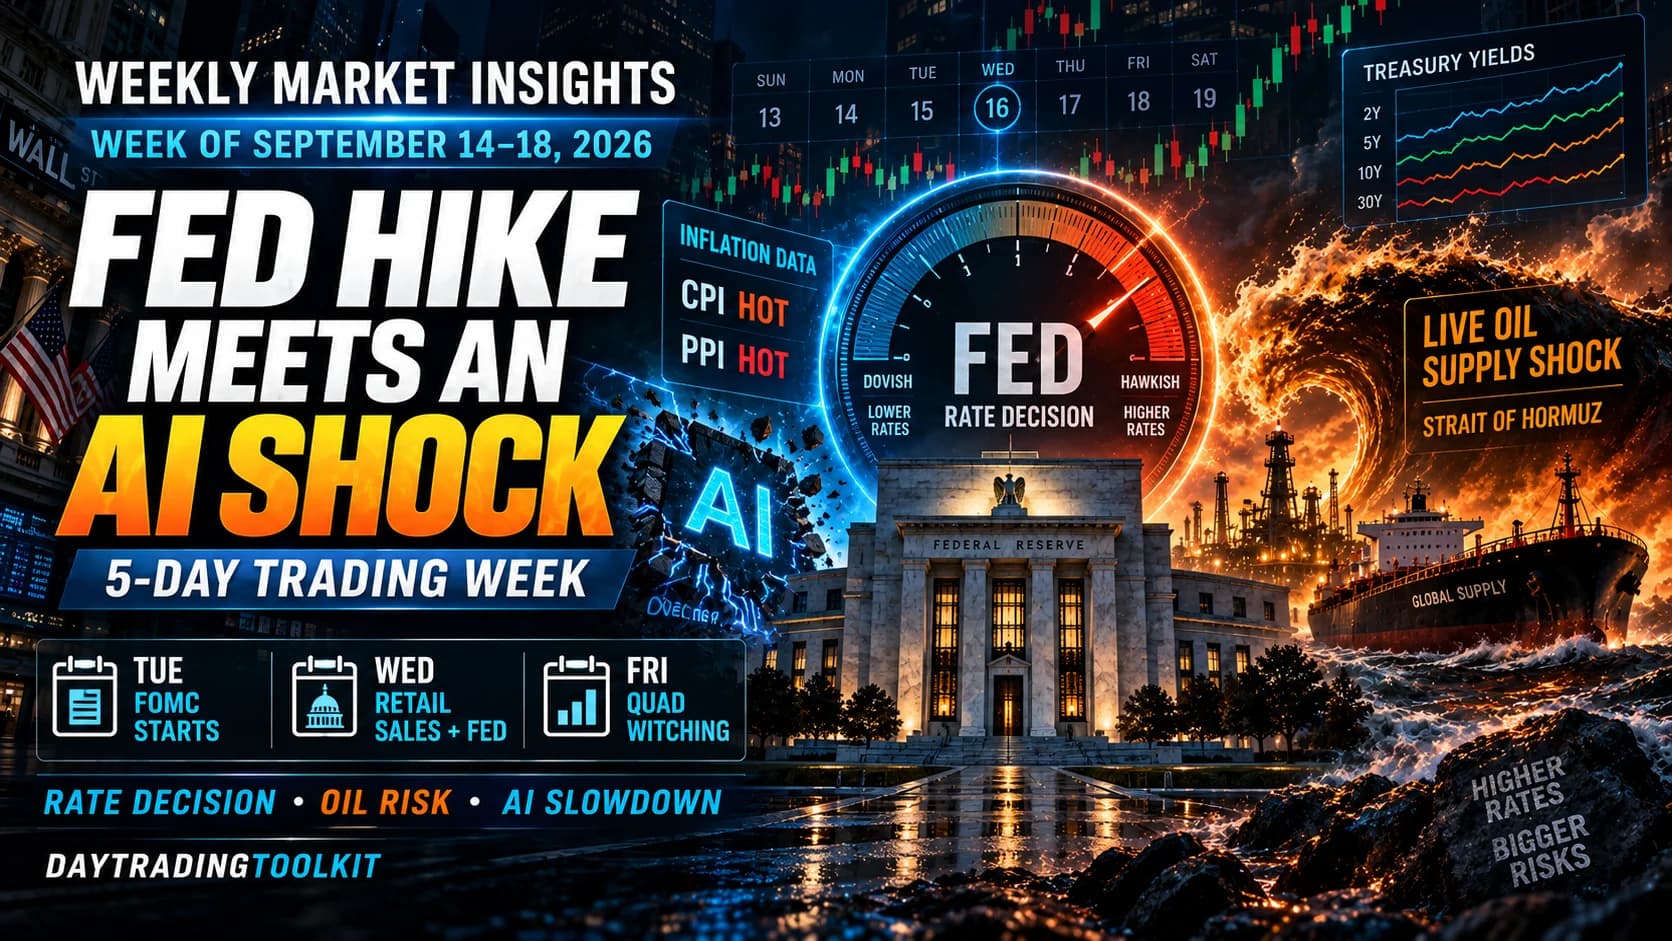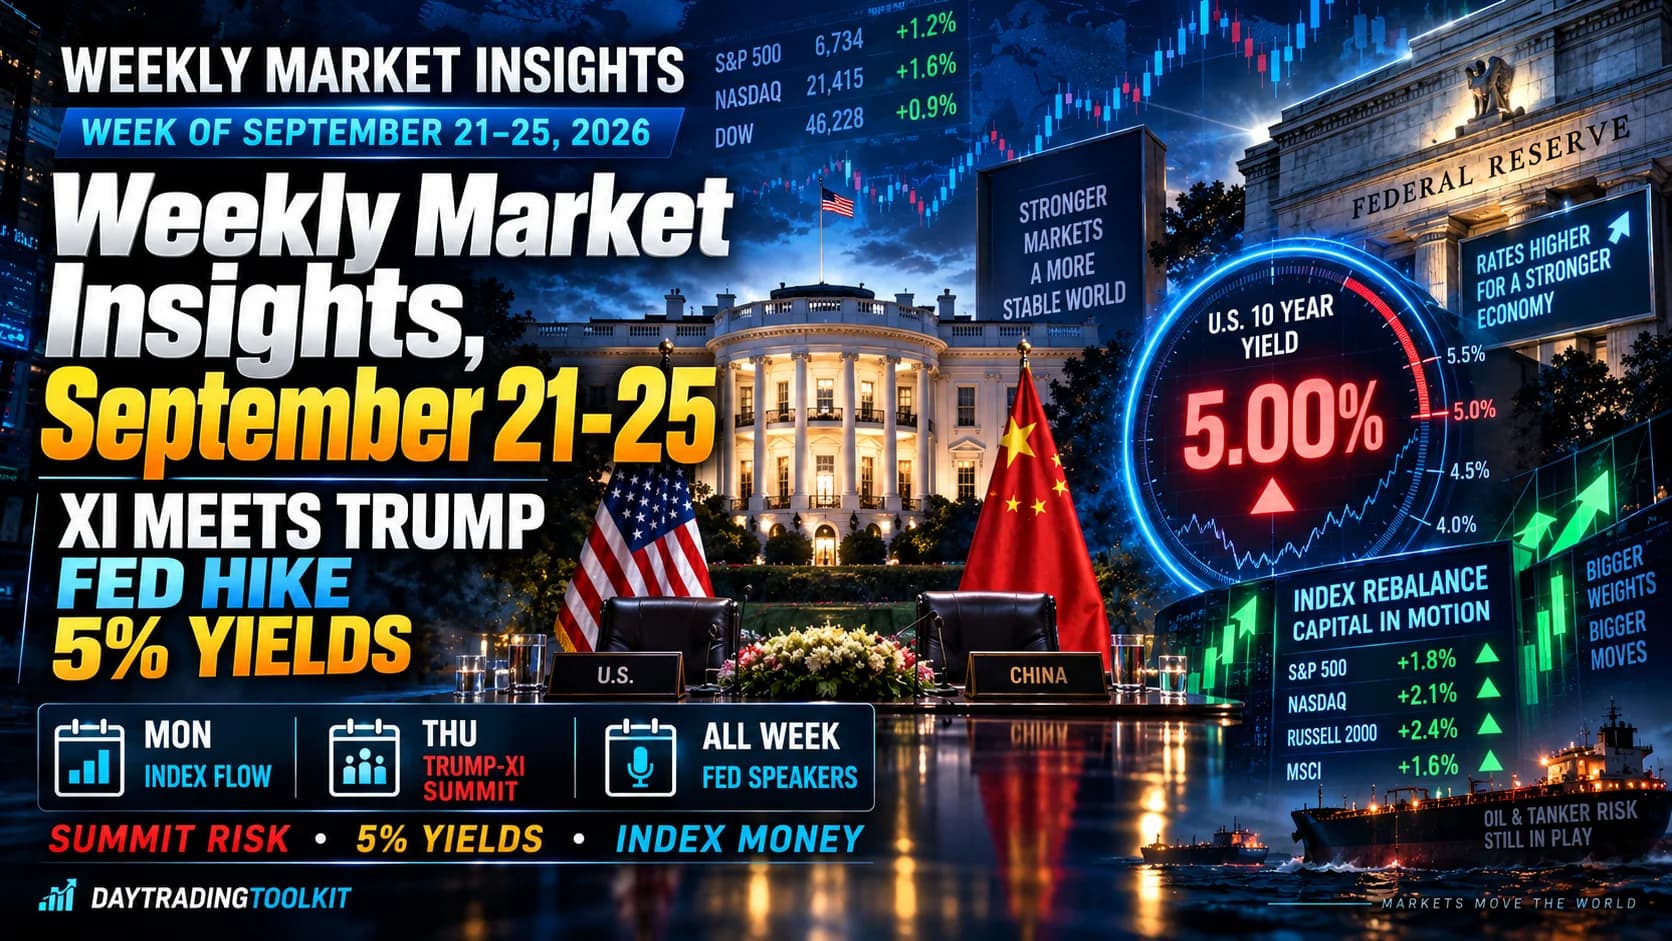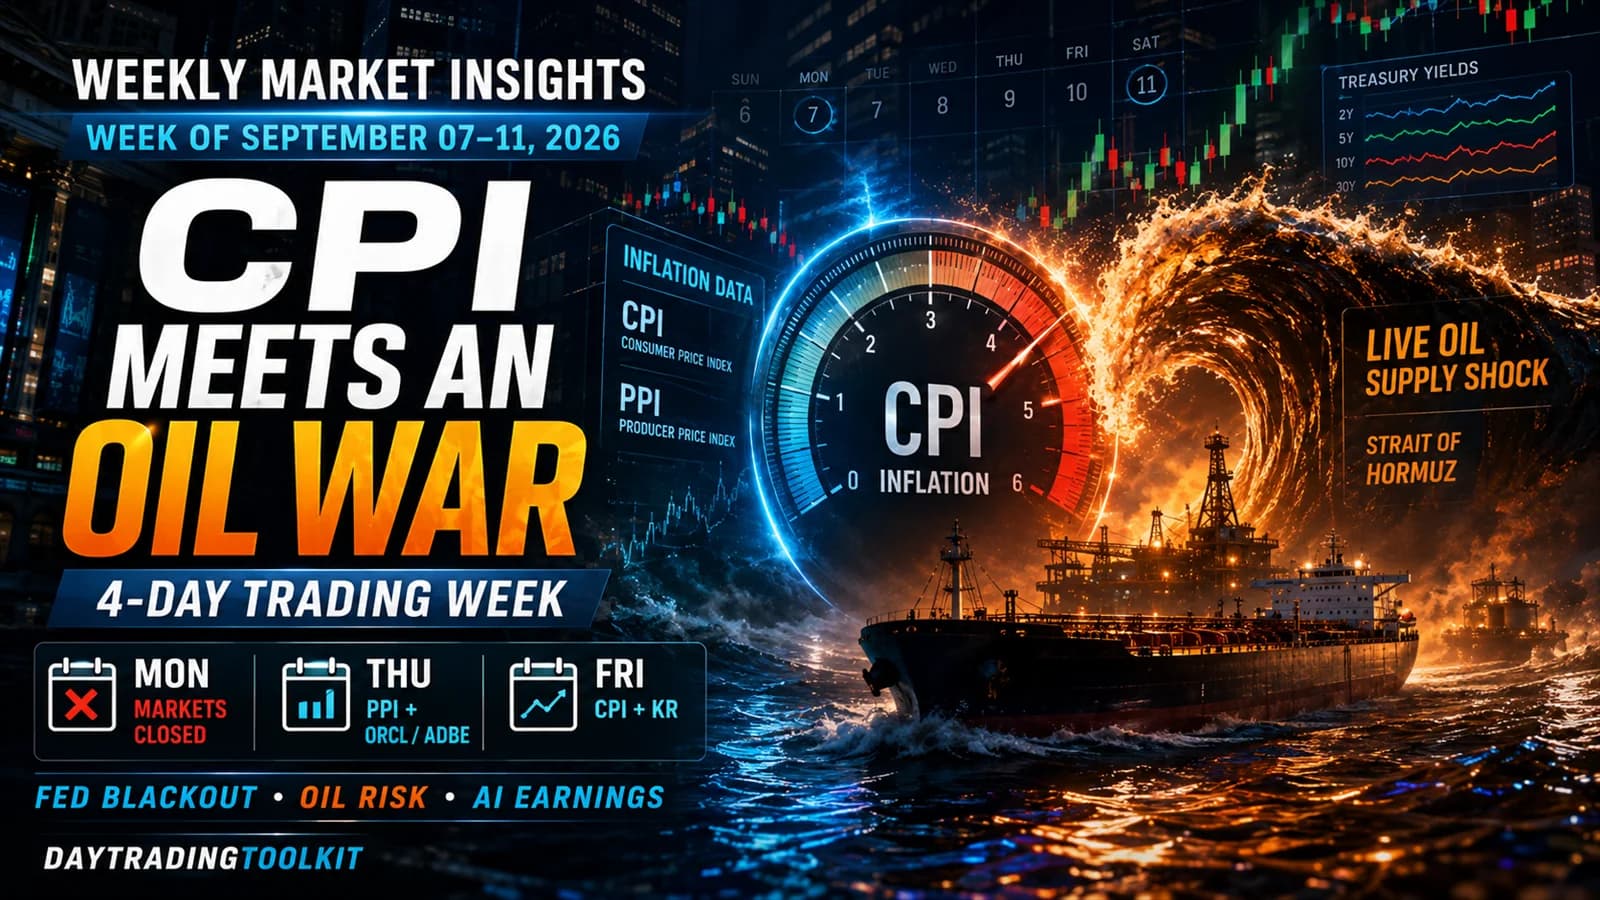
The Dow lost 628 points Tuesday, its second losing session in a row, and honestly, the headline number still undersold how much moved underneath it. Houthi forces hit Saudi energy facilities, opening a second front in an already-live war. Canada and the US escalated their trade fight into a threat to ban a major foreign planemaker outright. And Novartis's bad week got worse, dragging three other biotech names down with it on pure sympathy selling.
Google announced its largest-ever European investment. And a US chipmaker signed one of the more unusually structured AI deals you'll see this year.
All of it lands before Thursday and Friday's inflation data, which makes this the real starting point for the week ahead.
What to Know This Week
- Oil is closing in on $100 for the first time in over a month. Not just from the weekend's carrier-missile exchange and tanker strikes, but from Tuesday's Houthi attack on Saudi energy infrastructure, a second escalation layered on the first. Brent touched $99.46 intraday before settling near $98.
- A new front opened that has nothing to do with the Middle East. Canada's retaliatory tariffs on $20 billion of US goods took effect Tuesday, and Trump threatened to ban Bombardier, a Canadian planemaker, from the US market entirely. He named General Dynamics' Gulfstream unit as the domestic alternative.
- Thursday's PPI and Friday's CPIThe Consumer Price Index (CPI) is a monthly U.S. government report measuring the average change in prices paid by consumers for goods and services — it's the most closely watched inflation indicator in the market.Read definition → are the last inflation data before the Fed's September 15-16 decision. They're landing during a blackout period, so no Fed official can weigh in on either number before the meeting.
- Oracle and Adobe report Thursday evening, hours apart. It's still the clearest single test of whether the market believes AI infrastructure spending is actually paying for itself.
- A handful of individual stocks moved real money this week. Nokia ($NOK), on a Google data-center investment that never named it. Compass Pathways ($CMPS), on a launch-readiness push ahead of a first-of-its-kind FDA hearing. Qualcomm ($QCOM), on an unusually structured Amazon warrant deal. Amgen ($AMGN), on a competitor's failed drug trial rather than anything of its own.
Week at a Glance
- Day
- Mon
- Date and Time ET
- Sep 7, All day
- Event
- Labor Day, markets closed
- Why It Matters
- Trump's Bombardier threat and the Qualcomm-Amazon deal both landed on this holiday
- Day
- Tue
- Date and Time ET
- Sep 8, 12:01 AM
- Event
- Canada's $20B retaliatory tariffs take effect
- Why It Matters
- Doubles US steel and aluminum tariffs to 50%, adds duties on paper, construction materials, appliances, and agricultural goods
- Day
- Tue
- Date and Time ET
- Sep 8, Overnight
- Event
- Houthi attacks halt operations at several Saudi energy facilities
- Why It Matters
- A second, separate front in the region's energy-security story
- Day
- Tue
- Date and Time ET
- Sep 8, 9:30 PM
- Event
- China CPI (Aug)
- Why It Matters
- A global deflation-versus-demand check ahead of Thursday's ECB decision
- Day
- Wed
- Date and Time ET
- Sep 9, Before open
- Event
- Chewy earnings
- Why It Matters
- A narrower consumer-discretionary data point
- Day
- Wed
- Date and Time ET
- Sep 9, All week
- Event
- FOMC blackout period (Sep 5-17)
- Why It Matters
- No Fed official can publicly react to Thursday's or Friday's data before the meeting
- Day
- Thu
- Date and Time ET
- Sep 10, 7:45 AM
- Event
- ECB rate decision
- Why It Matters
- A global policy cross-check the same morning as US PPI
- Day
- Thu
- Date and Time ET
- Sep 10, 8:30 AM
- Event
- PPI and core PPI (Aug)
- Why It Matters
- The first of back-to-back inflation prints, and a preview of Friday's CPI
- Day
- Thu
- Date and Time ET
- Sep 10, After close
- Event
- Oracle and Adobe earnings
- Why It Matters
- Two of the year's largest AI-infrastructure and AI-monetization tests, hours apart
- Day
- Fri
- Date and Time ET
- Sep 11, 8:00 AM
- Event
- Kroger earnings call
- Why It Matters
- A grocery-margin read on consumer strain, 30 minutes before CPI
- Day
- Fri
- Date and Time ET
- Sep 11, 8:30 AM
- Event
- CPI and core CPI (Aug)
- Why It Matters
- The last inflation print before the Fed's September 15-16 decision
- Day
- Fri
- Date and Time ET
- Sep 11, 10:00 AM
- Event
- University of Michigan Consumer Sentiment (prelim)
- Why It Matters
- Includes a one-year inflation-expectations reading the Fed watches closely
| Day | Date and Time ET | Event | Why It Matters |
|---|---|---|---|
| Mon | Sep 7, All day | Labor Day, markets closed | Trump's Bombardier threat and the Qualcomm-Amazon deal both landed on this holiday |
| Tue | Sep 8, 12:01 AM | Canada's $20B retaliatory tariffs take effect | Doubles US steel and aluminum tariffs to 50%, adds duties on paper, construction materials, appliances, and agricultural goods |
| Tue | Sep 8, Overnight | Houthi attacks halt operations at several Saudi energy facilities | A second, separate front in the region's energy-security story |
| Tue | Sep 8, 9:30 PM | China CPI (Aug) | A global deflation-versus-demand check ahead of Thursday's ECB decision |
| Wed | Sep 9, Before open | Chewy earnings | A narrower consumer-discretionary data point |
| Wed | Sep 9, All week | FOMC blackout period (Sep 5-17) | No Fed official can publicly react to Thursday's or Friday's data before the meeting |
| Thu | Sep 10, 7:45 AM | ECB rate decision | A global policy cross-check the same morning as US PPI |
| Thu | Sep 10, 8:30 AM | PPI and core PPI (Aug) | The first of back-to-back inflation prints, and a preview of Friday's CPI |
| Thu | Sep 10, After close | Oracle and Adobe earnings | Two of the year's largest AI-infrastructure and AI-monetization tests, hours apart |
| Fri | Sep 11, 8:00 AM | Kroger earnings call | A grocery-margin read on consumer strain, 30 minutes before CPI |
| Fri | Sep 11, 8:30 AM | CPI and core CPI (Aug) | The last inflation print before the Fed's September 15-16 decision |
| Fri | Sep 11, 10:00 AM | University of Michigan Consumer Sentiment (prelim) | Includes a one-year inflation-expectations reading the Fed watches closely |
All Week / Unscheduled. Treat any fresh Hormuz, Iran, or Houthi-Saudi headline as its own CatalystA catalyst is the specific event or news item that triggers unusual price movement in a stock — earnings reports, FDA decisions, analyst upgrades, acquisition announcements, product launches, and short squeeze setups are all catalysts. WithRead definition → for energy, defense, and airline names, no matter what time it lands. The past 72 hours alone produced a carrier-missile exchange, three destroyed tankers, and a Saudi energy-facility attack, none of it on a calendar you could have checked in advance. The US-Canada trade dispute belongs in the same bucket. Trump's Bombardier threat has no announced timeline, and further tariff or retaliation news could show up any day.
Priority Stocks at a Glance
- Stock
- Compass Pathways ($CMPS)
- Catalyst and Timing
- Launch-readiness push this week; FDA's first public psychedelics hearing Monday, Sep 14
- Why It's Here
- A dated regulatory event most coverage isn't connecting to this week's move
- Stock
- Qualcomm ($QCOM)
- Catalyst and Timing
- Amazon AI-chip warrant deal, announced Sep 7
- Why It's Here
- The "$60B" headline needs the vesting-cap context to be accurate
- Stock
- Nokia ($NOK)
- Catalyst and Timing
- Google's 13B euro Finland AI investment
- Why It's Here
- A verifiable connection Google's own release doesn't state
- Stock
- Amgen ($AMGN) / Ionis ($IONS)
- Catalyst and Timing
- Novartis's pelacarsen trial miss, a competitor's news, not their own
- Why It's Here
- Explains a roughly 10% move with nothing wrong at the company itself
- Stock
- Biocryst ($BCRX)
- Catalyst and Timing
- Pharvaris's competing HAE trial win
- Why It's Here
- A rival's success, not failure, driving the move, and a genuinely contested read
- Stock
- Oracle ($ORCL) / Adobe ($ADBE)
- Catalyst and Timing
- Earnings Thursday after close
- Why It's Here
- The clearest AI-capex-versus-AI-monetization test of the quarter
- Stock
- Kroger ($KR)
- Catalyst and Timing
- Earnings call Friday 8:00 AM, 30 minutes before CPI
- Why It's Here
- A company-level preview of the same food-inflation question CPI answers nationally
- Stock
- ConocoPhillips ($COP) / Delta ($DAL)
- Catalyst and Timing
- Opposite sides of the same oil shock
- Why It's Here
- A clean pairing for whether the market is pricing the actual mechanism
- Stock
- General Dynamics ($GD)
- Catalyst and Timing
- Named by Trump as the domestic Bombardier alternative
- Why It's Here
- Real political exposure, though the implementation path is genuinely unclear
- Stock
- AeroVironment ($AVAV)
- Catalyst and Timing
- $465M Army laser-weapon contract, Sep 2
- Why It's Here
- A read on whether the broader defense complex trades as a real conflict beneficiary
| Stock | Catalyst and Timing | Why It's Here |
|---|---|---|
| Compass Pathways ($CMPS) | Launch-readiness push this week; FDA's first public psychedelics hearing Monday, Sep 14 | A dated regulatory event most coverage isn't connecting to this week's move |
| Qualcomm ($QCOM) | Amazon AI-chip warrant deal, announced Sep 7 | The "$60B" headline needs the vesting-cap context to be accurate |
| Nokia ($NOK) | Google's 13B euro Finland AI investment | A verifiable connection Google's own release doesn't state |
| Amgen ($AMGN) / Ionis ($IONS) | Novartis's pelacarsen trial miss, a competitor's news, not their own | Explains a roughly 10% move with nothing wrong at the company itself |
| Biocryst ($BCRX) | Pharvaris's competing HAE trial win | A rival's success, not failure, driving the move, and a genuinely contested read |
| Oracle ($ORCL) / Adobe ($ADBE) | Earnings Thursday after close | The clearest AI-capex-versus-AI-monetization test of the quarter |
| Kroger ($KR) | Earnings call Friday 8:00 AM, 30 minutes before CPI | A company-level preview of the same food-inflation question CPI answers nationally |
| ConocoPhillips ($COP) / Delta ($DAL) | Opposite sides of the same oil shock | A clean pairing for whether the market is pricing the actual mechanism |
| General Dynamics ($GD) | Named by Trump as the domestic Bombardier alternative | Real political exposure, though the implementation path is genuinely unclear |
| AeroVironment ($AVAV) | $465M Army laser-weapon contract, Sep 2 | A read on whether the broader defense complex trades as a real conflict beneficiary |
You'll find the broader radar further down. It covers names with a real reason for attention that just weren't liquid, timely, or well-evidenced enough to make this list.
Market Setup Entering the Week
Tuesday was the first full session of a holiday-shortened week, and it wasn't a gentle one. The Dow fell 628.18 points, 1.18%, to 52,786.07. That's its second losing session in a row, following Friday's 272-point decline. The S&P 500 fell 0.58% to 7,673.52, and the Nasdaq Composite dropped 0.32% to 26,421.41.
Rising Treasury yields and crude oil got the blame, and fairly so. The 10-year touched above 4.8% intraday before easing, continuing a run that already had it at 4.784% by last Friday. Energy stocks didn't share in the selloff at all: the iShares Global Energy ETF (IXC) closed at its highest level since the fund launched in November 2001.
Wednesday's premarket picture is calmer, though not clean. S&P 500 futures sat roughly flat, Nasdaq-100 futures edged modestly positive on continued chip-SectorA broad grouping of companies that operate in the same segment of the economy — such as Technology, Healthcare, Energy, or Financials. Stocks within a sector tend to move together in response to shared economic, regulatory, and sentiment faRead definition → strength, Dow futures slipped slightly, and WTI crude pushed toward $94, closing in on $100 for the first time in over a month. You're watching a market trying to digest Friday's blowout jobs report (162,000 jobs added versus roughly 53,000 expected) at the same time as an actively widening conflict and a new trade dispute. That combination left last week's index levels nearly flat even while almost everything underneath them moved hard. This week, that pattern kept going instead of resolving.
Economy, Fed, and Global Policy
Friday's August jobs report settled one question the Fed had been sitting with: is the labor market actually weakening? It came in hot, not soft, which is why rate-hike odds for the September 15-16 meeting moved from roughly 50% to about 58-60% on the CME FedWatch tool, a widely-used gauge of what traders are actually betting the Fed will do, built from fed funds futures prices. That leaves Thursday's PPI and Friday's CPI to answer a narrower, harder question. Is the current inflation picture, pushed higher by an oil shock tied to an active war, the kind of thing the Fed can reasonably look past? Or does core inflation, the reading that strips out food and energy, show price pressure broadening on its own terms?
Fed Governor Christopher Waller said last week he'd be "inclined to SupportSupport is a price level where buying pressure has historically overcome selling pressure, causing price to stop declining and reverse — it's the floor where demand enters the market, and when it holds, it's a potential long entry; when it Read definition →" holding rates steady if the data cooperates. That's a notably different posture from Chair Kevin Warsh's Jackson Hole insistence that the Fed needs proof underlying inflation is actually cooling. The July meeting itself produced a 9-3 vote, with three dissents favoring a hike over the majority's hold, so this isn't a committee reading the data the same way to begin with.
This week's numbers land in the middle of that disagreement, and no Fed official can weigh in before the meeting. The blackout period runs from September 5 through September 17.
The Cleveland Fed's Inflation Nowcast, as of September 4, put its estimate for August at 3.38% year over year on headline CPI and a milder 2.38% on core, compared with July's actual 3.4% headline and 2.5% core. That's a "hotter headline, calmer core" shape, and if it holds, it's exactly the pattern that would support the Fed looking through the oil shock rather than reacting to it.
The trade war is part of this same policy picture now, not a separate story sitting off to the side. Trump's Truth Social post Monday, "NO MORE SELLING BOMBARDIER IN THE UNITED STATES! Their products aren't good enough!", threatened to ban the Canadian planemaker from the US market unless it manufactures domestically. He specifically named General Dynamics' ($GD) Gulfstream unit as the kind of company that should benefit instead.
Canada's $20 billion in retaliatory tariffs took effect at 12:01 AM Tuesday. US steel and aluminum tariffs into Canada doubled to 50%, matching the US's own rate on Canadian metal, and fresh duties landed on paper products, construction materials, home appliances, and agricultural goods. This follows the US's own 50% tariffs from July on $27.6 billion of Canadian goods, including wine, dairy, cement, and furniture, after trade talks collapsed on August 21.
Auto tariffs currently sit at 25%, and an earlier preliminary framework that would have brought that down to 15% (with a possible path to 7%) is now in question along with everything else. None of this has an announced resolution timeline. It's unfolding roughly two months before the US midterms, which adds a political dimension that could speed things up or stall them out without much warning.
Stocks to Watch
$AMGN / $IONS: Novartis's failed trial, and the read-through that followed
Read-through is what happens when the market prices one company's stock off a different company's news, on the assumption that a similar drug or business will succeed or fail the same way. Novartis's pelacarsen, an Lp(a)-lowering drug developed with Ionis Pharmaceuticals ($IONS), missed the primary endpoint of its Phase 3 outcomes trial. Here's the distinction that matters: it successfully lowered the target biomarker, Lp(a) itself, but that didn't translate into fewer actual heart attacks, strokes, or cardiovascular deaths compared with placebo, in a trial of more than 8,300 patients.
BMO Capital Markets downgraded Amgen ($AMGN) the same day, and Amgen's own drug didn't fail. Amgen has a similar-mechanism Lp(a) drug, olpasiran, that hasn't even read out yet. The market priced in a failure that hasn't happened, purely because the mechanism looks similar.
Separately, Novartis disclosed a second trial miss the same week. Tuesday's market commentary tied that second miss to further pressure on Dyne Therapeutics ($DYN) and Sarepta Therapeutics ($SRPT), on the same read-through logic. That second claim comes from a single source and wasn't independently confirmed for this edition, so treat it as a lead worth watching rather than a settled fact.
Ionis takes the most direct hit of the group. Under its 2019 licensing deal, it stood to earn tiered royalties in the mid-teens to low-20% RangeA range (or trading range) is a price zone where a stock oscillates between a defined support floor and resistance ceiling without making meaningful new highs or lows — price is consolidating rather than trending, and the dominant trade is Read definition → plus $650 million in milestones once pelacarsen reached approval. Most of that is gone now.
$NOK: a Google announcement that never mentions Nokia
Google announced a 13 billion euro investment in Finnish AI infrastructure this week, its largest-ever European investment, including new data centers and an expansion of its existing site in Hamina. You won't find Nokia ($NOK) named anywhere in Google's own release. It's been a supplier on that Hamina buildout since 2023, alongside the Finnish telecoms DNA and Elisa, and it separately launched its own AI network-operations platform on Google Cloud this month. Nokia traded up close to 5% on the news.
$QCOM: the "$60 billion Amazon deal," and what the number actually means
Qualcomm ($QCOM) and Amazon Web Services announced a multi-generational AI infrastructure partnership on September 7, and Qualcomm shares rose more than 7% within a day, then kept climbing as the week went on. The mechanism behind it is unusual, so it's worth slowing down on.
Amazon received a warrant for up to 25 million Qualcomm shares at $161.26 each. Only 3.75 million of those vested immediately. The rest vest in tranches, tied to Amazon actually placing orders, up to a maximum of $60 billion through 2036. That $60 billion is a ceiling for the warrant to fully vest, not revenue Qualcomm has already booked, and that's a distinction most of the week's coverage skipped entirely.
One more thing worth noticing: Amazon's own stock barely moved on the news. That's informative on its own. The market is pricing this as a Qualcomm story, not an Amazon one.
$CMPS: ahead of a hearing that doesn't happen most weeks
Compass Pathways ($CMPS) closed up 5% Tuesday on a specific, dated cluster of events, not a vague mood. There's a new US doctor-education campaign for its psilocybin therapy, COMP360. Management is presenting at two Cantor healthcare-conference sessions this week. And the real anchor: the FDA is holding its first-ever public hearing on the therapeutic use of psychedelic drugs in supervised settings, scheduled for Monday, September 14.
Compass's rolling NDA submission is on track to complete in the fourth quarter of 2026, helped along by a Commissioner's National Priority Voucher that shortens the review window. Final approval would still need the DEA to reschedule psilocybin off Schedule I, so this isn't a done deal by any stretch. Separately, a chunk of the ticker's social chatter this week recycled Eli Lilly's July acquisition of a different, earlier-stage competitor as though it were new, and speculated Compass could be next. That specific claim has no confirmed backing. It's retail speculation, not a signal, and worth knowing the difference.
$BCRX: hurt by a rival's good news
Pharvaris announced a late-stage trial win for its own oral hereditary-angioedema drug, cutting monthly attacks 83% against placebo. Biocryst ($BCRX) already sells an approved, revenue-generating drug for the same disease, so the market read Pharvaris's success as a direct competitive threat rather than background noise. Biocryst posted its worst day in over six months on it. Not everyone agreed that was the right read: TD Cowen initiated Biocryst at Buy with a $30 price target, roughly triple where it was trading, the same day.
Earnings and Company Events
Oracle ($ORCL) reports fiscal first-quarter results Thursday after the close, with Adobe ($ADBE) following hours later. It's still the clearest read available on which side of the AI trade the market currently trusts. Oracle carries a reported $638 billion in remaining performance obligations, future revenue it already has under contract but hasn't recognized yet, and has guided to 58-64% cloud revenue growth for the quarter. Consensus sits around $19.1 billion in revenue and $1.74 in non-GAAP earnings per share, and the options market is pricing a roughly 10% move on the report, in either direction. The stock is down more than 20% from its highs this year on a fair question: does that backlog convert to cash flow fast enough to justify the debt-funded spending behind it?
Adobe has recovered about 22% since its last report, when a beat-and-raise quarter still sold off because management held annual recurring revenue guidance flat despite an AI-first pricing pivot. Thursday is the market's chance to see whether that pivot is finally showing up in the numbers instead of just the narrative. For more on how the AI-capex debate has been building all year, this guide's July breakdown of the AI infrastructure spending question is still the fuller reference.
Kroger's ($KR) second-quarter call Friday at 8:00 AM lands 30 minutes before CPI, and that timing isn't a coincidence worth ignoring. Tyson Foods flagged worsening beef-margin pressure from a cattle shortage on September 3, and Kroger's own margins have already absorbed a version of that same input-cost squeeze. How much of that Kroger says it can pass through to shoppers, versus how much it has to eat itself, is a company-level answer to the same question CPI's food-at-home component measures nationally, half an hour later.
Sectors, Commodities, and Ongoing Developments
Oil and the widening conflict. WTI is trading near $94 and Brent near $98, both closing in on $100 for the first time in over a month, after Brent touched $99.46 intraday Tuesday. The weekend's US strikes on three Iranian oil tankers, a response to Iranian missiles fired at a US carrier and destroyer, were compounded Tuesday by a genuinely different escalation.
Saudi Arabia said Houthi attacks halted operations at several of its energy facilities. That's a second front, not a continuation of the first. Saudi energy infrastructure, not just Iranian shipping, is now a live target.
Goldman Sachs raised its oil forecasts this week: Brent and WTI to $85 and $80 for December 2026, and $80 and $75 for 2027. The bank's bear case, not its base case, has Brent above $120 in 2027 if Gulf output stays roughly 4 million barrels a day below prewar levels. Worth knowing that range exists even if it isn't the expected outcome.
Separately, reports that Iran and Oman are close to a deal on a "temporary safe route" through the Strait of Hormuz have been circulating. But Trump told Axios over the weekend the US is "only semi-negotiating" and plans to keep leaning on its naval blockade rather than pursue further strikes, while Iran's Foreign Ministry says it won't fully reopen the strait until that blockade lifts. Those are two very different versions of the same situation, which means any oil-price relief tied to that reported deal might be pricing in an agreement that doesn't actually resolve anything yet.
The trade war's stock-level exposure. Beyond the policy question above, Trump's specific naming of Gulfstream as the domestic alternative to Bombardier puts General Dynamics ($GD) in a real, if genuinely uncertain, position. Uncertain because the FAA, not the White House, actually certifies aircraft, and it's unclear how a unilateral sales ban would even get implemented. Bombardier itself pushed back by noting it has 3,500 US employees, 2,800 US suppliers across 47 states, and more than $2.5 billion in annual US spending, which complicates any clean "domestic winner" story even if the threat gets followed through on.
Gold versus the 2-year yield. Gold fell to around $4,420 an ounce last week, down roughly 2.4%, as the stronger dollar and higher real yields that come with rising hike odds pressured the metal even with an active war underway. That's a good reminder that gold trades on rate expectations as much as safe-haven demand, maybe more so lately. If Friday's CPI reinforces the hike case, gold likely keeps falling as the 2-year yield (last at 4.377%, its highest since January 2025) pushes higher. If core cools and the Fed's look-through argument gains ground instead, gold has room to reverse.
Market Structure and Special Situations
Next week stacks the FOMC decision (September 15-16), quadruple witching, and the Nasdaq-100/S&P 500 quarterly rebalance into the same five-day span. However this week's PPI, CPI, and earnings resolve becomes the direct setup for that stretch, and there's not much time to digest between the two weeks.
Broader Weekly Radar
iShares Russell 2000 ETF ($IWM). Small-cap balance sheets carry more variable-rate debt than the S&P 500's largest names, and less pricing power to offset it. That makes the Russell the most amplified reader of whatever this week's inflation data does to rate expectations. It already diverged from the other major indexes Friday, rising 0.25% while they fell. Worth watching whether that repeats once real inflation data, not a jobs report, is the thing driving the reaction.
Dyne Therapeutics ($DYN) and Sarepta Therapeutics ($SRPT). Named in Tuesday market commentary as further pressured by Novartis's disclosed second trial miss, on the same read-through logic hitting Amgen. It sits here in the radar rather than the priority list because the underlying claim wasn't independently confirmed for this edition.
Also worth knowing about: the ECB's Thursday decision, a global policy cross-check landing the same morning as US PPI; China's Tuesday-night CPI, a global demand read; and Chewy's Wednesday earnings, a narrower consumer-discretionary data point.
What Could Change the Week
- Inflation confirms the hike case. PPI and CPI both come in at or above the Cleveland Fed's nowcast, core included. Watch for the 2-year yield pushing through 4.4%, hike odds moving above 65-70%, and gold extending its slide.
- Core cools even as headline gets pushed up by oil. Headline ticks higher on energy pass-through, but core holds in the 0.1-0.2% range. Watch for futures pulling hike odds back down despite the higher headline, and gold stabilizing.
- A third geopolitical front opens. A confirmed casualty event, a Hormuz shipping disruption, or another Houthi-Saudi exchange would push oil and, unusually, gold higher together. That combination is a genuine risk-off signal, not just a rate story.
- The trade war produces an actual policy action. A confirmed Bombardier sales restriction, a further Canadian countermeasure, or a walk-back from either side would all be tradeable on their own, independent of whatever CPI shows that same day.
- The AI-capex trade holds through Oracle and Adobe regardless of the macro data, with semiconductor and software names moving on the earnings themselves rather than Friday's inflation print.
Trader Preparation
- Treat Thursday's PPI as a genuine preview of Friday's CPI, not a standalone release. A surprise in either direction is worth reacting to before Friday's number, not after.
- Check the options-implied move on Oracle and Adobe before you size anything into Thursday's close. Both names have swung hard on recent reports.
- Treat any fresh Hormuz, Iran, or Houthi-Saudi headline as its own catalyst for energy, defense, and airline names all week. There's no fixed release time attached to any of it, and the past 72 hours alone brought two separate escalations.
- Do the same for the US-Canada trade dispute. No announced timeline exists for Trump's Bombardier threat or Canada's next move, and either could land without warning.
- Widen your stops or reduce size heading into Friday's 8:30 AM CPI specifically. With the FOMC blackout in effect, no Fed voice can walk back an extreme reaction before the September 15-16 meeting.
- For single-stock stories like Compass, Qualcomm, Nokia, Amgen, and Biocryst, verify the specific mechanism (a named supplier relationship, a warrant's vesting terms, a competitor's trial data) before you trade the headline version. In every one of these cases this week, the headline and the actual mechanism were meaningfully different.
FAQs
Is the Houthi attack on Saudi Arabia part of the same conflict as the US-Iran exchange?
Key Takeaway: Treat the two as separate, simultaneously live risks rather than one story. A resolution on one front wouldn't necessarily resolve the other. This guide's playbook on trading geopolitical events covers the full risk-off framework for gold, oil, and defense stocks in more detail.
What would actually make the US-Canada trade dispute a bigger market story than it is right now?
Key Takeaway: Watch for an implementation step, not just another social media post or tariff announcement, before you treat this as a bigger cross-market catalyst.
If Trump named Gulfstream as the Bombardier alternative, why isn't General Dynamics a more confident pick?
A president can express a preference and apply political pressure, but implementing an actual market restriction on a foreign manufacturer runs through a regulatory process the White House doesn't directly control. Until that process produces something concrete, this is a real but unresolved exposure, not a confirmed one.
Key Takeaway: Watch for an actual FAA action, not just further statements, before treating this as a settled trade for General Dynamics.
Why did Amgen and Biocryst both move on other companies' news instead of their own?
Key Takeaway: A read-through move isn't evidence about the company it's happening to. It's a bet on a mechanism, and that bet can go wrong in either direction once the company's own results actually show up.
Why does Qualcomm's "$60 billion" Amazon number need a caveat?
Key Takeaway: Only 3.75 million of the warrant's 25 million shares vested immediately. The rest depends on Amazon actually placing the orders.
Does the FDA's September 14 hearing mean Compass Pathways is close to approval?
Two different federal processes have to move for Compass to actually launch: an FDA approval and a DEA rescheduling. The hearing is relevant context for the first. It doesn't resolve the second.
Key Takeaway: Treat the hearing as a sentiment catalyst, not a confirmation that every regulatory hurdle here is cleared.
Why watch PPI and CPI as closely as the war and trade headlines this week?
Key Takeaway: Size around Thursday's PPI reaction as a live preview of Friday's CPI, not as a separate, lower-stakes release.
Why does a "hotter headline, calmer core" inflation shape matter more than the overall number?
Both numbers get released Friday, but they can tell very different stories. A hot headline driven by gasoline prices is the kind of thing a war can explain away. A hot core reading means price pressure is broader than the war, and that's a much harder case for the Fed to look past.
Key Takeaway: Watch core CPI specifically on Friday, not just the topline number the headlines will lead with.
What would it mean if gold and oil started rising together instead of moving in opposite directions?
Right now gold is reacting mostly to the dollar and real yields, both being pushed higher by hike odds. If a new shock made investors want safety regardless of what it does to rates, gold would decouple from that yield relationship and rise alongside oil instead.
Key Takeaway: A joint move in gold and oil is a bigger warning sign than either one moving alone.
Disclaimer
Article Sources
- U.S. Bureau of Labor Statistics, 2026 release schedule - confirms the September 10-11 PPI/CPI datesbls.gov
- Federal Reserve Bank of Cleveland, Inflation Nowcasting - source of the September 4 CPI estimateclevelandfed.org
- Yahoo Finance, stock market today, September 8 - confirms Tuesday's close and the Houthi attack on Saudi energy facilitiesfinance.yahoo.com
- Charles Schwab, Short Week Packs a Punch - confirms Wednesday's premarket conditions and the jobs-report setupschwab.com
- The Washington Post, Trump threatens to ban Bombardier jet sales - confirms Canada's retaliatory tariffs and Trump's Bombardier threatwashingtonpost.com
- CNBC, Bombardier points out its US footprint - confirms Bombardier's US employee and supplier figurescnbc.com
- Investing.com, Goldman ups oil price forecasts - confirms Goldman's revised Brent and WTI forecastsinvesting.com
- Novartis, Lp(a)HORIZON Phase III topline results - confirms the pelacarsen primary-endpoint missnovartis.com
- Qualcomm, Form 8-K via SEC EDGAR - confirms the Amazon warrant structure and vesting termssec.gov
- FDA, public hearing notice - confirms the September 14 hearing datefda.gov