
Calm Markets, Cracking Consumer: Weekly Market Insights, August 17-21

In this article11 sections
The S&P 500 set a record Thursday. The VIX sits near its lowest level of the year. By almost every measure that describes a stock market, this looks like a market with nothing to worry about.
Almost nothing else in the data agrees with that picture. Nonfarm payrolls fell in July. The unemployment rate only dropped because fewer people are working or looking for work. Consumer sentiment just posted its steepest one-month decline in over a year. The Federal Reserve's own committee split 9-3 at its last meeting, the most divided vote since 2016, with three regional presidents wanting to raise rates while the broader economy shows real cracks. And crude oil just posted its best week in months as the U.S. threatens an indefinite naval blockade of Iran.
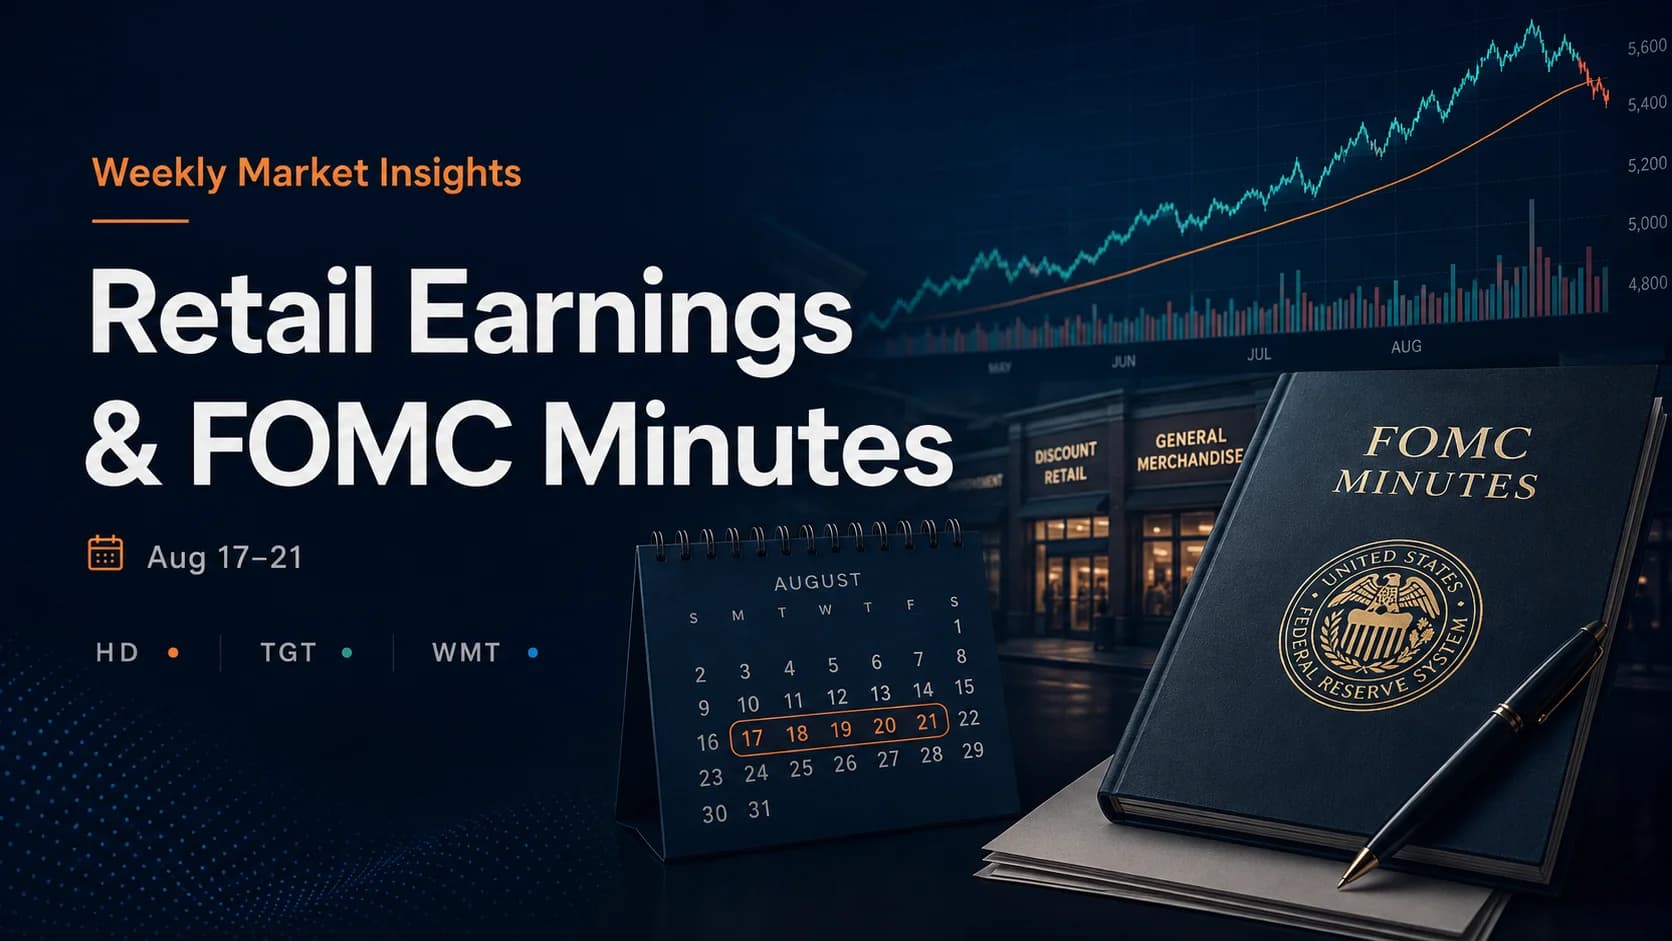
None of that has shown up in the index level yet. This week is where several of those threads get tested at once: five major retailers report earnings that will show whether the weak July consumer data was real or a timing quirk, Wednesday's FOMC minutes give the first documented look inside a committee that's more divided than it's been in a decade, and an active, unscheduled geopolitical risk in the Strait of Hormuz sits over all of it, capable of overriding every other headline on short notice.
This is a preparation guide for that setup, not a set of trade calls or price predictions.
Key Takeaways
- The S&P 500, Nasdaq, and Russell 2000 all extended weekly winning streaks, but Friday's pullback came alongside the weakest consumer sentiment reading in over a year, a genuine crack beneath a calm-looking tape.
- The Fed's July vote was 9-3, the most divided since 2016, with three regional presidents wanting to hike rates into a labor market that's already showing cracks. Wednesday's minutes are the first documented look at how deep that split runs.
- July retail sales fell 0.6%, but the underlying control group (which strips out autos, gas, and building materials) also fell 0.4%, meaning the miss cannot be fully explained by Amazon's Prime Day moving from July to June.
- Five major retailers report within a 72-hour window (Home Depot, Target, TJX, Walmart, Ross Stores), giving the clearest read yet on whether the consumer is slowing or simply trading down to value.
- Oil is up more than 5% on the week after the U.S. threatened an indefinite naval blockade of Iran and Treasury Secretary Bessent promised new "economic isolation" measures expected this week, an unscheduled risk that could override every other catalyst on this calendar.
- Longer-dated Treasury yields remain elevated on fiscal-borrowing concerns even as short-term rate-hike fears ease, a tension worth watching alongside the Fed minutes.
Last Week's Setup
The S&P 500 closed at a record 7,798.99 Thursday, up 0.65% after a softer-than-expected July PPI report eased Fed hike fears, capping a third straight weekly gain (roughly +0.4%). The record didn't hold: Friday brought a 0.17% pullback to 7,785.76 once the retail sales and sentiment misses landed. The Nasdaq followed a similar arc, up roughly 0.1% on the week. The Dow broke from the pattern, falling 0.6% and snapping a two-week winning streak on weakness in healthcare and select industrials.
The Russell 2000 told the most interesting story: it set back-to-back record closes Thursday (3,052.85) and Friday (3,068.42), up roughly 1% on the week even as large caps pulled back. That's worth watching rather than treating as confirmed rotation, but it shows the "market" isn't moving as one trade even inside a calm tape.
That calm is real by one measure and misleading by others. The VIX closed Friday at 14.25, near its year low. But the 10-year Treasury tested a 19-month high of 4.75% Tuesday before easing to 4.68%, and the 30-year touched a 19-year high near 5.21% on fiscal-borrowing concerns; the 2-year finished at 4.17%. Equities are pricing calm; the long end of the bond market is pricing unease about who buys all the debt the government needs to issue.
July CPI came in benign (headline +0.1% m/m, +3.4% y/y; core +0.2% m/m, +2.5% y/y), and PPI was flatter still (0.0% m/m, +4.7% y/y, down from 5.5%), both feeding the read that the Fed doesn't need to hike in September. Friday's retail sales report cut against that: sales fell 0.6% to $763.6 billion, the sharpest drop in over a year versus a +0.1% consensus call. Preliminary UMich sentiment fell to 51.0 from 55.2, an 8% one-month drop, with one-year inflation expectations rising to 4.3%. The two reports didn't land simultaneously: retail sales at 8:30 AM ET, sentiment at 10:00 AM ET.
Crude oil was the week's other major mover. WTI closed Friday at $82.40 (+1.4% on the day) and Brent at $88.52 (+1.7%), both up more than 5% for the week, driven almost entirely by an escalating standoff over the Strait of Hormuz. More on that below, since it's arguably the single largest unscheduled risk hanging over the coming week.
The Central Question: Is the Consumer Slowing, or Trading Down?
Friday's retail sales miss would normally do real damage to a market at records. That it didn't suggests traders are giving Amazon's Prime Day shift from July to June the benefit of the doubt: nonstore sales fell 2.2%, the largest drag on the headline number, and moving that spending into June's base makes July look artificially weak.
That explanation is real but incomplete. The control group, which strips out autos, gasoline, and building materials for a cleaner demand read, also fell 0.4%; a pure timing story wouldn't necessarily show up there. Restaurant spending actually increased in July per LPL Financial's chief economist, and private card-transaction data (CNBC/NRF Retail Monitor) showed continued gains through the same period, a real contradiction worth holding alongside the weak official print.
This week's earnings cluster is built to resolve that tension. Three realistic outcomes are worth having in mind before the reports land.
Scenario A: July weakness was exaggerated. Home Depot and Lowe's guidance holds stable, Target's traffic stabilizes, Walmart's comps stay healthy, and TJX and Ross Stores retain their momentum. Put those four together and the more plausible read is that July's decline was mostly a timing and category distortion, not a genuine drop in demand.
Scenario B: consumers are trading down, not pulling back. Target keeps showing softness while TJX, Ross Stores, and Walmart all stay strong, and Walmart's commentary confirms higher-income customers keep arriving. Total spending stays intact here; price sensitivity is what's rising. Of the three scenarios, this might be the most interesting, since it wouldn't show up as an economic contraction at all, and it would still reshape which retailers win the next two quarters.
Scenario C: genuine consumer deterioration. Home Depot and Lowe's turn cautious, Target's traffic weakens further, and even the trade-down names lose momentum, while jobless claims and PMIs soften in the same window. At that point July's retail miss stops looking like noise. It starts looking like the first hard, earnings-based confirmation of the consumer fatigue that's been building in survey data for months.
The Retail Dashboard: Reading Five Reports as One Signal
Treating each retailer as an isolated earnings event misses the point of this particular week. The five reports split naturally into three groups, and the value is in reading them together.
Housing (Home Depot, Toll Brothers, Lowe's): HD reports Tuesday before the open, TOL after Tuesday's close, LOW Wednesday before the open, landing alongside Monday's NAHB index and Tuesday's housing starts/pending home sales. Together they cover renovation spending (HD, LOW) and new-home contracts (TOL) under a 30-year mortgage rate that's climbed from 6.37% in early May to 6.66% by late July. HD's own Q1 was soft (comps up just 0.6%), so this cluster is less about beating estimates and more about whether the housing-demand deterioration visible in the data shows up in guidance too.
General merchandise and off-price (Target, TJX, Ross Stores): TGT reports Wednesday before the open, TJX the same morning, ROST Thursday after close. TGT represents full-price retail and has struggled with traffic; TJX and ROST are off-price chains that historically gain share when shoppers trade down. TGT sounding cautious while TJX and ROST both post strong comps the same week is a cleaner value-migration signal than any single name alone.
The broad consumer test (Walmart): WMT reports Thursday before the open and is the closest thing this cluster has to a single verdict on the American consumer, given its scale and grocery mix. Watch whether management confirms higher-income shoppers keep trading down, a trend it has flagged before; if that's accelerating alongside a weak TGT, the consumer-slowdown thesis gets its strongest data point of the week.
Consensus estimates for all five names were still being finalized as of Friday's close and can shift meaningfully over the weekend; check current figures immediately before the open rather than trusting a stale number. For the mechanics of trading any single earnings gap, this guide's earnings trading playbook covers the gap-and-go and gap-fill setups in detail.
A Fed Divided: What Wednesday's Minutes Can and Can't Tell Us
The Fed held its rate steady at 3.50%-3.75% at the July 28-29 meeting, but the vote was the story. Three regional presidents, Cleveland's Beth Hammack, Minneapolis's Neel Kashkari, and Dallas's Lorie Logan, dissented for a quarter-point hike, the most divided FOMC vote since September 2016. All three cited persistent inflation risk; Hammack noted business contacts describe price pressures as widening, and Kashkari argued smaller, earlier moves beat waiting for something more aggressive later.
The doves, by contrast, are weighing a labor market with real cracks: July payrolls fell 23,000, and the two prior months were revised down a combined 103,000. That's the actual tension inside the Fed, not a hypothetical one. No single rate cleanly addresses both a slowing labor market and above-target inflation, especially when the inflation pressure is substantially an energy shock outside the Fed's control.
Wednesday's 2:00 PM ET minutes release predates all of this week's news, since the meeting itself happened in late July, so it won't address the Iran-driven oil spike directly. What it can show is how far the disagreement extended beyond the three named dissenters, how seriously the committee weighed the energy-driven inflation risk against the labor-market softness, and what specific conditions officials described as justifying a hike versus staying on hold in September. Avoid predicting which way the tape breaks. Instead, watch first-move and second-move price action across 2-year and 10-year Treasury yields, the dollar, and the relative performance of QQQ versus IWM in the minutes immediately following the release, since headline-driven algorithmic reactions can produce a fast initial move that reverses once the actual text is digested. This guide's playbook for FOMC and Fed announcement days covers the mechanics of trading that kind of release.
Oil, Hormuz, and the Return of an Old Inflation Risk
This is the week's biggest unscheduled catalyst, and it has real teeth. The U.S.-Israel war on Iran resumed in July after a ceasefire collapsed over Hormuz access, and escalated again this past week: the UAE said Thursday that Iran attacked two vessels linked to its state oil company transiting the strait, and the U.S. responded by threatening an indefinite naval blockade. Treasury Secretary Bessent told Newsmax that new "economic isolation" measures are expected within days, a real if imprecisely dated catalyst inside this trading week. Trump told Axios the U.S. is "only semi-negotiating" with Iran, while the Strategic Petroleum Reserve has fallen below 300 million barrels, its lowest since January 1983, leaving less cushion if supply tightens.
Crude's reaction has been immediate: WTI and Brent both gained more than 5% on the week. The correct framing here is that oil is being pulled between real geopolitical supply risk and, at other moments this year, weaker fundamental demand signals; it is not a one-directional trade. Higher oil prices don't stay contained to energy stocks. They flow into inflation expectations (already visible in Friday's University of Michigan data), Treasury yields, airline and transport margins, consumer discretionary spending power, and ultimately Fed rate expectations. Wednesday's 10:30 AM ET EIA Weekly Petroleum Status Report carries more weight than a typical week for exactly this reason: it's the one verified, dated data point that can show whether the shipping disruption is actually tightening U.S. supply, independent of headline noise.
Nothing about this risk is on the scheduled calendar in the way an earnings report or a data release is. That's precisely why it deserves more attention than its absence from a calendar table would suggest. A single fresh headline out of the strait, a new tanker incident, a sudden diplomatic breakthrough, or the specifics of Bessent's promised measures, could override every other catalyst on this list within minutes of hitting the wire.
Stocks to Watch
Every name below earns its place because it answers "why this stock, this week," not because its chart looks interesting. Several are grouped in pairs, since the comparison between them often reveals more than either name alone.
HD (Home Depot) and LOW (Lowe's) Catalyst: Q2 earnings. When: HD Tuesday, August 18, before the open; LOW Wednesday, August 19, before the open. Why it's on the watchlist: the two closest peers in home-improvement retail, reporting a day apart, testing renovation spending under elevated mortgage rates (HD's own Q1 comps were soft, up just 0.6%). What to watch: whether LOW confirms or contradicts HD's tone on comps and Pro-customer demand. Bullish confirmation: both report stable-to-improving comps and reiterate guidance. Bearish confirmation: cautious guidance language around large remodels at either name. What could invalidate it: either company citing a one-time regional or weather distortion rather than a demand issue.
TOL (Toll Brothers) Catalyst: Q3 earnings. When: after Tuesday's close, call Wednesday 8:30 AM ET. Why it's on the watchlist: the forward-looking complement to HD/LOW, testing whether buyers are actually signing new-home contracts rather than just renovating. What to watch: net signed contracts and cancellation rate, against a consensus already cut 15.6% over 90 days to $2.93 EPS. Bullish confirmation: contract volume holding near the low end of the 2,600-2,700 unit delivery guide despite the estimate cuts. Bearish confirmation: a rising cancellation rate or a further Q4 guidance cut. What could invalidate it: management attributing weakness narrowly to the South/Mountain/Pacific regions rather than broad demand.
TGT (Target) Catalyst: Q2 earnings. When: Wednesday, August 19, before the open. Why it's on the watchlist: the primary full-price test in the trade-down thesis, after a year of struggling traffic. What to watch: traffic trends and back-to-school guidance language. Bullish confirmation: stabilizing traffic and reiterated guidance. Bearish confirmation: continued softness paired with strength at TJX/ROST the same week, confirming value migration. What could invalidate it: a Target-specific merchandising or inventory issue unrelated to demand.
TJX (TJX Companies) and ROST (Ross Stores) Catalyst: Q2 earnings. When: TJX Wednesday, August 19, before the open; ROST Thursday, August 20, around 4:00 PM ET after close. Why it's on the watchlist: the cleanest test of whether softer confidence is pushing shoppers toward value rather than out of spending altogether; ROST has already guided to 6-7% comp growth. What to watch: whether both land near or above that guidance the same week TGT sounds weak. Bullish confirmation: comps toward the high end of estimates at both names alongside TGT softness. Bearish confirmation: decelerating comps at either name, weakening the value-migration story. What could invalidate it: ROST-specific distribution-center cost noise the company has already flagged as one-time.
WMT (Walmart) Catalyst: Q2 earnings. When: Thursday, August 20, before the open. Why it's on the watchlist: the single largest verdict on U.S. consumer spending reporting this week, given its scale and grocery mix. What to watch: U.S. comparable sales ex-fuel and explicit commentary on whether higher-income shoppers keep trading down. Bullish confirmation: comps in line with estimates and steady guidance. Bearish confirmation: softening comps even as trade-down commentary intensifies. What could invalidate it: one-time grocery-pricing or e-commerce investment noise management separates from the core trend.
RDDT (Reddit) Catalyst: S&P 500 index inclusion. When: Tuesday, August 18, before the open. Why it's on the watchlist: passive index funds are required to buy shares to match the new weighting, real, mechanical buying pressure independent of company operations. What to watch: premarket volume, the opening auction, and closing-auction volume, since RDDT already reacted sharply when the addition was announced. Bullish confirmation: continued volume and price strength into and through the open. Bearish confirmation: a fade on the actual inclusion day, suggesting the flow was already front-run. What could invalidate it: broad market weakness overwhelming the mechanical flow. This guide's breakdown of index rebalancing and closing-auction volatility covers why chasing this kind of pop has a mixed track record.
ADI (Analog Devices) Catalyst: Q3 earnings. When: Wednesday, August 19, before the open, call 10:00 AM ET. Why it's on the watchlist: the one non-retail, non-housing name, testing industrial/automotive chip demand outside the AI-capex trade. What to watch: guidance against ADI's own prior forecast of roughly $3.9 billion revenue and $3.30 adjusted EPS. Bullish confirmation: guidance in line with or above that prior forecast. Bearish confirmation: a guidance cut, suggesting the AI trade has been masking broader industrial softness. What could invalidate it: company-specific inventory dynamics unrelated to end-market demand.
OXY (Occidental Petroleum) and DAL (Delta Air Lines) Catalyst: opposite-side exposure to the Hormuz standoff. When: entire week, no single scheduled event. Why it's on the watchlist: OXY is a direct play on higher crude; DAL takes the opposite side through jet-fuel cost pressure. What to watch: whether OXY outperforms and DAL underperforms on the same crude move, alongside Wednesday's EIA data. Bullish confirmation (for the pair): OXY strength and DAL weakness moving together on the same headline. Bearish confirmation: DAL holding up despite higher fuel costs, or OXY failing to respond to a crude rally. What could invalidate it: company-specific news at either name overriding the pure commodity read.
LMT (Lockheed Martin) Catalyst: Middle East escalation exposure. When: entire week, no single scheduled event. Why it's on the watchlist: defense names remain exposed to further escalation, replenishment contracts, and de-escalation headlines in either direction. What to watch: LMT alongside RTX on fresh geopolitical headlines specifically. Bullish confirmation: continued strength on escalation headlines specifically, not just general market strength. Bearish confirmation: a fade even on escalation news, suggesting the trade has become crowded. What could invalidate it: treating any single escalation headline as automatically producing a sustainable rally; that relationship hasn't held reliably this year.
Also on the Radar
DHI (D.R. Horton) and LEN (Lennar) are non-earnings macro watches, tied to Monday's NAHB index, Tuesday's housing data, and Wednesday's Fed minutes and yields; weak data paired with falling yields reads very differently than weak data paired with a hawkish Fed. RTX confirms alongside Lockheed Martin; UAL and AAL confirm alongside Delta. DE (Deere) reports Thursday, August 20 (call 10:00 AM ET, consensus EPS ~$4.85), an industrial/agricultural read distinct from the consumer and housing threads. BJ (BJ's Wholesale) reports Friday, August 21, before the open (call 8:00 AM ET), the week's final value-consumer read after Walmart, TJX, and Ross Stores.
Week at a Glance
- Day
- Mon
- Time (ET)
- 8:30 AM
- Catalyst
- Empire State Manufacturing Survey
- Stocks/Sectors
- Regional manufacturing
- Why It Matters
- Early read ahead of Tuesday's harder data.
- Day
- Mon
- Time (ET)
- 10:00 AM
- Catalyst
- NAHB Housing Market Index
- Stocks/Sectors
- DHI, LEN, TOL
- Why It Matters
- First housing-sentiment read of the week.
- Day
- Mon
- Time (ET)
- 11:00 AM
- Catalyst
- NY Fed Labor Market Survey
- Stocks/Sectors
- Broad market
- Why It Matters
- Labor data point ahead of Wednesday's Fed minutes.
- Day
- Tue
- Time (ET)
- Before open
- Catalyst
- Home Depot earnings; Reddit joins S&P 500
- Stocks/Sectors
- HD, RDDT
- Why It Matters
- Housing read and confirmed passive-flow event, same morning.
- Day
- Tue
- Time (ET)
- 8:30 AM
- Catalyst
- Housing Starts, Permits, Import/Export Prices
- Stocks/Sectors
- Homebuilders
- Why It Matters
- Confirms or contradicts Monday's NAHB reading.
- Day
- Tue
- Time (ET)
- 9:15 AM
- Catalyst
- Industrial Production, Capacity Utilization
- Stocks/Sectors
- Industrials, ADI
- Why It Matters
- Growth context ahead of Wednesday's ADI report.
- Day
- Tue
- Time (ET)
- 10:00 AM
- Catalyst
- Pending Home Sales
- Stocks/Sectors
- Homebuilders
- Why It Matters
- Forward-looking housing demand.
- Day
- Tue
- Time (ET)
- After close
- Catalyst
- Toll Brothers earnings
- Stocks/Sectors
- TOL
- Why It Matters
- New-home contract data; call Wednesday AM.
- Day
- Wed
- Time (ET)
- Before open
- Catalyst
- Target, TJX, Lowe's, Analog Devices earnings
- Stocks/Sectors
- TGT, TJX, LOW, ADI
- Why It Matters
- Densest single-morning cluster of the week.
- Day
- Wed
- Time (ET)
- 10:30 AM
- Catalyst
- EIA Petroleum Status Report
- Stocks/Sectors
- OXY, DAL, energy
- Why It Matters
- Extra weight given the active Hormuz standoff.
- Day
- Wed
- Time (ET)
- 2:00 PM
- Catalyst
- FOMC Minutes
- Stocks/Sectors
- Rate-sensitive sectors
- Why It Matters
- First look inside the most divided Fed vote since 2016.
- Day
- Thu
- Time (ET)
- Before open
- Catalyst
- Walmart earnings
- Stocks/Sectors
- WMT
- Why It Matters
- Largest single consumer read of the week.
- Day
- Thu
- Time (ET)
- 8:30 AM
- Catalyst
- Jobless Claims, Philadelphia Fed
- Stocks/Sectors
- Broad market
- Why It Matters
- Tests the labor-softness thesis.
- Day
- Thu
- Time (ET)
- ~4:00 PM
- Catalyst
- Ross Stores earnings
- Stocks/Sectors
- ROST, TJX
- Why It Matters
- Off-price confirmation alongside TJX.
- Day
- Thu
- Time (ET)
- Call 10 AM CT
- Catalyst
- Deere earnings
- Stocks/Sectors
- DE
- Why It Matters
- Industrial/agricultural-cycle read.
- Day
- Fri
- Time (ET)
- AM
- Catalyst
- Flash U.S. Manufacturing/Services PMIs
- Stocks/Sectors
- Broad market
- Why It Matters
- Final monthly growth check; confirm exact time morning-of.
- Day
- Fri
- Time (ET)
- Before open
- Catalyst
- BJ's Wholesale earnings
- Stocks/Sectors
- BJ
- Why It Matters
- Final value-consumer read of the week.
| Day | Time (ET) | Catalyst | Stocks/Sectors | Why It Matters |
|---|---|---|---|---|
| Mon | 8:30 AM | Empire State Manufacturing Survey | Regional manufacturing | Early read ahead of Tuesday's harder data. |
| Mon | 10:00 AM | NAHB Housing Market Index | DHI, LEN, TOL | First housing-sentiment read of the week. |
| Mon | 11:00 AM | NY Fed Labor Market Survey | Broad market | Labor data point ahead of Wednesday's Fed minutes. |
| Tue | Before open | Home Depot earnings; Reddit joins S&P 500 | HD, RDDT | Housing read and confirmed passive-flow event, same morning. |
| Tue | 8:30 AM | Housing Starts, Permits, Import/Export Prices | Homebuilders | Confirms or contradicts Monday's NAHB reading. |
| Tue | 9:15 AM | Industrial Production, Capacity Utilization | Industrials, ADI | Growth context ahead of Wednesday's ADI report. |
| Tue | 10:00 AM | Pending Home Sales | Homebuilders | Forward-looking housing demand. |
| Tue | After close | Toll Brothers earnings | TOL | New-home contract data; call Wednesday AM. |
| Wed | Before open | Target, TJX, Lowe's, Analog Devices earnings | TGT, TJX, LOW, ADI | Densest single-morning cluster of the week. |
| Wed | 10:30 AM | EIA Petroleum Status Report | OXY, DAL, energy | Extra weight given the active Hormuz standoff. |
| Wed | 2:00 PM | FOMC Minutes | Rate-sensitive sectors | First look inside the most divided Fed vote since 2016. |
| Thu | Before open | Walmart earnings | WMT | Largest single consumer read of the week. |
| Thu | 8:30 AM | Jobless Claims, Philadelphia Fed | Broad market | Tests the labor-softness thesis. |
| Thu | ~4:00 PM | Ross Stores earnings | ROST, TJX | Off-price confirmation alongside TJX. |
| Thu | Call 10 AM CT | Deere earnings | DE | Industrial/agricultural-cycle read. |
| Fri | AM | Flash U.S. Manufacturing/Services PMIs | Broad market | Final monthly growth check; confirm exact time morning-of. |
| Fri | Before open | BJ's Wholesale earnings | BJ | Final value-consumer read of the week. |
Scenario Map
These are conditional paths, not predictions. No single one is more likely than the others based on evidence available as of this research cutoff.
Calm persists. If retail earnings land in line with expectations, the FOMC minutes show a committee still leaning patient, and Hormuz stays quiet, the record-high, low-VIX regime just continues into a historically slower stretch of late August.
The consumer cracks but the Fed doesn't flinch. Two or more retail names confirm real softness, yet the minutes show the hawkish dissent never spread past the three named officials. Discretionary and small-cap names take the hit here, not the broader index.
The Fed surprises hawkish. Suppose the minutes reveal support for tighter policy running wider than the 9-3 vote suggested, especially around energy-driven inflation. Yields climb regardless of what retail shows, and it's growth and small caps under pressure this time, from the rate side rather than the consumer side.
Oil overrides everything else. A fresh Hormuz incident, a tanker attack, an infrastructure strike, or the details of Bessent's promised measures can swamp every other catalyst on this list within minutes of hitting the wire. When that happens, energy and airlines trade the headline, and retail earnings become background noise for a session or two.
Trader Preparation
The behavioral trap this calendar sets is straightforward: multiple single-stock and macro catalysts land in overlapping windows, and the temptation is to try to trade all of them. Spreading focus that thin usually means arriving late to each individual move.
- Confirm earnings dates, report times, and the exact Friday PMI release time the morning of, since schedules occasionally shift.
- Check the options-implied move for any name before sizing a position around its report; a smaller-than-usual expected range is itself information.
- Treat the retail cluster as a group signal first: one weak print among five is noise, three in the same week is a trend.
- Widen stops or reduce size around the 2:00 PM FOMC minutes release, since headline-driven algorithmic reactions can produce brief false moves before the real reaction sets in.
- Treat any fresh Hormuz headline as a standalone catalyst for energy, defense, and airline names even though none is formally scheduled; this conflict produces fast-moving headlines on short notice.
- Watch OXY-vs-DAL and LMT-vs-the-broader-market as quick checks on whether a given oil headline is actually being priced by equities, and keep sizing especially disciplined Wednesday and Thursday when overlapping catalysts compress normal reaction time.
FAQs
Why does the Fed's 9-3 vote matter if the rate decision itself didn't change anything?
A unanimous hold and a 9-3 hold represent very different levels of committee conviction, even though the headline rate is identical. Three regional presidents publicly breaking with the majority signals the debate inside the Fed is live rather than settled, which is exactly why Wednesday's minutes carry more weight than they would after a unanimous vote.
Key Takeaway: Watch whether the minutes show the hawkish view stayed contained to three officials or extended further into the committee.
What would actually confirm that the Iran conflict is affecting U.S. inflation, rather than just oil traders?
Oil price moves alone don't guarantee an inflation response; the transmission has to show up in how households actually expect prices to behave. Friday's report showed one-year inflation expectations rising to 4.3% alongside a sentiment decline survey director Joanne Hsu tied directly to the conflict, a more direct read than the oil price alone provides.
Key Takeaway: Wednesday's EIA inventory data and any fresh Hormuz headlines this week will show whether that inflation-expectations move continues building or fades.
Is the Russell 2000's recent strength a real rotation into small caps?
Small-cap strength alongside large-cap softness can reflect several things: relief on rate-cut expectations (small caps carry more floating-rate debt), sector-specific weakness dragging large caps down, or a mean-reversion bounce after large-cap dominance. Treating one strong week as a confirmed multi-week trend is a common way traders end up leaning the wrong way.
Key Takeaway: Watch whether Russell 2000 relative strength persists through this week's Fed and retail catalysts before treating it as a real trend rather than noise.
With five retailers reporting and an FOMC minutes release in the same week, is it safer to just avoid trading entirely?
Trying to trade every catalyst in the same 72-hour window usually means arriving late to each move and reacting to price instead of following a plan. This is a preparation point, not a directional call; reducing size or widening stops around the densest overlap windows (Wednesday and Thursday specifically) is more practical than sitting out the whole week.
Key Takeaway: Position sizing and selectivity matter more this week than trying to predict which single catalyst will dominate.
What's the practical difference between the consumer "slowing down" and the consumer "trading down," and why does it change how I'd trade retail names?
The distinction matters for stock selection: a genuine slowdown would show up broadly across Target, TJX, Ross Stores, and Walmart alike. Trade-down behavior instead means Target and other full-price retailers soften while TJX, Ross Stores, and Walmart hold up or strengthen, since all three have historically gained share when shoppers get more price-sensitive without spending less overall.
Key Takeaway: This week's TGT-vs-TJX-vs-ROST comparison is the cleanest real-time test of which scenario is actually playing out.
Disclaimer
Article Sources
- Federal Reserve Board, FOMC Statement, July 29, 2026 - confirms the 9-3 vote and the three named dissenters.
- U.S. Bureau of Labor Statistics, Employment Situation, July 2026 - confirms nonfarm payrolls, unemployment rate, and labor force participation.
- U.S. Bureau of Labor Statistics, Consumer Price Index, July 2026 - confirms headline and core CPI figures.
- U.S. Census Bureau, Advance Monthly Retail Trade Survey - confirms July 2026 retail sales figures.
- University of Michigan, Surveys of Consumers - confirms preliminary August consumer sentiment and inflation expectations.
- CNBC, Oil Prices Today: Brent, WTI, Hormuz - confirms Friday close levels for WTI and Brent and the naval-blockade and Bessent developments.
- Ross Stores, Inc., Second Quarter 2026 Earnings Release and Conference Call announcement - confirms Ross Stores' report date and time.
- BJ's Wholesale Club Holdings, Second Quarter Fiscal 2026 Earnings Conference Call Date - confirms BJ's report date and time.
- Toll Brothers Q3 2026 Earnings Call scheduling notice - confirms Toll Brothers' report date and call time.
Was this helpful?
Be the first to weigh in

Written by
Kazi Mezanur RahmanFounder, independent researcher, and editor of DayTradingToolkit. A one-person publication focused on risk-first trading education and documented tool research. He trades his own capital as a retail trader and combines personal market experience with systematic primary-source research.
Keep Reading
Market Analysis & Insights
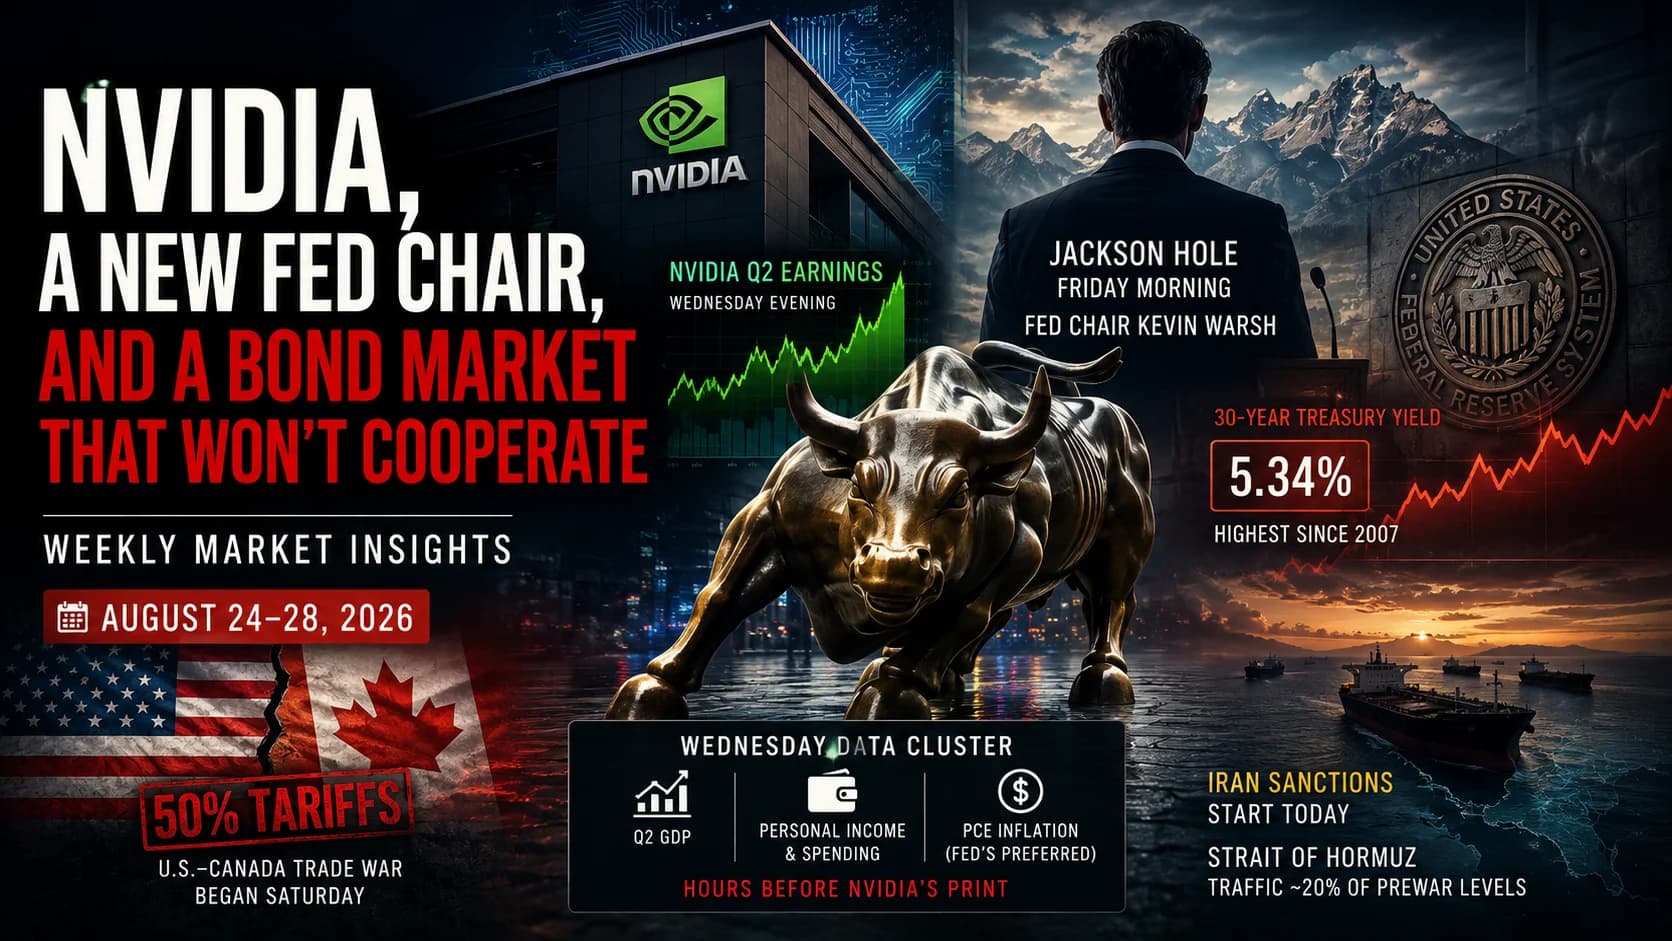
Nvidia, a New Fed Chair, and a Bond Market That Won't Cooperate: Weekly Market Insights, August 24-28
Warsh's first Jackson Hole speech, Nvidia's earnings, and fresh Iran and Canada shocks collide this week. The full Aug 24-28 catalyst map, stock watchlist, and scenario tree for traders.

Market Analysis & Insights
Two Wars, a Trade Fight, and CPI Still Has to Land Clean: Weekly Market Insights, September 7-11
A blowout jobs report already pushed rate-hike odds above 58%. Now a widening Middle East war and a new US-Canada trade fight collide with the last inflation data before the Fed's September 15-16 decision, while Nokia, Compass Pathways, Qualcomm, and Amgen all move on stories the calendar never saw coming.

Market Analysis & Insights
An AI Slowdown Call, a Live Fed Hike, and $108 Oil Collide in One Week: Weekly Market Insights, September 14-18
CME FedWatch has Wednesday's hike odds near 90 percent after a weekend AI slowdown call from Anthropic's CEO hit chip stocks, oil spiked past $107 on a Saudi pipeline shutdown, and Friday's quad witching sets up next Monday's S&P rebalance.
Market Analysis & Insights
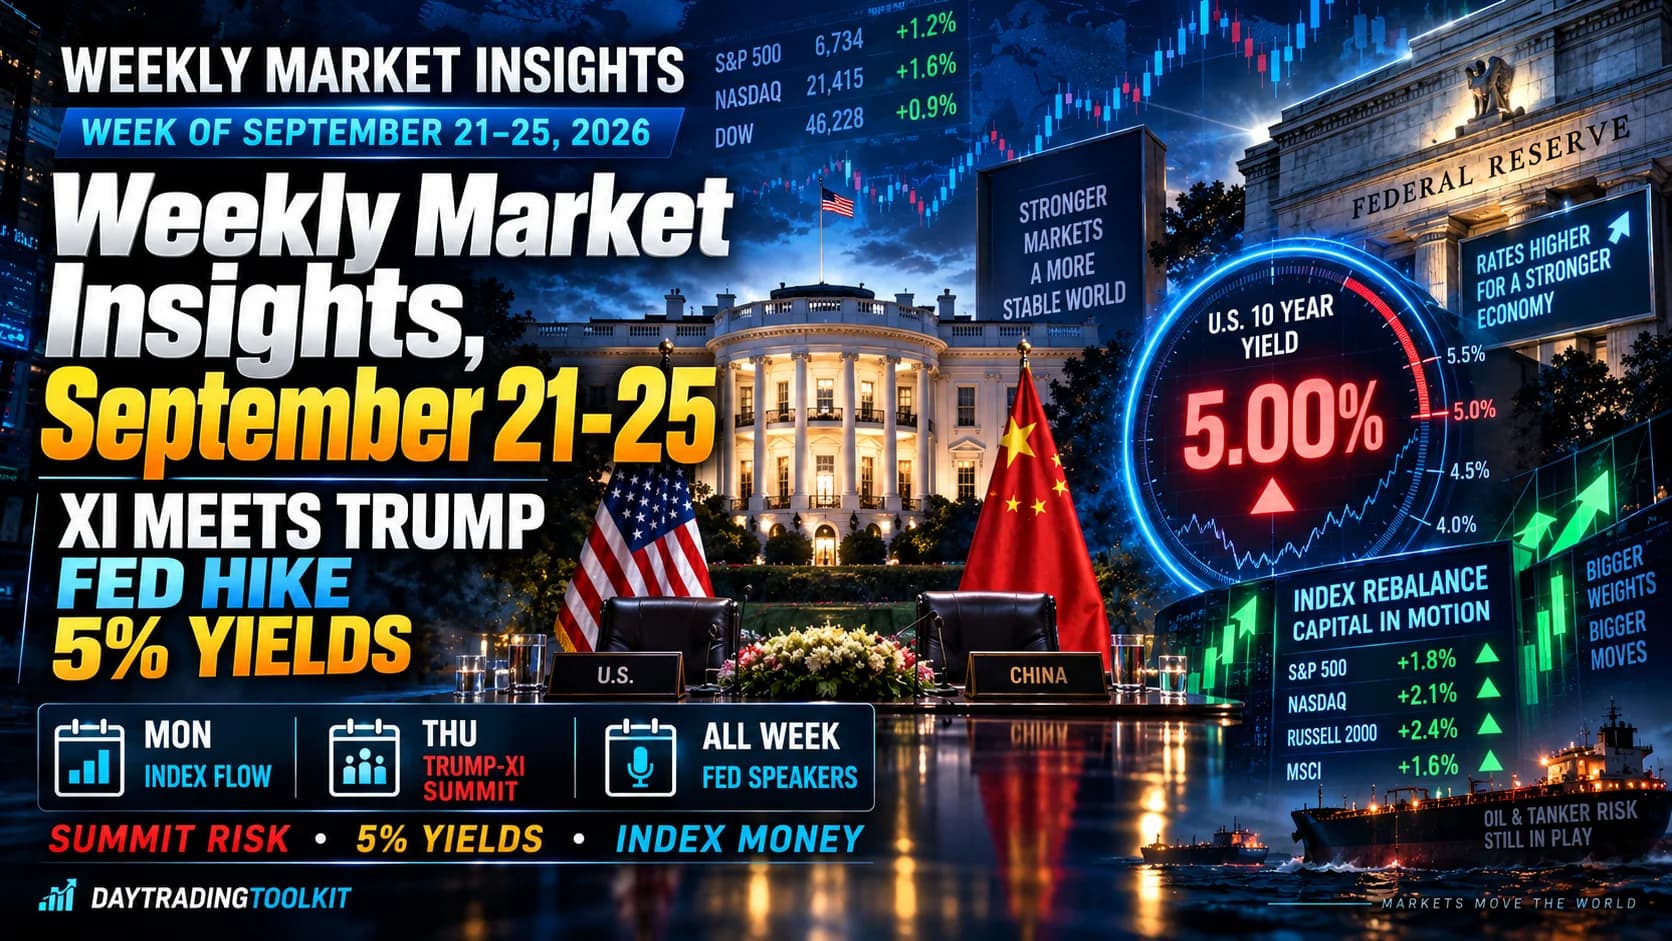
Xi Comes to Washington, the Fed's First Hike Lands, and Index Money Moves Before Monday's Open: Weekly Market Insights, September 21-25
Xi Jinping arrives at the White House Thursday for the first Chinese state visit since 2015, the Fed just hiked to 3.75-4.00 percent with more projected, the 10-year is sitting on 5 percent, and Bloom Energy and SanDisk join their new indices before Monday's open. The full catalyst map, watchlist, and scenario tree for September 21-25.
Comments
No comments yet. Be the first to share your thoughts.