On August 28, 2026, one market move captured the reaction to Kevin Warsh's Jackson Hole speech before the story was fully visible in stocks. The 2-year Treasury yield surged almost 12 basis points as traders rapidly priced in a greater chance of a September rate increase. The Nasdaq fell and the dollar jumped, but the short end of the Treasury market showed what had changed underneath both moves.
That move told day traders what had changed: the expected path of Federal Reserve policy.
The 2-year Treasury yield is one of the cleanest real-time gauges of those expectations. It does not predict every move in stocks, and it should never be treated as a stand-alone buy or sell signal. But around CPIThe Consumer Price Index (CPI) is a monthly U.S. government report measuring the average change in prices paid by consumers for goods and services — it's the most closely watched inflation indicator in the market.Read definition →, payrolls, FOMCThe Federal Open Market Committee (FOMC) is the Federal Reserve committee that sets U.S. monetary policy — most importantly, the target federal funds rate — at eight scheduled meetings per year.Read definition → decisions, and Fed speeches, it can help you distinguish a genuine policy repricing from ordinary market noise.
This guide explains what the yield measures, why it can move before equities fully react, how it differs from the 10-year yield, and how to add it to an intraday decision process without overreading every tick.
What is the 2-year Treasury yield? It is the annualized yield investors receive from holding a U.S. Treasury security with roughly two years remaining to maturity. Because that maturity sits close to the horizon over which traders can form reasonably concrete expectations for Federal Reserve decisions, the yield tends to respond quickly when the expected path of short-term interest rates changes.
Why the 2-year Treasury yield matters to day traders
The stock market does not wait for the Federal Reserve to change its target rate. It continuously prices what the Fed is likely to do next.
The 2-year yield is useful because it compresses much of that expected policy path into one observable market price. CME Group describes the yield as broadly reflecting compounded expectations for overnight federal funds rates across the next two years, with smaller adjustments for LiquidityLiquidity in trading refers to how easily you can enter and exit a position at a fair price — a liquid stock has high volume and a tight bid-ask spread, allowing large orders to be filled quickly without moving the price, while an illiquid Read definition → and other factors. It is not a perfect forecast. It is a live consensus price that changes as new information arrives.
For a day trader, that makes the 2-year yield valuable in three ways:
- It shows whether the market read an event as HawkishHawkish describes a monetary policy stance favoring higher interest rates, reduced money supply, or tighter financial conditions to control inflation — the opposite of dovish.Read definition → or DovishDovish describes a monetary policy stance that favors keeping interest rates low, accommodating economic growth, or signaling tolerance for inflation — as opposed to hawkish, which favors tighter conditions.Read definition →. A hotter inflation report can lift the yield as traders price fewer cuts or more hikes. A weak employment report can push it lower if the market sees more room for easing.
- It helps confirm moves in rate-sensitive assets. Growth stocks, small caps, homebuilders, the dollar, and gold can all respond to the same policy repricing, although not always with the same speed or magnitude.
- It exposes divergences. If a stock index rallies while the 2-year yield and dollar keep climbing after a hawkish surprise, the rally may be fighting the broader macro impulse. That is a reason to investigate, not an automatic reason to short.
The yield is most informative when a scheduled event directly changes expectations for monetary policy. The economic reports that matter most to day traders include CPI, the monthly jobs report, retail sales, and the Fed's preferred inflation measures. FOMC decisions and speeches by influential officials can matter just as much.
Bond prices and yields move in opposite directions
A Treasury yield is not quoted like a stock price. When demand for an existing bond rises, its price increases and its yield falls. When investors sell the bond, its price falls and its yield rises.
Suppose a 2-year note pays a fixed coupon. If new information makes future short-term rates look higher, investors will not want to pay the same price for that fixed stream of payments. The note's price falls until its yield becomes competitive with the market's new rate expectations.
This inverse relationship explains headlines such as "Treasuries sold off and yields jumped." The selling refers to bond prices. The jump refers to yields.
Yield changes are measured in basis points:
- 1 basis point equals 0.01 percentage point.
- A move from 4.20% to 4.25% is a 5 basis point increase.
- A move from 4.20% to 4.05% is a 15 basis point decrease.
Context matters more than the raw number. A 3 basis point move during a quiet afternoon may be ordinary. A 10 basis point move in the first minutes after CPI is a meaningful repricing, especially if the dollar and equity index futures confirm it.
The 2-year yield versus the 10-year yield
Day traders often watch both maturities, but they answer different questions.
- Measure
- 2-year Treasury yield
- What usually drives it most
- Expected Fed policy over the next several years
- The question it helps answer
- Did the expected path of rate hikes or cuts change?
- Measure
- 10-year Treasury yield
- What usually drives it most
- Expected future short rates, growth, inflation, and term premium
- The question it helps answer
- Did the market change its view of the longer-run economic and inflation outlook?
- Measure
- 10-year minus 2-year spread
- What usually drives it most
- The relationship between the long and short ends of the curve
- The question it helps answer
- Is the curve steepening, flattening, or inverting, and why?
| Measure | What usually drives it most | The question it helps answer |
|---|---|---|
| 2-year Treasury yield | Expected Fed policy over the next several years | Did the expected path of rate hikes or cuts change? |
| 10-year Treasury yield | Expected future short rates, growth, inflation, and term premium | Did the market change its view of the longer-run economic and inflation outlook? |
| 10-year minus 2-year spread | The relationship between the long and short ends of the curve | Is the curve steepening, flattening, or inverting, and why? |
The distinction is not absolute. The 2-year yield can contain risk and liquidity premiums, while the 10-year yield also responds to Fed expectations. Still, the short end is generally more tightly connected to near-term monetary policy. The long end carries more exposure to inflation uncertainty, fiscal concerns, supply, and term premium.
Term premium is the extra compensation investors may demand for holding a longer-maturity bond instead of repeatedly rolling short-term securities. It can rise even when traders do not expect the Fed to hike. That is why a sharp increase in the 10-year yield with a quieter 2-year yield can have a different meaning from a synchronized selloff across both maturities.
Consider two scenarios:
- The 2-year yield leads higher after strong payrolls. Traders may be pricing a more restrictive Fed path. The dollar may strengthen, while rate-sensitive equities come under pressure.
- The 10-year yield leads higher while the 2-year barely moves. The market may be reacting to long-run inflation, Treasury supply, or term premium rather than an immediate Fed decision.
Do not reduce the yield curve to "inversion means recession." Research from the Federal Reserve has cautioned that the familiar 10-year minus 2-year spread is not the only, or necessarily the best, recession signal. For intraday trading, the change in each maturity and the catalyst behind it are usually more actionable than the curve's static shape.
What makes the 2-year Treasury yield move
The yield reacts when new information changes the expected level or timing of Fed policy. Some catalysts are much more direct than others.
Inflation data
A hotter-than-expected CPI or core PCE reading often pushes the 2-year yield higher because persistent inflation can make rate cuts less likely or further tightening more likely. A soft inflation reading can produce the opposite response.
The details matter. A benign headline number paired with sticky services inflation may produce an initial yield drop that reverses as traders read deeper into the report.
Employment data
Payroll growth, unemployment, average hourly earnings, and revisions can pull policy expectations in different directions. A strong headline combined with accelerating wages can lift the 2-year yield. A weak payroll number may lower it, unless the weakness is accompanied by an inflationary wage surprise.
This is especially relevant for the weekly market setup around the September jobs report. The first reaction can change when traders process revisions and the unemployment rate.
FOMC decisions and projections
The policy statement, rate decision, Summary of Economic Projections, and press conference can each alter the expected path. The 2-year yield may reverse several times as the market moves from the statement to the projections and then to the Chair's answers.
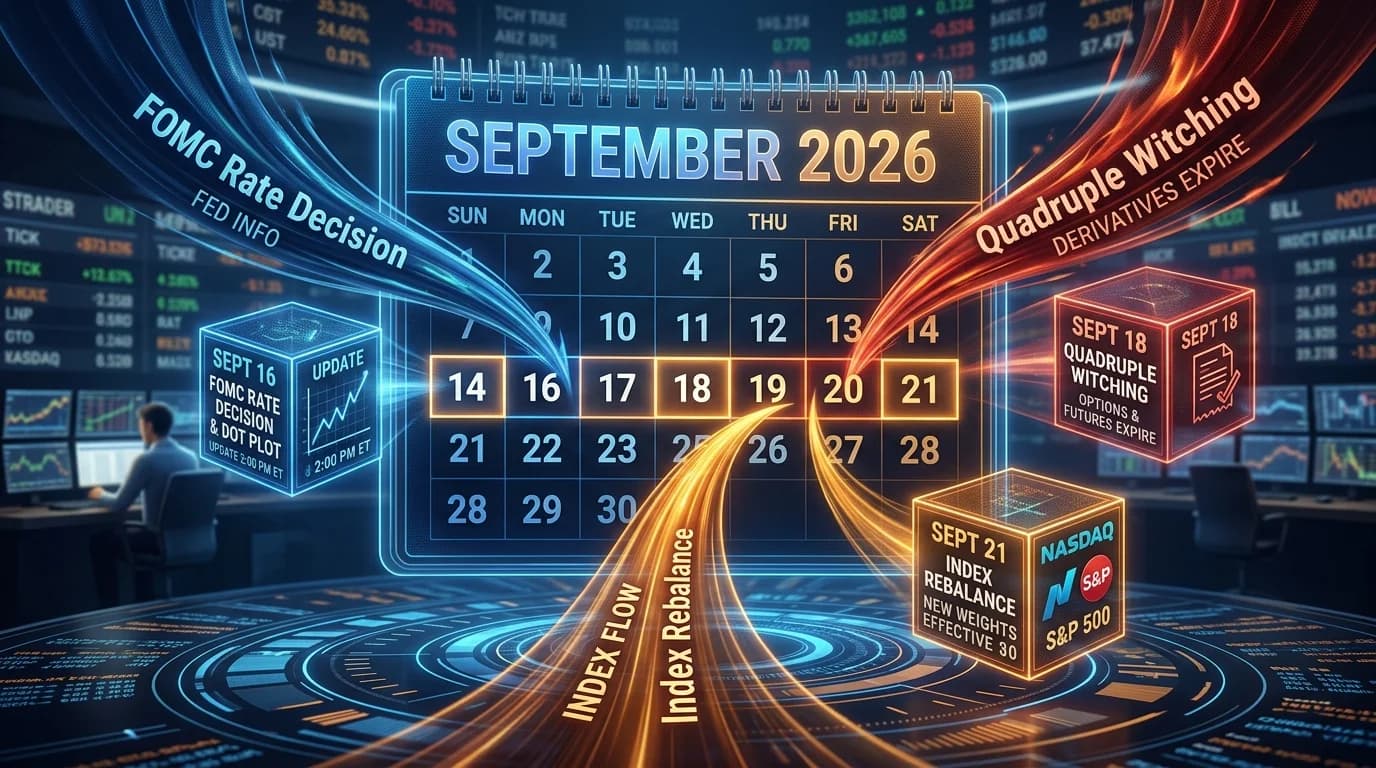
On these days, treating the first candle as the final verdict is risky. The FOMC and September trading calendar can help you identify when a rate decision, projections, expiration flows, and rebalancing may overlap.
Fed speeches
Not every official moves the market equally. Comments matter most when the speaker has influence, the policy outlook is uncertain, and the language differs from what traders expected.
Our Fed Chair speech trading playbook explains why prepared remarks, Q&A, and follow-up headlines can create separate volatility waves.
Growth shocks and geopolitical events
A sudden growth scare can pull yields lower as traders seek safety and anticipate easier policy. An energy shock can be more complicated. Oil-driven inflation pressure may lift yields, while the related hit to growth may pull in the other direction.
That conflict is one reason the 2-year yield should be read alongside the catalyst, the dollar, crude oil, and equity index behavior.
How different markets can react
There is no fixed formula that says a 5 basis point increase must push the Nasdaq down by a certain percentage. The effect depends on why yields moved, how much was already priced, and whether another force is dominating the session.
Use the following map as a set of tendencies, not promises.
- Market
- Nasdaq 100 and growth stocks
- When the 2-year yield rises on hawkish repricing
- Higher discount rates can pressure long-duration valuations
- What can break the relationship
- Strong earnings, AI or sector news, short covering
- Market
- Small caps
- When the 2-year yield rises on hawkish repricing
- Higher financing costs and tighter financial conditions can weigh on leveraged firms
- What can break the relationship
- Domestic growth optimism or a strong risk-on rotation
- Market
- Homebuilders and real estate
- When the 2-year yield rises on hawkish repricing
- Rate expectations can raise borrowing-cost concerns
- What can break the relationship
- Falling long-term mortgage rates or company-specific data
- Market
- Banks
- When the 2-year yield rises on hawkish repricing
- A better rate backdrop can help some revenue streams
- What can break the relationship
- Curve flattening, credit concerns, deposit costs
- Market
- U.S. dollar
- When the 2-year yield rises on hawkish repricing
- A more hawkish expected Fed path can support the dollar
- What can break the relationship
- Stronger policy repricing abroad or risk-off flows into another currency
- Market
- Gold
- When the 2-year yield rises on hawkish repricing
- Higher nominal yields and a stronger dollar can create pressure
- What can break the relationship
- Inflation hedging, geopolitical demand, falling real yields
| Market | When the 2-year yield rises on hawkish repricing | What can break the relationship |
|---|---|---|
| Nasdaq 100 and growth stocks | Higher discount rates can pressure long-duration valuations | Strong earnings, AI or sector news, short covering |
| Small caps | Higher financing costs and tighter financial conditions can weigh on leveraged firms | Domestic growth optimism or a strong risk-on rotation |
| Homebuilders and real estate | Rate expectations can raise borrowing-cost concerns | Falling long-term mortgage rates or company-specific data |
| Banks | A better rate backdrop can help some revenue streams | Curve flattening, credit concerns, deposit costs |
| U.S. dollar | A more hawkish expected Fed path can support the dollar | Stronger policy repricing abroad or risk-off flows into another currency |
| Gold | Higher nominal yields and a stronger dollar can create pressure | Inflation hedging, geopolitical demand, falling real yields |
The Nasdaq relationship receives the most attention because growth-company valuations depend heavily on cash flows expected far in the future. When the market's discount rate rises, those future cash flows are worth less in present-value terms. But intraday positioning can overwhelm that textbook relationship for hours or even an entire session.
Banks show why nuance matters. Rising rates are not automatically bullish for the group. If the 2-year jumps while the 10-year moves less, the curve can flatten. If funding costs rise faster than asset yields, or if credit stress grows, bank stocks may still fall.
A practical intraday workflow
Watching the 2-year yield is useful only if it improves a decision. Adding another flashing number to the screen is not a process.
Here is a straightforward way to use it around a scheduled catalyst.
1. Record the pre-event baseline
Before the release, note:
- The 2-year and 10-year yields
- Nasdaq 100 and S&P 500 futures
- The U.S. Dollar Index
- The market's expected Fed path, when relevant
- The consensus forecast and the parts of the release most likely to matter
The baseline gives you a reference point. Without it, "yields are up" may describe a move that happened hours earlier and has already been absorbed.
2. Identify which maturity leads
Immediately after the event, ask whether the 2-year or 10-year yield is making the stronger move.
A leading move in the 2-year usually points toward Fed-path repricing. A leading move in the 10-year may indicate a change in longer-run inflation, growth, or term premium. If both surge, the event may be moving policy expectations and the longer-run outlook together.
3. Wait for the report to be interpreted
The first move can be generated by headline-reading systems. Payroll revisions, wage data, CPI components, Fed projections, and Q&A can change the interpretation.
You do not need to predict every reversal. You need to recognize that the market has not finished reading.
For many traders, the useful question after the first 5 to 15 minutes is whether the yield holds beyond its initial range. Persistence often provides better confirmation than the first spike.
4. Look for cross-asset confirmation
Suppose the 2-year yield rises sharply after a hot CPI print. A stronger dollar and pressure in Nasdaq futures would fit the hawkish interpretation. If yields then retrace, the dollar rolls over, and the Nasdaq reclaims its pre-release level, the original trade premise is weakening.
Confirmation does not require every asset to line up perfectly. It means the pieces should tell a broadly coherent story.
5. Define invalidation before entry
An entry based on policy repricing needs an invalidation tied to that thesis. That could be:
- The 2-year yield returning through its pre-event level
- The yield failing to hold the first 5-minute range
- The dollar rejecting its corresponding breakout
- The index reclaiming a key premarket level despite persistent yields
The exact trigger depends on the setup. The principle is constant: if the evidence that justified the trade disappears, reassess the trade.
6. Separate information from execution
The Treasury market can tell you what macro traders are pricing. It does not tell you where to place a stop in QQQ or whether liquidity in your small-cap stock is adequate.
Use the yield as context and confirmation. Use the chart, volume, liquidity, and your risk plan for execution.
If you want to study the rates market as the traded instrument rather than as a confirmation tool, our bond futures scalping strategy for ZB and ZN covers a separate execution framework.
The Jackson Hole move as a case study
Kevin Warsh's August 28, 2026 speech offered a clean example of why the short end matters.
The speech argued that inflation risks required greater vigilance and that policy was not sufficiently restrictive. Traders responded by raising the probability of a September rate increase. The 2-year yield rose about 11.8 basis points to roughly 4.35%, according to Barron's, its largest one-day Jackson Hole speech reaction since 1996. The 10-year yield rose by less, and the dollar strengthened.
The shape of the move mattered. The 2-year led because the market was repricing the near-term Fed path. This was not simply a broad rise in long-term yields caused by Treasury supply or term premium.
Equity traders who watched only the index saw prices falling. Traders who also watched the 2-year yield saw why the pressure was developing and what would need to reverse for the hawkish thesis to weaken.
Our full Jackson Hole aftermath analysis covers the speech, the cross-asset reaction, and the levels that became relevant afterward.
When the 2-year yield can mislead you
The 2-year yield is informative, but it is not a universal market compass.
A move may already be priced. If traders spent days positioning for a hot inflation report, an in-line release can trigger a reversal even though the absolute inflation rate remains elevated.
Stocks can respond to a different catalyst. Earnings, guidance, regulation, mergers, and sector news can dominate the rate signal.
Safe-haven flows can complicate the message. A severe risk-off event may push Treasury yields lower because investors buy government bonds. Stocks can fall at the same time. In that case, lower yields are not a bullish signal.
The long end can drive financial conditions. Mortgage rates and many valuation models are more closely connected to longer maturities. A quiet 2-year does not make a sharp 10-year move irrelevant.
Curve moves can carry different information. If the 2-year falls faster than the 10-year, the curve may steepen because traders expect cuts. If the 10-year rises faster, it may steepen because of inflation, growth, supply, or term premium. The same word, "steepening," can describe opposite economic stories.
Market plumbing and positioning matter. Thin liquidity, crowded trades, dealer hedging, and futures positioning can magnify or briefly distort a move.
Treat the yield as evidence. Then ask what produced the evidence and whether other markets agree.
A screen-ready checklist
Before a high-impact release:
- Mark the pre-event 2-year and 10-year yields.
- Know the consensus and which report components matter.
- Identify rate-sensitive indexes or sectors on your watchlist.
- Reduce size if spreads and volatility are abnormal.
After the release:
- Measure the yield change in basis points.
- Check whether the 2-year or 10-year is leading.
- Compare the move with the dollar and index futures.
- Let revisions, details, and Fed commentary enter the price.
- Define the level that would invalidate the macro read.
- Execute from your instrument's chart, not from the yield alone.
You do not need to become a bond trader. You need to recognize when the bond market is changing the price of money, because that price reaches nearly every asset on a day trader's screen.
Frequently asked questions
What does a rising 2-year Treasury yield mean?
Why does the 2-year Treasury yield affect stocks?
Is a higher 2-year yield always bearish for the Nasdaq?
What is the difference between the 2-year and 10-year Treasury yields?
What is a basis point?
Where can I watch the 2-year Treasury yield?
Which economic reports move the 2-year yield most?
Can the 2-year yield fall while stocks also fall?
Should day traders trade directly from Treasury yield moves?
Disclaimer
Article sources
- Daily Market Yield on U.S. Treasury Securities at 2-Year Constant Maturity - , Federal Reserve Bank of St. Louisfred.stlouisfed.org
- Treasury Yield Curve Methodology - , U.S. Department of the Treasuryhome.treasury.gov
- The Treasury Tantrum of 2023 - , Board of Governors of the Federal Reserve Systemfederalreserve.gov
- The Sensitivity of Long-Term Interest Rates: A Tale of Two Frequencies - , Federal Reserve Bank of New Yorklibertystreeteconomics.newyorkfed.org
- What Drives Long-Term Treasury Yields? - , CME Groupcmegroup.com
- Don't Fear the Yield Curve, Reprise - , Board of Governors of the Federal Reserve Systemfederalreserve.gov
- Rate Hike Expectations Rise After Warsh Speech at Jackson Hole - , Reutersreuters.com
- 2-Year Treasury Yield Surges in Biggest Jackson Hole Reaction Since Greenspan Era - , Barron'sbarrons.com