
Q3 Earnings Season: The Full Trading Calendar

In this article10 sections
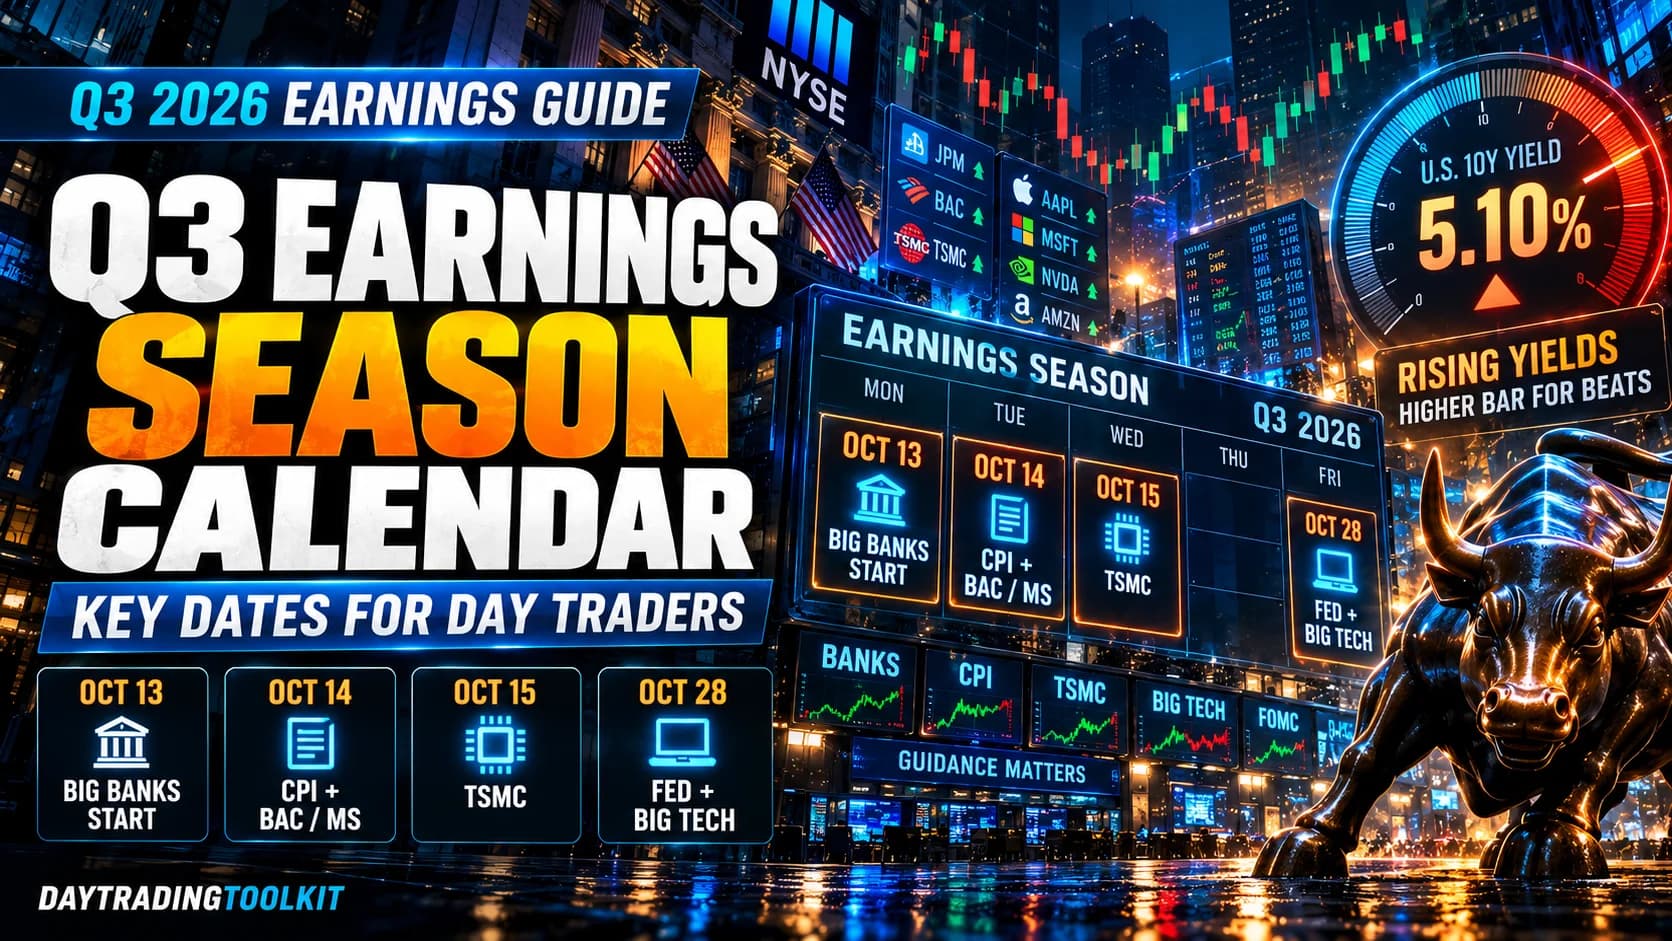
Wall Street expects S&P 500 companies to report third-quarter earnings growth of 28.9 percent, according to FactSet's September 18 estimate. That would be the index's third straight quarter of growth above 25 percent. And yet the index trades at roughly 19 times forward earnings, down from about 20.4 at the end of June. Profits are climbing faster than prices.
The reason sits on a different screen. The 10-year Treasury yield just hit its highest level since 2007, and the Federal Reserve is pricing in another rate hike before the quarter's biggest reports are even out. That makes this earnings season unusual: strong numbers are expected, but the bar for what the market will reward is being set by the bond market, not by analysts.
This guide lays out the confirmed dates, the scheduled economic data that lands on top of them, and a practical framework for trading the busiest four weeks of the quarter.
What is earnings season? Earnings season is the roughly six-week period after each calendar quarter ends when most public companies report their results. For the third quarter, which ended September 30, the unofficial start is the big-bank reports in mid-October, and the heaviest weeks run from mid-October through early November. It is the most volatile stretch of the quarter for individual stocks.
Why This Earnings Season Is Different
Three conditions make this quarter's reports trade differently from the last few.
Rates are rising, not falling. On September 16, the Fed raised its benchmark rate to a range of 3.75 to 4.00 percent, its first hike since 2023, and 16 of 18 policymakers projected at least one more increase this year. By September 23, fed funds futures put the odds of a hike at the October 27 to 28 meeting near 73 percent. In a hiking cycle, guidance matters more than the quarter just finished, because the market is trying to figure out what higher borrowing costs do to next year's profits.
Bonds are competing with stocks. Here's a number worth sitting with. At a forward price-to-earnings ratio of about 19.4, the S&P 500's forward earnings yield (earnings divided by price) is roughly 5.2 percent. The 10-year Treasury yield hit 5.10 percent on September 23. That means a risk-free government bond now pays almost as much as the stock market's expected earnings. When that gap is this thin, a company that merely meets expectations gives investors little reason to pay more for its shares. Our guide to the 10-year Treasury yield explains the mechanism in detail.
The growth is concentrated. Zacks Investment Research estimates third-quarter earnings growth of about 23 percent with revenue up 11.2 percent, and notes that a handful of AI-exposed companies drive a large share of the total. Excluding technology, full-year 2026 growth for the rest of the index is closer to 15 percent. When a few names carry the aggregate, their reports move the index far more than their weight suggests.
Put those three together and you get a season where beats are expected, guidance is the real test, and the reaction to any single report can be amplified or muted by whatever the 10-year yield did that morning.
The Q3 Earnings Calendar: Confirmed Dates
Every date below was confirmed from the company's own investor relations announcement or an official agency schedule at the time of writing. Companies occasionally move dates, so check again the day before any report you plan to trade. All times are Eastern.
- Date
- Fri, Oct 2
- Event
- September jobs report (BLS)
- Timing
- 8:30 AM
- Why It Matters
- Sets rate expectations heading into the season
- Date
- Thu, Oct 8
- Event
- PepsiCo Q3 results
- Timing
- Before the open
- Why It Matters
- First read on consumer spending and pricing power
- Date
- Thu, Oct 8
- Event
- TSMC September monthly sales
- Timing
- Early morning ET
- Why It Matters
- Early signal on AI chip demand ahead of TSMC's full report
- Date
- Fri, Oct 9
- Event
- Delta Air Lines Q3 results
- Timing
- Morning, call at 10:00 AM
- Why It Matters
- Fuel costs, travel demand, first transport report
- Date
- Tue, Oct 13
- Event
- JPMorgan Chase Q3 results
- Timing
- Before the open, call 8:30 AM
- Why It Matters
- Unofficial kickoff; sets the tone for financials
- Date
- Tue, Oct 13
- Event
- Wells Fargo Q3 results
- Timing
- 7:00 AM, call 10:00 AM
- Why It Matters
- Consumer credit and net interest income
- Date
- Tue, Oct 13
- Event
- Goldman Sachs Q3 results
- Timing
- Before the open, call 9:30 AM
- Why It Matters
- Trading and investment banking revenue
- Date
- Tue, Oct 13
- Event
- Citigroup Q3 results
- Timing
- About 8:00 AM, call about 11:00 AM
- Why It Matters
- Global banking and consumer credit
- Date
- Wed, Oct 14
- Event
- Bank of America Q3 results
- Timing
- About 6:45 AM, call 8:30 AM
- Why It Matters
- Rate sensitivity of deposits and loans
- Date
- Wed, Oct 14
- Event
- September CPI (BLS)
- Timing
- 8:30 AM
- Why It Matters
- Lands the same morning as two big banks
- Date
- Wed, Oct 14
- Event
- Morgan Stanley Q3 results
- Timing
- About 9:00 AM, call 9:30 AM
- Why It Matters
- Wealth management and trading
- Date
- Thu, Oct 15
- Event
- TSMC Q3 results
- Timing
- About 2:00 AM ET (2:00 PM Taipei)
- Why It Matters
- The AI supply chain's most important single report
- Date
- Thu, Oct 15
- Event
- September PPI (BLS)
- Timing
- 8:30 AM
- Why It Matters
- Second inflation read of the week
- Date
- Fri, Oct 16
- Event
- Monthly options expiration
- Timing
- All day
- Why It Matters
- Can pin or accelerate moves in heavily traded names
- Date
- Tue, Oct 20
- Event
- Netflix Q3 results
- Timing
- About 4:01 PM
- Why It Matters
- First major consumer tech report
- Date
- Tue to Wed, Oct 27 to 28
- Event
- FOMC meeting, decision Oct 28
- Timing
- 2:00 PM on Oct 28
- Why It Matters
- Possible second rate hike in the middle of Big Tech week
- Date
- Fri, Oct 30
- Event
- Employment Cost Index Q3 (BLS)
- Timing
- 8:30 AM
- Why It Matters
- Wage inflation, closely watched by the Fed
| Date | Event | Timing | Why It Matters |
|---|---|---|---|
| Fri, Oct 2 | September jobs report (BLS) | 8:30 AM | Sets rate expectations heading into the season |
| Thu, Oct 8 | PepsiCo Q3 results | Before the open | First read on consumer spending and pricing power |
| Thu, Oct 8 | TSMC September monthly sales | Early morning ET | Early signal on AI chip demand ahead of TSMC's full report |
| Fri, Oct 9 | Delta Air Lines Q3 results | Morning, call at 10:00 AM | Fuel costs, travel demand, first transport report |
| Tue, Oct 13 | JPMorgan Chase Q3 results | Before the open, call 8:30 AM | Unofficial kickoff; sets the tone for financials |
| Tue, Oct 13 | Wells Fargo Q3 results | 7:00 AM, call 10:00 AM | Consumer credit and net interest income |
| Tue, Oct 13 | Goldman Sachs Q3 results | Before the open, call 9:30 AM | Trading and investment banking revenue |
| Tue, Oct 13 | Citigroup Q3 results | About 8:00 AM, call about 11:00 AM | Global banking and consumer credit |
| Wed, Oct 14 | Bank of America Q3 results | About 6:45 AM, call 8:30 AM | Rate sensitivity of deposits and loans |
| Wed, Oct 14 | September CPI (BLS) | 8:30 AM | Lands the same morning as two big banks |
| Wed, Oct 14 | Morgan Stanley Q3 results | About 9:00 AM, call 9:30 AM | Wealth management and trading |
| Thu, Oct 15 | TSMC Q3 results | About 2:00 AM ET (2:00 PM Taipei) | The AI supply chain's most important single report |
| Thu, Oct 15 | September PPI (BLS) | 8:30 AM | Second inflation read of the week |
| Fri, Oct 16 | Monthly options expiration | All day | Can pin or accelerate moves in heavily traded names |
| Tue, Oct 20 | Netflix Q3 results | About 4:01 PM | First major consumer tech report |
| Tue to Wed, Oct 27 to 28 | FOMC meeting, decision Oct 28 | 2:00 PM on Oct 28 | Possible second rate hike in the middle of Big Tech week |
| Fri, Oct 30 | Employment Cost Index Q3 (BLS) | 8:30 AM | Wage inflation, closely watched by the Fed |
Big Tech timing. Microsoft, Alphabet, Meta, Apple, Amazon, and Tesla had not confirmed third-quarter report dates at the time of writing. Based on their usual schedules, most are expected in the last week of October or the first days of November, which could put several of them in the same week as the October 28 Fed decision. Confirm each date on the company's investor relations page as it's announced. Nvidia's fiscal quarter runs on a different schedule, and it typically reports in late November.
Week by Week: What Each Stretch Tests
A calendar is only useful if you know what question each week answers.
Oct 5 to Oct 9: the warm-up. PepsiCo and Delta are small in index weight but useful as signals. PepsiCo tells you whether consumers are still absorbing price increases in an inflationary environment. Delta tells you how an oil-sensitive business is handling fuel prices that have spent much of the quarter elevated by the Middle East conflict. TSMC's monthly sales figure on October 8 gives an early hint about AI demand a week before the full report.
Oct 12 to Oct 16: the banks and the inflation data. This is the densest week of the month. Five major banks report within about 24 hours, and September CPI lands at 8:30 AM on Wednesday, October 14, in the middle of the bank reports. That overlap matters. If CPI comes in hot, bank stocks can trade on the rate outlook rather than on their own results. TSMC reports in the early hours of Thursday, October 15, before the U.S. premarket session opens, so its numbers will be in the price of semiconductor stocks by the time you're watching. Monthly options expire Friday, October 16.
Oct 19 to Oct 23: consumer tech and the second wave. Netflix reports after the close on Tuesday, October 20. This week is usually when the reporting pace picks up across industrials, healthcare, and consumer companies, and it's often where the season's broader narrative starts to form.
Oct 26 to Oct 30: the collision week. The Fed meets October 27 and 28, and the largest technology companies are expected to report in or near the same stretch. A Fed decision at 2:00 PM on Wednesday with multiple megacap reports after the close on either side of it is the highest-risk configuration of the quarter. The Employment Cost Index on Friday, October 30 adds a wage-inflation read to close the week.
What to Watch in Bank Earnings
Bank earnings open the season for a reason: banks sit where the economy and interest rates meet. This quarter, that intersection is unusually important.
Net interest income. This is the money a bank earns on loans minus what it pays on deposits. A steeper yield curve, where long-term rates rise faster than short-term ones, tends to help. A flatter curve, where short-term rates catch up, tends to squeeze it. The curve flattened after the September hike, so the outlook for net interest income in the fourth quarter is the number traders will focus on.
Credit quality. Higher rates eventually show up as late payments on credit cards, auto loans, and commercial real estate. Watch the provisions banks set aside for future losses. A sharp increase says management sees stress coming.
Trading and investment banking. Volatile markets tend to help trading desks. A busy IPO calendar helps investment banking. Commentary about the pipeline for large listings later in the year can move Goldman Sachs and Morgan Stanley on its own.
Commentary on the economy. Bank CEOs see consumer and business spending in real time. On a day when their comments differ from what the stock market has priced, those comments can move the whole financial sector.
A useful habit: pull up the 10-year yield and the 2-year yield alongside bank stocks on October 13 and 14. If a bank beats estimates but its stock falls as short-term yields rise on CPI, the rate story is winning.
The AI Trade Faces a Different Kind of Test
The AI trade has carried a large share of index earnings growth all year. This quarter it faces two questions at once.
The first is familiar: are companies still spending heavily on AI infrastructure, and are the suppliers still getting paid? TSMC on October 15 is the earliest high-quality answer, since nearly every advanced AI chip passes through its factories.
The second question is newer. With corporate bond issuance tied to AI buildouts contributing to higher long-term yields, investors are paying closer attention to how that spending is financed and whether it produces returns fast enough to justify rising borrowing costs. A hyperscaler that raises its spending plans can see its own stock fall while its suppliers rally, a pattern covered in DayTradingToolkit's framework for how AI capex disclosures move chip and memory stocks.
If Big Tech reports land near the October 28 Fed decision, the reaction to capital spending plans will be filtered through whatever the Fed just did to rate expectations.
How to Trade Earnings Season Without Getting Run Over
Earnings season rewards preparation and punishes improvisation. A few habits separate the traders who use it well from the ones who spend it recovering from gaps.
Build the calendar into your watchlist the night before. Check which companies report before the open and after the close. A stock that reports after the close can gap 5 to 10 percent or more the next morning, and holding a position through that is a decision, not an accident. Make it deliberately.
Trade the reaction, not the report. The numbers are public the second they're released, and algorithms process them in milliseconds. Most day traders are better served by waiting for the first 15 to 30 minutes after the open and trading the direction and structure that develop, rather than guessing the report. The earnings report playbook breaks down the gap-and-go and gap-fill setups in detail.
Watch for implied volatility crush. Options prices rise before earnings because traders expect a big move. After the report, that expected volatility collapses. An options buyer can be right about direction and still lose money if the move is smaller than the options priced in.
Respect the macro overlap. On October 14, CPI hits at 8:30 AM while Bank of America and Morgan Stanley report the same morning. On a day like that, separate what's company-specific from what's rate-driven before you act. If every bank moves the same direction regardless of its own numbers, the data release is running the tape.
Look for sympathy moves. When a large company reports, its suppliers, competitors, and customers often move in the same session. TSMC's results can move semiconductor equipment makers. A big bank's credit commentary can move regional banks. A Trade Ideas scan for unusual volume and gaps across related names helps surface which stocks are actually reacting to a peer's report, rather than relying on assumptions about which ones should.
Know when the post-earnings drift is real. Stocks that surprise strongly sometimes keep moving in the same direction for days after the report, a pattern documented in academic research. Our earnings momentum strategy explains where that drift still shows up and where it has faded.

Does the "October Effect" Matter This Year?
October has a reputation. The crashes of 1929, 1987, and 2008 all had some of their worst days in October, and the month tends to be one of the more volatile of the year. But reputation and average returns are different things. October's average return for the S&P 500 is positive, and several bear markets have ended in October, including the lows of 2002 and 2022, which is why some market historians call it a "bear market killer."
The honest takeaway is the same one reached for the September effect a month earlier: seasonal averages are too noisy to trade on their own. What matters this October is the specific calendar in front of you. Earnings, CPI, and a live Fed meeting create far more concrete risk and opportunity than any historical monthly average.
Where Earnings Season Setups Go Wrong
Understanding the failure modes is as useful as understanding the setups.
Holding through a report you didn't plan for. The most common earnings-season loss comes from a position that was supposed to be a day trade and turned into an overnight hold. A missed report date or an after-hours release can turn a small winner into a large loser before the next open.
Reading the headline instead of the guidance. A company can beat on revenue and earnings and still fall hard if its forecast disappoints. In a rising-rate environment, investors care more about next quarter than last quarter.
Ignoring the macro calendar. A great report released the same morning as a hot CPI number can fall with the market. Stocks don't trade in isolation during the heaviest data weeks.
Chasing the first move. Early moves after a report often reverse as larger investors digest the conference call. The first five minutes of price action is the least reliable signal of where a stock will close.
Overtrading the calendar. With dozens of reports a day in the busiest weeks, it's tempting to trade every gap. Most traders do better focusing on a small list of liquid names with clean setups than spreading attention across every mover.
For newer traders, the beginner's guide to earnings season covers the basics of why stocks gap and how to build a simple survival plan.
How This Fits a Complete Trading Plan
Earnings season is when the market stops trading on themes and starts trading on evidence. That makes it one of the best periods of the quarter for finding stocks with real momentum behind them, and one of the most dangerous for traders who treat every report as a coin flip.
The plan for the next four weeks is simple to write down and harder to follow: know the dates, know which data lands on the same mornings, decide in advance whether you'll hold anything through a report, and let the first reaction settle before you commit. This quarter, add one more line to that plan. Check the 10-year yield before every trading day. It may explain more about how the market receives these reports than the reports themselves.
Frequently Asked Questions
When does Q3 earnings season start?
A few companies with off-calendar fiscal quarters report earlier, and PepsiCo and Delta Air Lines report on October 8 and October 9. But the big-bank reports are traditionally treated as the kickoff because they give the first broad read on the economy, credit conditions, and interest rates. The heaviest reporting weeks run from mid-October into early November.
Key Takeaway: Mark October 13 as the start of the season and plan your watchlist around the bank reports that week.
How much earnings growth is expected for Q3?
Zacks Investment Research puts the estimate closer to 23 percent, with revenue up about 11.2 percent. Both firms note that a small group of AI-exposed companies accounts for a large share of the growth. Estimates will change as the season goes on, and final growth rates often end up higher than preseason estimates because companies tend to beat lowered expectations.
Key Takeaway: Expectations are high, so the market's reaction will depend more on guidance than on whether companies beat.
Why does the 10-year Treasury yield matter for earnings season?
With the S&P 500's forward earnings yield near 5.2 percent and the 10-year yield above 5 percent, the extra return stocks offer over bonds is unusually thin. That means solid but unspectacular reports may not be rewarded, and a rise in yields on the morning of a report can weigh on the stock regardless of the numbers.
Key Takeaway: Check the 10-year yield before trading any earnings reaction this season, because it can overpower company-specific news.
What happens when CPI and bank earnings land on the same day?
On October 14, September CPI is released at 8:30 AM ET, the same morning Bank of America and Morgan Stanley report. If CPI surprises, the whole financial sector may move together. If all the banks move in the same direction regardless of their individual numbers, treat it as a macro move rather than an earnings reaction.
Key Takeaway: On overlap days, separate the data-driven move from the company-specific move before placing a trade.
When do Microsoft, Apple, Amazon, Alphabet, and Meta report Q3 earnings?
That could place several megacap reports in the same week as the Federal Reserve's October 28 decision. Companies typically announce their dates two to four weeks in advance on their investor relations sites. Because these stocks carry so much weight in the S&P 500 and Nasdaq-100, their report dates are among the most important to confirm as soon as they're published.
Key Takeaway: Check each company's investor relations page weekly and add confirmed dates to your calendar as they're announced.
Should day traders hold positions through earnings reports?
A stop order doesn't protect you from an overnight gap. If a stock closes at $100 and opens at $88 after a report, a stop at $97 fills near $88. Holding through a report is a separate decision from trading the stock during the day, and it should be sized as if the worst-case gap will happen.
Key Takeaway: Close intraday positions before a scheduled report unless holding through it is a deliberate, sized decision.
What is implied volatility crush after earnings?
Before a report, options traders pay extra because they expect a large move. Once the results are out, that premium collapses. A trader who buys calls before a report can be right about the direction and still lose money if the stock moves less than the options priced in. This is one of the most common surprises for newer options traders.
Key Takeaway: Compare the expected move priced into options with a stock's historical earnings moves before buying options into a report.
Why do bank earnings kick off earnings season?
Because banks lend to and hold deposits from almost every part of the economy, their commentary is treated as a preview of what other sectors will report. In a hiking cycle, bank results also show how rising rates are affecting both profits and borrowers.
Key Takeaway: Read bank earnings for what they reveal about the economy, not only for the banks themselves.
How does the October 28 Fed decision affect earnings season trading?
If megacap companies report around the same days, their stocks will be reacting to both their own results and the Fed's decision. That can produce sharper moves in either direction.
Key Takeaway: Reduce position size around October 28 if you're trading stocks that report the same week.
Is the October effect a reason to trade differently this month?
Seasonal patterns are averages across very different years and don't predict what any single October will do. The specific events on this year's calendar, bank earnings, CPI, TSMC, and the Fed, are far more useful for planning than the month's reputation.
Key Takeaway: Plan around the dated events on the calendar, not around the month's historical reputation.
Disclaimer
Article Sources
- U.S. Bureau of Labor Statistics: October 2026 Release Schedule - official dates for the jobs, CPI, PPI, and Employment Cost Index releases
- Federal Reserve: FOMC Meeting Calendars and Information - official October 27 to 28 meeting schedule
- Goldman Sachs: Conference Call Dates for 2026 Earnings Results - confirmed October 13 report date
- Bank of America: 2026 Financial Reporting Dates - confirmed October 14 report date and timing
- Morgan Stanley: 2026 Quarterly Investor Conference Calls - confirmed October 14 call time
- TSMC Investor Relations: Financial Calendar - confirmed October 15 earnings conference and October 8 monthly sales release
Was this helpful?
Be the first to weigh in

Written by
Kazi Mezanur RahmanFounder, independent researcher, and editor of DayTradingToolkit. A one-person publication focused on risk-first trading education and documented tool research. He trades his own capital as a retail trader and combines personal market experience with systematic primary-source research.
Keep Reading
Market Analysis & Insights
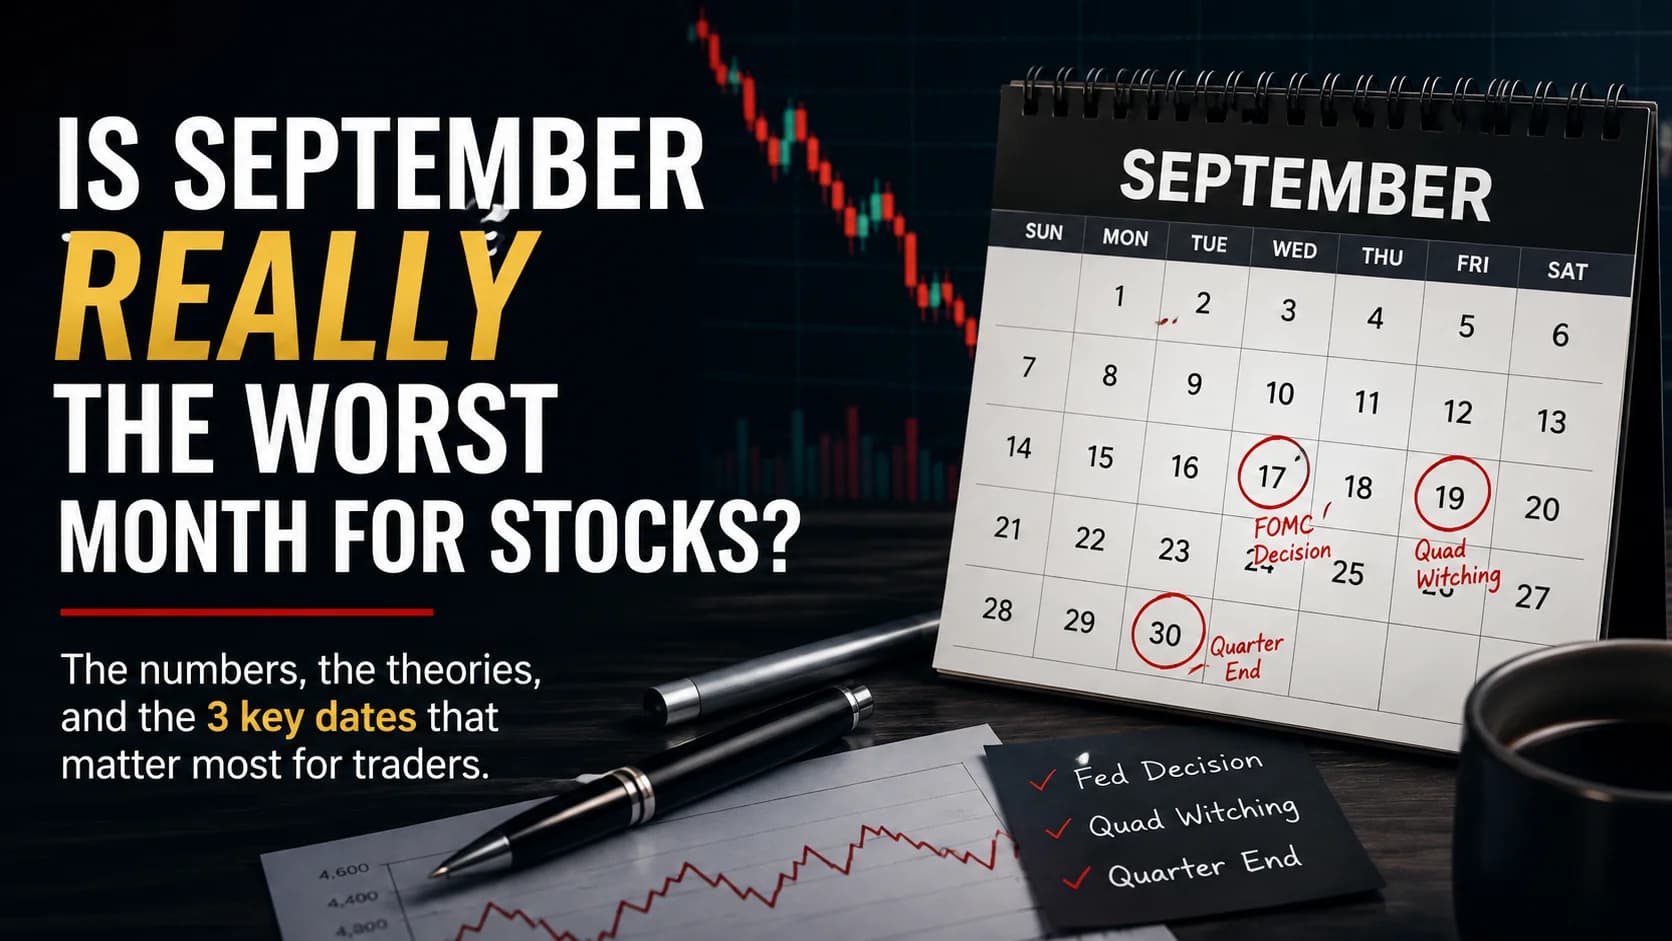
Is September Really the Worst Month for Stocks?
September has the market's worst average return, but the real story for traders this year is a Fed dot-plot meeting, quad witching, and a quarterly index rebalance all landing in the same five-day window.
Market Analysis & Insights
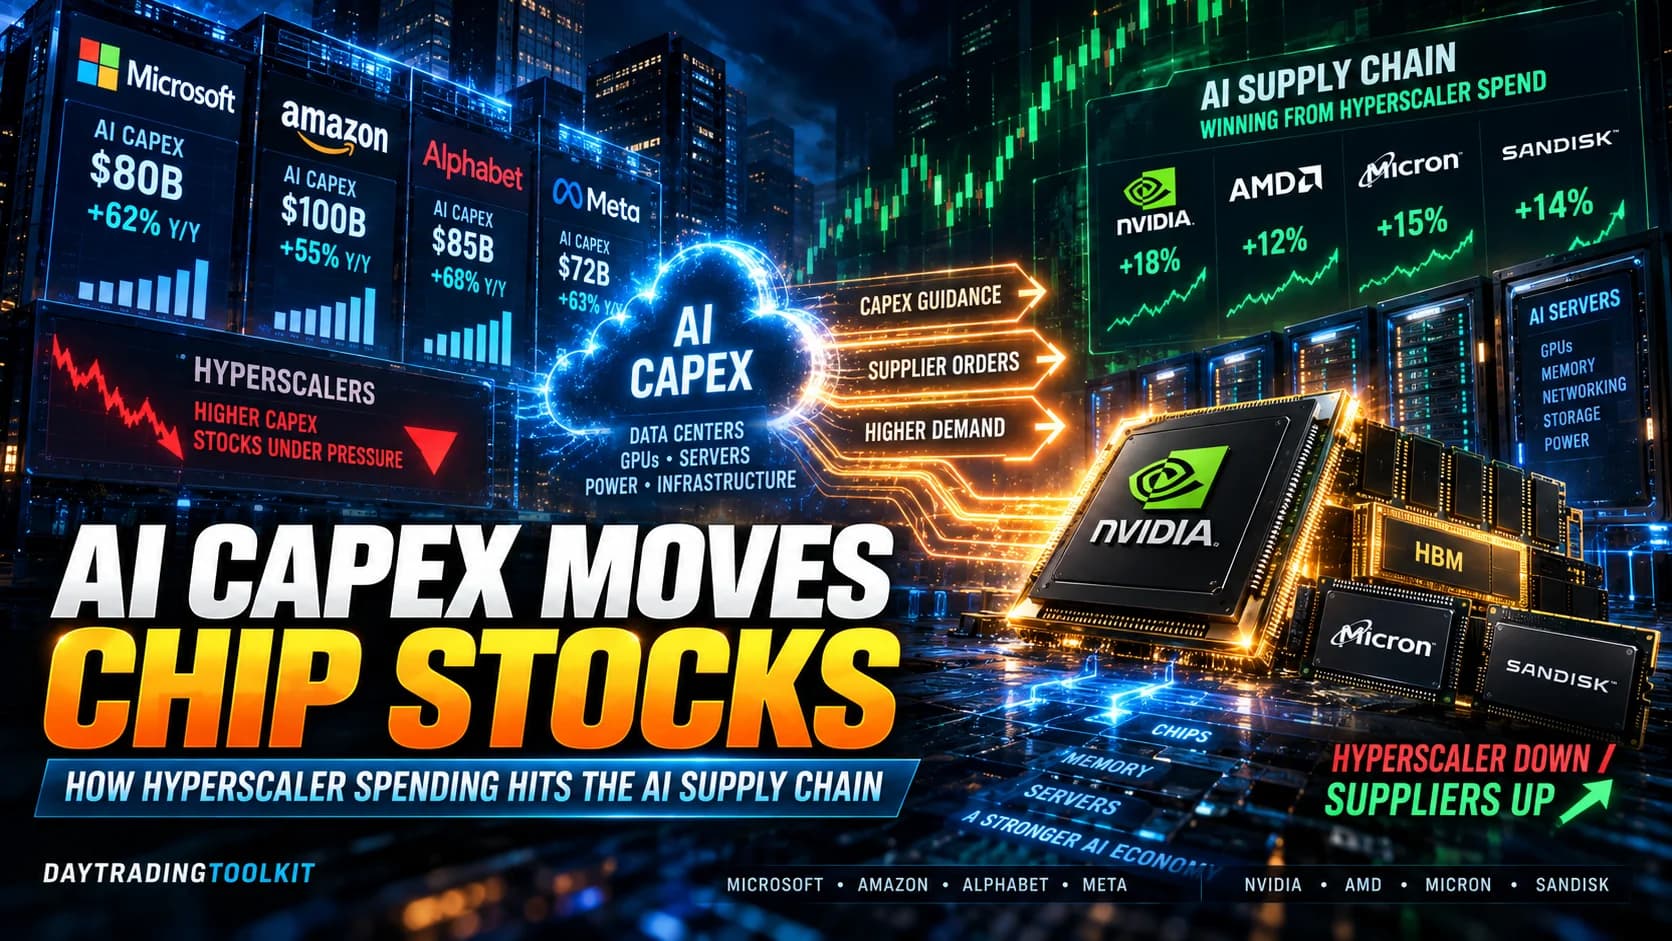
How AI Capex Disclosures Actually Move Chip and Memory Stocks
A hyperscaler's spending plan can sink its own stock and lift its suppliers on the same day. Here's the actual mechanism behind AI capex reactions, four real 2026 case studies, and how to trade the pattern.
Market Analysis & Insights
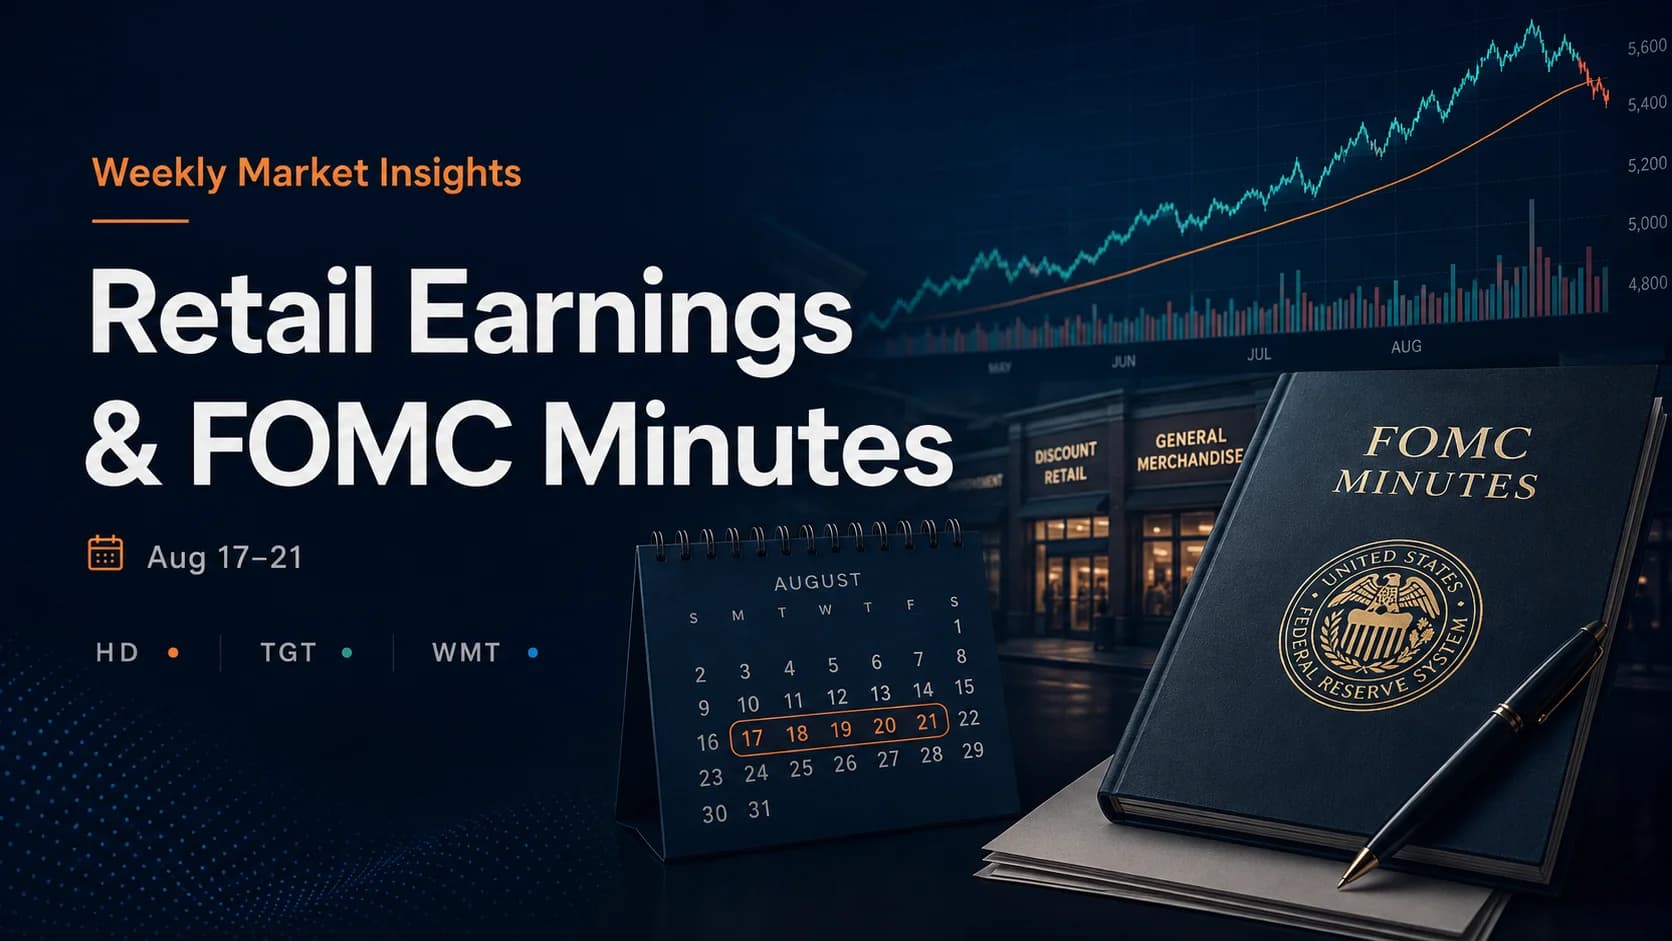
Calm Markets, Cracking Consumer: Weekly Market Insights, August 17-21
Records sit atop a divided Fed (9-3, most split since 2016), rising oil, and cracking consumer data. This week's five retail earnings, FOMC minutes, and an active Hormuz standoff will test whether the calm is justified.
Market Analysis & Insights
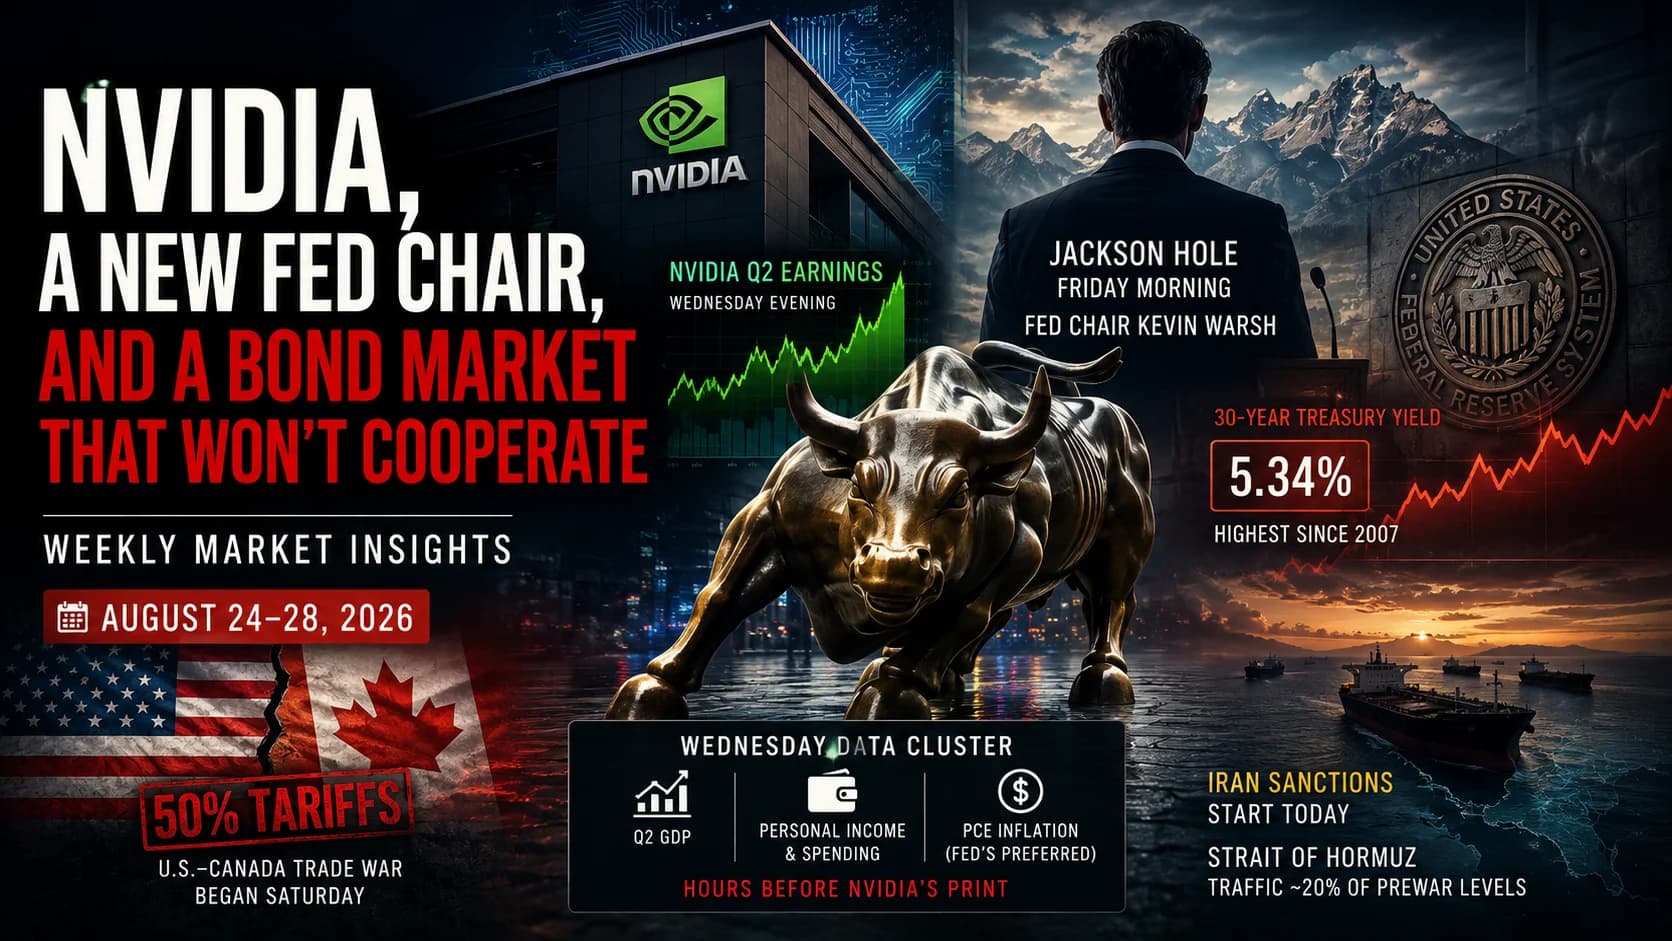
Nvidia, a New Fed Chair, and a Bond Market That Won't Cooperate: Weekly Market Insights, August 24-28
Warsh's first Jackson Hole speech, Nvidia's earnings, and fresh Iran and Canada shocks collide this week. The full Aug 24-28 catalyst map, stock watchlist, and scenario tree for traders.
Comments
No comments yet. Be the first to share your thoughts.