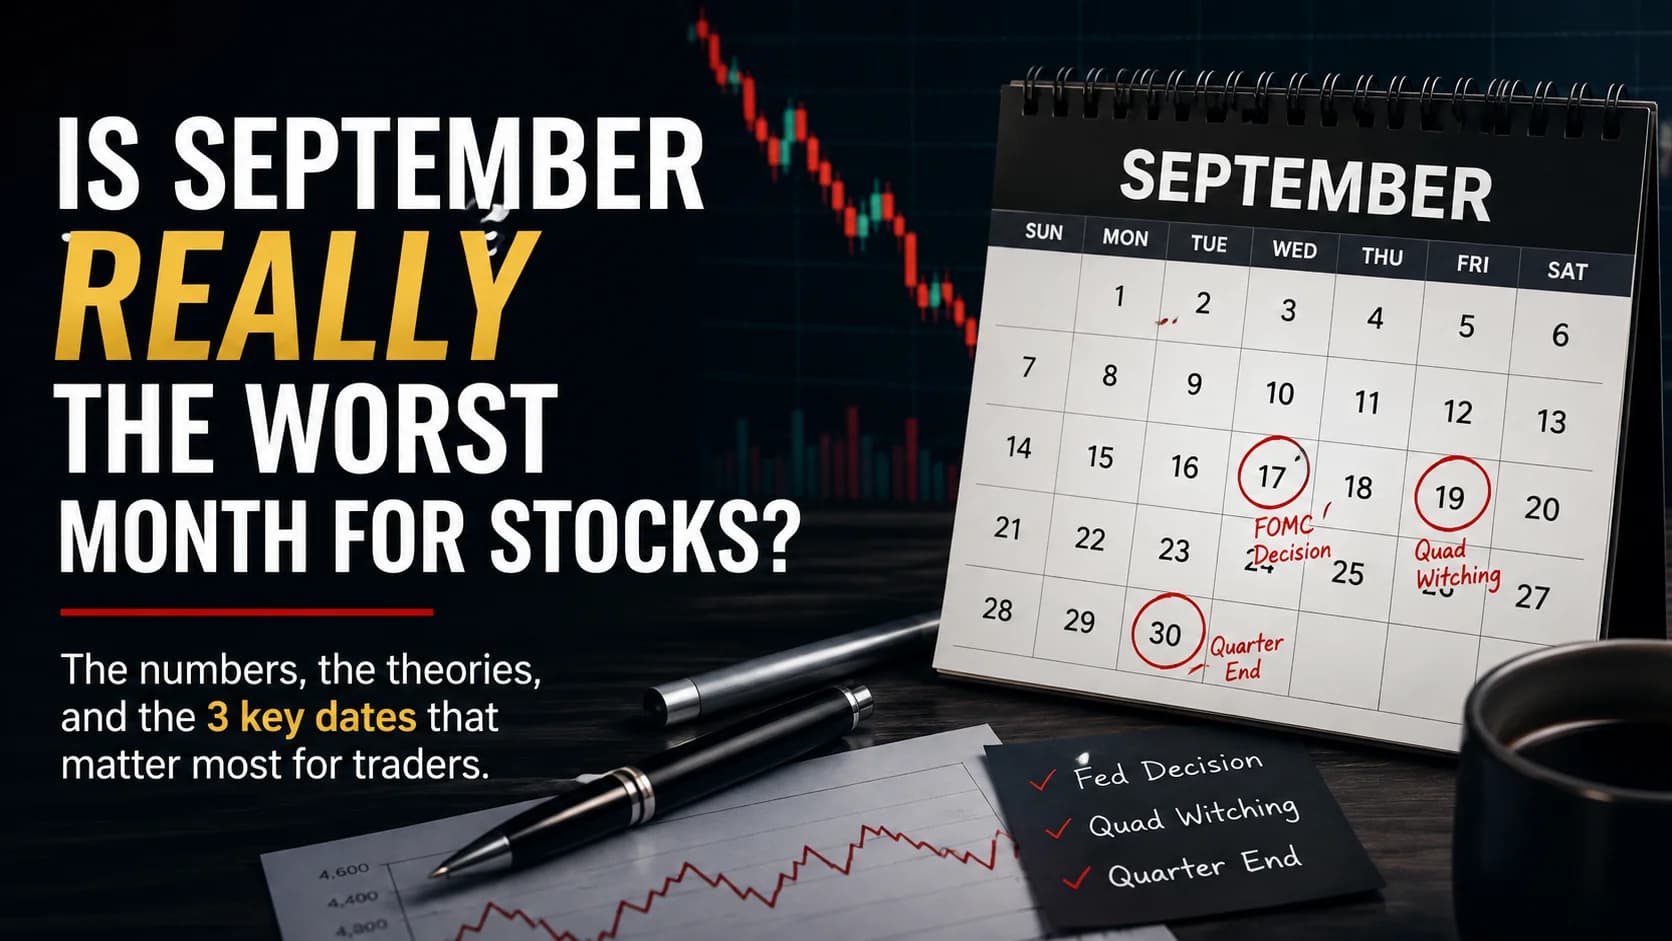
Every year around this time, the same statistic makes the rounds: September is the worst month for stocks, full stop. It's technically true. It's also close to useless for a day trader, because an average built from a century of Septembers tells you almost nothing about which specific days inside this particular September are actually going to move. This year, three of them are already on the calendar, and they matter far more than the seasonal label does.
What is the September effect? It's the well-documented tendency for major U.S. stock indexes to post their weakest average monthly returns in September, based on data stretching back to the late 1920s. The pattern is statistically real but has no single agreed-upon cause, and it says nothing reliable about how any individual September will perform.
The Numbers Behind September's Reputation
Start with what's actually documented, because the exact figure depends on which data provider and which start date you use, and a trader should know that RangeA range (or trading range) is a price zone where a stock oscillates between a defined support floor and resistance ceiling without making meaningful new highs or lows — price is consolidating rather than trending, and the dominant trade is Read definition → rather than repeating one number as gospel.
According to CME Group, the S&P 500 has finished lower in 55% of Septembers over the past century, and September is the only calendar month with a negative average return across that stretch. Other data providers tracking a slightly different window get a similar shape with different precision: some count the average loss closer to half a percent, others closer to a full percentage point, depending on whether they're measuring from 1926, 1928, or 1950 onward. What doesn't change across any of these datasets is the basic finding. Every other month of the year has averaged a positive return over the long run. September is the outlier, and it has been the outlier for essentially as long as anyone has kept reliable index data.
That reputation gets reinforced by memorable examples. The steepest single-month crash in stock market history, a decline of roughly 30%, happened in September 1931 during the Great Depression. More recently, September posted losses in each of the last several years through 2025, a streak long enough that financial media revisits the "worst month" framing every late August almost on schedule.
Why the Average Hides More Than It Reveals
Here's the part most seasonality write-ups skip, and it's the actual reason this pattern doesn't function as a trading signal by itself.
An average return includes every outlier that ever happened, and 1931's Depression-era crash is doing a lot of work in pulling that long-run average down. Strip out the small number of genuinely catastrophic Septembers, most of which occurred during pre-existing bear markets with causes that had nothing to do with the calendar, and the remaining distribution looks a lot closer to a coin flip than a curse. Independent analyses of the return distribution have found September finishes positive slightly less often than other months, but the split between up and down years is closer to even than the "worst month" headline implies.
That distinction matters enormously for how you should actually use this information. A seasonal tendency that shows up in roughly half of all instances isn't a signal you trade on directly. It's context. The mistake isn't noticing that September has a weaker track record than other months. The mistake is treating a long-run average as a forecast for this specific September, when the actual catalysts sitting on this year's calendar are going to matter far more than the month's historical reputation.
The Leading Theories, and Why None of Them Are Settled
Nobody has produced a fully satisfying explanation for why September specifically underperforms, and that uncertainty itself is worth taking seriously before you build a strategy around any single theory.
The most commonly cited explanation involves institutional behavior at quarter's end. Fund managers returning from summer often use September to reassess and rebalance portfolios, sometimes selling underperforming positions before the fiscal year-end reporting period many funds operate on. A related "back to school" theory suggests that the general return of both retail and institutional attention after a quieter summer period brings a wave of profit-taking and repositioning that a slower August didn't generate. Tax-related selling gets mentioned too, though the more commonly cited version of that effect concentrates later in the year, closer to December, rather than in September specifically.
None of these theories has been proven as the definitive cause, and multiple analysts covering this exact question over multiple decades have concluded that the honest answer is that no one fully knows. That's a genuinely different claim from "there's no pattern at all." The pattern in the data is real. The explanation for it remains contested.
The Three Dates on This September's Calendar That Actually Matter
This is where seasonality stops being trivia and starts being something you can actually plan around, because this particular September isn't a generic instance of the pattern. It has three specific structural events landing inside a five trading day window, and this site's full breakdown of how those three events interact is worth reading in full if you haven't already. The short version below is the part that connects directly to the seasonality question this article is actually answering.
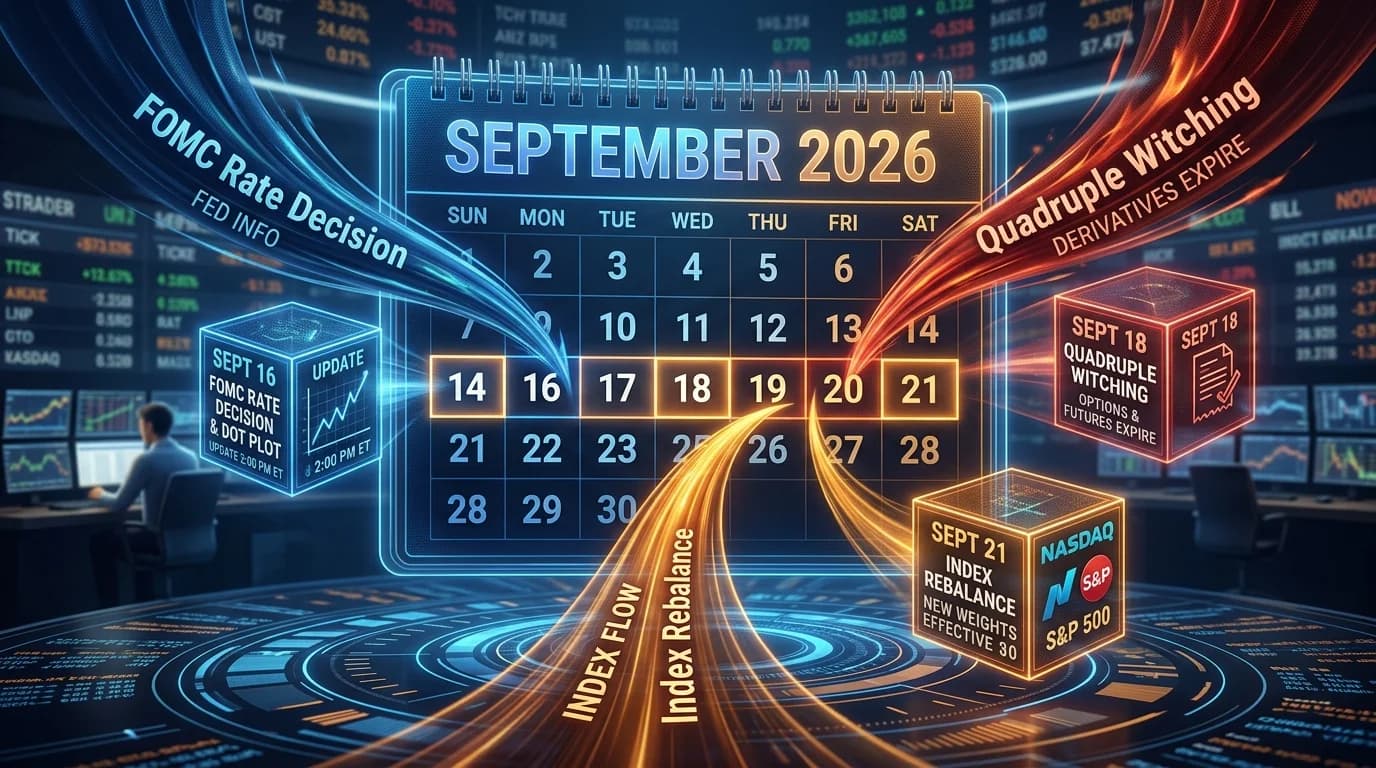
The Federal Reserve's Open Market Committee meets September 15 and 16, with the rate decision landing at 2:00 PM ET on the 16th. This is one of four meetings per year, alongside March, June, and December, that includes the Summary of Economic Projections, the so-called dot plot showing where individual Fed officials expect rates to land. Dot plot meetings have historically produced larger intraday volatility than the four meetings that don't include fresh projections, simply because there's more new information for the market to digest beyond the headline rate decision itself.
Two days later, on September 18, the market hits quadruple witching, the quarterly expiration of stock index futures, stock index options, and single-stock options all landing on the same session. Quad witching sessions reliably produce some of the highest trading VolumeVolume is the total number of shares (or contracts) traded during a given time period — it's the primary confirmation tool for all price action, because a price move accompanied by high volume indicates genuine market participation, while tRead definition → of the entire quarter, concentrated heavily in the final hour as market makers unwind hedges and funds roll expiring positions into new contracts.
The same week brings the Nasdaq-100 and S&P 500 quarterly rebalance, which forces index funds to adjust their holdings to match updated index weightings, adding another layer of mechanical, price-insensitive trading volume on top of an already busy stretch.
Three structurally significant events inside five trading days is not typical even for a month with September's reputation. That concentration, not the calendar page it happens to fall on, is what actually deserves a trader's attention this year.
What Actually Tends to Move Around a Dot Plot Meeting
The FOMCThe Federal Open Market Committee (FOMC) is the Federal Reserve committee that sets U.S. monetary policy — most importantly, the target federal funds rate — at eight scheduled meetings per year.Read definition →'s rate decision itself often isn't the volatility driver traders expect. When a rate move is already well anticipated by futures markets ahead of the meeting, the announcement itself can be a non-event. The dot plot and the chair's press conference, both arriving in the thirty minutes after the 2:00 PM statement, have a longer track record of moving markets, because they reveal the committee's actual internal disagreement and forward GuidanceGuidance is forward-looking financial projections that a company's management provides for upcoming periods — typically covering expected revenue, earnings, or margins — and the market's reaction is often driven more by guidance than by theRead definition → rather than confirming a rate path the market had already priced in. The mechanics of trading a Fed decision day in more depth are covered in this site's FOMC-focused reporting, including how meeting frequency itself has become a live policy question this year. It's also worth remembering that this specific Fed chair's public remarks have moved markets before this cycle even reached September; the Jackson Hole preview covered on this site is useful background on how this Fed communicates under pressure.
What Actually Tends to Move Around Quad Witching
Quad witching's reputation for chaos is a little overstated relative to how it actually trades in practice. Regulatory changes over the past decade have smoothed out some of the wilder swings that used to characterize these sessions. What remains reliable is the volume spike itself, particularly in the closing auction, where the mechanical unwinding of expiring options and futures positions concentrates enormous order flow into a short window. This site's detailed look at index rebalancing and closing auction volatility covers exactly this mechanic, including why forced buying and selling around events like this doesn't reliably produce the directional move newer traders sometimes expect.
Is There an Actual Tradeable Edge Here?
Be honest about what the data supports and what it doesn't. A roughly coin-flip distribution of outcomes across nearly a century of Septembers is not evidence of an exploitable directional edge, and any strategy claiming to reliably profit from "shorting September" deserves real skepticism. What the data does SupportSupport is a price level where buying pressure has historically overcome selling pressure, causing price to stop declining and reverse — it's the floor where demand enters the market, and when it holds, it's a potential long entry; when it Read definition → is a case for elevated attention rather than elevated conviction: a month with a documented history of weaker average returns, layered on top of a specific week with three genuine structural catalysts, is a reasonable time to tighten risk management and expect wider-than-normal ranges, not a reasonable time to place a directional bet purely on the calendar.
The FOMC decision, quad witching, and the quarterly rebalance are each individually well-documented sources of short-term volatility regardless of what month they occur in. This year, they happen to cluster inside a month that already carries a seasonal reputation, and that clustering is the genuinely useful, non-generic insight here, not the seasonality statistic on its own.
How to Actually Prepare for This September
Widen your expectations for range, not necessarily your directional conviction. A week carrying a dot plot Fed meeting, a quad witching session, and a quarterly index rebalance is statistically likely to see larger daily ranges than an average week, independent of whatever the month's historical batting average happens to be.
Mark the specific dates rather than relying on "sometime in September" as a mental placeholder. September 16 for the Fed decision, September 18 for quad witching and the rebalance effective date. Build your position sizing and risk plan around those two sessions specifically rather than treating the whole month as uniformly dangerous.
Watch for volume and volatility expansion as your actual confirmation signal, not the calendar date itself. A scanner that flags unusual relative volume and volatility compression or expansion across your watchlist in real time is far more useful heading into a week like this than reacting to headlines about September's reputation after the fact. Trade Ideas is built around exactly that kind of real-time scanning, letting you set alerts for the specific volume and volatility signatures that tend to show up ahead of high-catalyst sessions like these, rather than trying to manually track three separate structural events on top of your normal day trading routine. This site's market insights coverage will keep tracking all three events as they approach and follow up with what actually happened once the week is over.
Frequently Asked Questions
Is September actually the worst month for the stock market?
That said, "worst on average" is a different claim than "reliably negative." Independent analyses of the actual year-by-year distribution show September finishing positive nearly as often as it finishes negative, closer to a coin flip than the "worst month" framing suggests. The negative average is heavily influenced by a small number of severe outlier years, including the 1931 Great Depression crash.
Key Takeaway: September's average return is genuinely the weakest of any month, but that doesn't mean this particular September is more likely than not to be negative.
Why does September underperform other months?
Researchers and market analysts have studied this question for decades without reaching a consensus explanation. Some point to fund managers reassessing positions ahead of fiscal year-end reporting. Others point to a psychological "back to school" shift in market attention. The honest state of the research is that the pattern is well documented, but its cause remains genuinely contested.
Key Takeaway: Don't anchor a trading decision to any single explanation for the September effect, since none of them has been proven as the actual mechanism.
What's actually different about this September compared to a typical one?
That concentration of catalysts is unusual even relative to other Septembers, since these three event types don't always land this close together. The full mechanics of how they interact are covered here.
Key Takeaway: This year's elevated volatility risk comes from the specific calendar clustering, not from September's general seasonal reputation.
Does the Fed meeting or quad witching matter more for volatility?
The Fed meeting tends to drive the larger directional moves, particularly around the dot plot and press conference, since it reveals genuinely new information about the committee's forward outlook. Quad witching tends to drive volume and short-term price dislocation rather than sustained directional moves, concentrated heavily in the final trading hour as expiring contracts get unwound.
Key Takeaway: Prepare for a directional catalyst around the Fed decision and a volume and liquidity event around quad witching. They're not the same kind of risk.
Is there a reliable trading strategy based on the September effect alone?
Any approach claiming to reliably profit from shorting September, or from any single-month seasonal pattern in isolation, is overstating what the underlying data actually supports. The more defensible approach is using the seasonal context to inform risk management and expected volatility, not to establish a directional bias.
Key Takeaway: Treat September's reputation as a reason to tighten risk controls, not a reason to take a directional position.
How does the Nasdaq-100 and S&P 500 quarterly rebalance affect individual stocks?
This mechanical flow can create short-term price dislocation in the affected names, though it doesn't reliably produce a sustained directional move once the rebalancing flow is complete. The detailed mechanics of this exact process are covered separately on this site.
Key Takeaway: Individual stocks affected by the rebalance can see real short-term volatility that has nothing to do with their underlying fundamentals.
Should I reduce my position sizes heading into this stretch of September?
Wider expected ranges around a Fed decision, a quad witching session, and a quarterly rebalance are well documented independent of the month they occur in. Traders who don't adjust position sizing for known higher-volatility windows tend to get caught by exactly this kind of stacked-catalyst week.
Key Takeaway: Adjust risk parameters based on the specific catalysts in front of you this week, not based on the calendar month alone.
Does the September effect apply to individual stocks the same way it applies to the indexes?
Some sectors and individual names show more pronounced seasonal patterns than others, and a stock with its own company-specific catalyst, like an earnings report or FDA decision, will generally be driven far more by that specific event than by the broader index's seasonal tendency.
Key Takeaway: Don't assume a specific stock will follow the broad index's seasonal pattern without its own supporting catalyst.
Disclaimer
Article Sources
- CME Group: Three Reasons for the "September Effect" in Stocks - exchange data on September's historical decline rate and the leading theories behind itcmegroup.com
- Federal Reserve: FOMC meeting calendars, statements, and minutes - official schedule confirming the September 15 to 16, 2026 meeting dates and which meetings include the Summary of Economic Projectionsfederalreserve.gov
- Nasdaq, Inc.: Nasdaq-100 Index Methodology - primary documentation on quarterly rebalance and reconstitution mechanicsindexes.nasdaq.com
- Britannica Money: Triple Witching Day - reference explainer on witching mechanics and historical contextbritannica.com