
How Midterm Elections Move the Stock Market: A Day Trader's Guide

In this article9 sections
On Wednesday, November 9, 2022, the morning after that year's midterm elections, the Dow fell more than 600 points. Control of Congress was still undecided, and a crypto selloff was spreading. The next morning, the October CPI report came in cooler than expected, and the S&P 500 jumped about 5.5 percent in a single session, one of its best days in years.
The election had been the most-discussed event on the calendar for months. It ended up as a footnote to an inflation report.
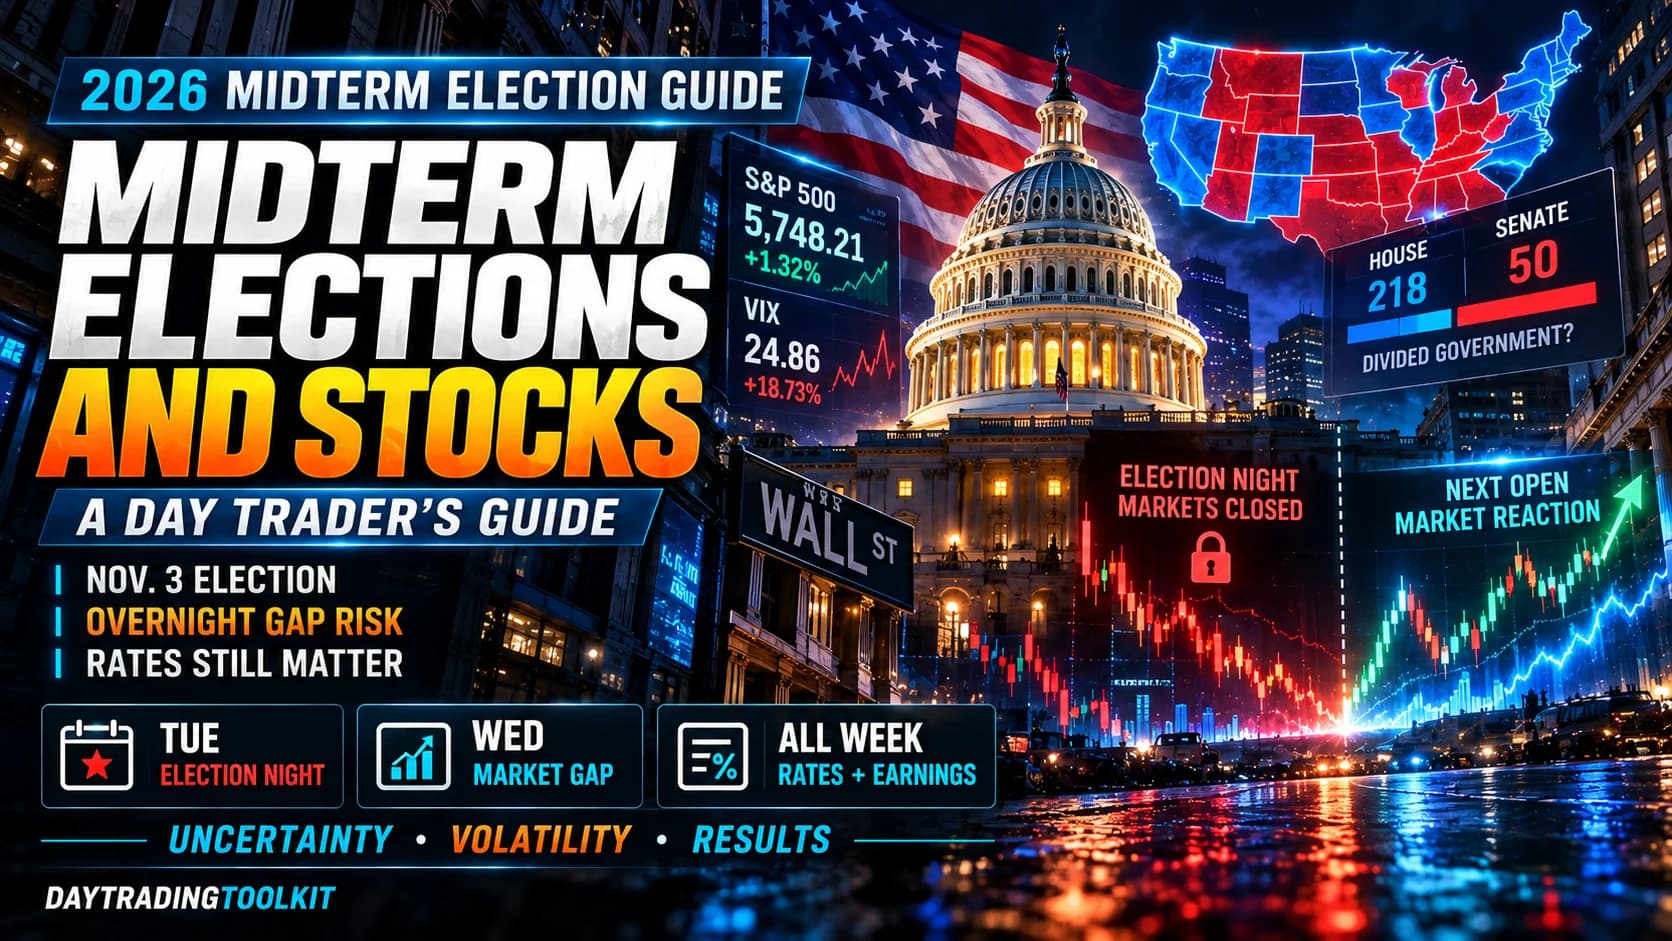
That's the most useful lesson about midterm elections for a day trader: they matter, but usually less, and differently, than the headlines suggest. The 2026 midterms land on Tuesday, November 3, in the middle of a Fed hiking cycle, with the 10-year Treasury yield above 5 percent and earnings season still running. This guide covers what history actually shows about midterms and stocks, why the patterns exist, what's different this year, and how to handle the overnight gap that election results can create.
What is the midterm election effect? The midterm election effect is the historical tendency for U.S. stocks to be weaker and more volatile in the months before a midterm election, then stronger in the months after it. The usual explanation is uncertainty: markets dislike not knowing which party will control Congress, and that uncertainty resolves once results are in.
What History Shows About Midterm Years
The data on midterm years is consistent in direction and much less consistent in size. Here's what several major research firms have found, using different time periods and methods.
- Measure
- Average S&P 500 return in midterm years
- Finding
- About 5 percent since 1950, the weakest of the four-year presidential cycle
- Source
- Fidelity, Haver Analytics
- Measure
- Average peak-to-trough decline during midterm years
- Finding
- About 19 percent since 1961
- Source
- Fidelity
- Measure
- Return in the 12 months after midterms
- Finding
- Positive about 95 percent of the time since 1938, averaging about 14 percent
- Source
- Fidelity
- Measure
- Return in the six months after midterms
- Finding
- Positive in all 13 midterms since 1974, averaging 12.4 percent
- Source
- Charles Schwab
- Measure
- Pre-election rally
- Finding
- Stocks historically rallied in roughly the final month before a midterm
- Source
- BlackRock, citing Bloomberg data
| Measure | Finding | Source |
|---|---|---|
| Average S&P 500 return in midterm years | About 5 percent since 1950, the weakest of the four-year presidential cycle | Fidelity, Haver Analytics |
| Average peak-to-trough decline during midterm years | About 19 percent since 1961 | Fidelity |
| Return in the 12 months after midterms | Positive about 95 percent of the time since 1938, averaging about 14 percent | Fidelity |
| Return in the six months after midterms | Positive in all 13 midterms since 1974, averaging 12.4 percent | Charles Schwab |
| Pre-election rally | Stocks historically rallied in roughly the final month before a midterm | BlackRock, citing Bloomberg data |
Those are striking numbers, and they're the ones you'll see repeated in market commentary every midterm year. But they come with a caveat that most coverage skips.
When U.S. Bank's asset management group studied 31 midterm elections from 1900 through 2025, it found that the average return in the 12 months before a midterm was 2.9 percent, below the 8.9 percent average for all years, and the average in the 12 months after was 12.4 percent. Then it ran statistical tests and found that midterm elections did not consistently change returns in a statistically meaningful way. Eleven of the weak midterm years coincided with inflation shocks, rising rates, wars, or financial crises that would have hit stocks regardless of the election.
That's the honest framing. The pattern is real in the averages. It is not reliable enough to trade on by itself.
Why the Pattern Exists
Three mechanisms explain most of the midterm effect, and knowing them matters more than memorizing the averages.
Uncertainty resolution. Before an election, investors can't be sure which party will control the House and Senate, and therefore can't be sure which tax, spending, and regulatory policies will move forward. Uncertainty makes investors demand a higher return for holding stocks, which pushes prices down. Once results are known, even an outcome investors didn't want removes the uncertainty. Think of it like the moment before a large earnings report: the waiting is often worse for the stock than the news.
Gridlock expectations. Historically, the president's party usually loses seats in midterm elections. Charles Schwab notes that the president's party has gained House seats in only three midterms since 1906. A divided government tends to pass less major legislation, which markets often read as fewer surprises. Whether that's good or bad policy is a separate question. For market pricing, fewer surprises usually means lower volatility.
The policy calendar. Administrations often push their most ambitious and contested policies in the first two years of a term. By the third year, with another election approaching, the policy focus tends to shift toward the economy. That's part of why the year after a midterm has historically been one of the strongest in the four-year cycle.
None of those mechanisms is guaranteed to work in any given year. All three depend on the election being the main source of uncertainty in the market. That condition is worth checking before you assume the pattern applies.
What's Different About the 2026 Midterms
This year's election doesn't arrive in a vacuum, and several conditions could overwhelm the usual midterm pattern in either direction.
The Fed is hiking, not cutting. The Federal Reserve raised its benchmark rate on September 16 to a range of 3.75 to 4.00 percent, its first hike since 2023, and markets have priced a high probability of another hike at the October 27 to 28 meeting. The 10-year Treasury yield hit 5.10 percent on September 23, its highest since 2007. Rate expectations are likely to move stocks more than election results in the weeks around November 3. Our guide to the 10-year yield explains why.
The market already had its midterm-year correction, sort of. Fidelity noted that the S&P 500's peak-to-trough decline earlier in 2026 was about 9 percent, well below the 19 percent midterm-year average. That could mean the typical midterm-year drawdown has already happened in smaller form, or that the market hasn't yet had one. Neither reading is certain.
Congress is closely divided. According to Charles Schwab's August analysis, Republicans held a 220 to 215 House majority and a 53 to 47 Senate majority heading into the fall. With margins that narrow, small shifts in a handful of competitive races can change control of either chamber, which means results may take longer than a single night to become clear.
Earnings season and the election overlap. The largest technology companies typically report in late October and early November. Several megacap reports could land within days of the election. The Q3 earnings season calendar tracks confirmed dates as they're announced.
Energy and geopolitics are still live. Oil prices tied to the Middle East conflict have driven much of 2026's inflation story. A change in that conflict could move markets more than any election outcome.
A crowded IPO calendar. The Wall Street Journal reported on September 18 that Anthropic's planned IPO is now targeting November, which could put it close to Election Day, pending its public filing. DayTradingToolkit's Anthropic IPO guide covers what to watch. A mega-IPO pulling capital from the rest of the market near Election Day adds another variable that has nothing to do with politics.
What Happens on Election Night and the Morning After
For a day trader, the most practical question isn't what happens over six months. It's what happens between the 4:00 PM ET close on Tuesday, November 3, and the 9:30 AM ET open on Wednesday, November 4.
Results arrive while the stock market is closed. Polls close in waves starting in the early evening Eastern time, and the most consequential races can take hours or days to call. S&P 500 and Nasdaq-100 futures trade overnight, so the first reaction to results shows up there. By the morning, the market will have priced whatever became clear overnight.
The gap is the trade, and it's already happened. If results are clear by morning, the stock market often opens with a gap in the direction of the market's read of the outcome. On November 7, 2018, the day after that year's midterms, the S&P 500 rose about 2 percent as a divided Congress became clear. In 2022, when control of the House remained uncertain for days, stocks fell the day after the election and then surged on the next day's inflation report. The difference between those two mornings wasn't the party that won. It was whether the result was clear and what else was on the calendar.
Uncalled races extend the uncertainty. If control of either chamber depends on races that take days to count, the "uncertainty resolution" rally can be delayed. A partial result can produce a choppy, low-conviction session rather than a clean trend.
Options pricing tells you what's expected. SPX options with daily expirations let you see how large a move the options market is pricing for November 4. The simple method: add the price of the at-the-money call and put expiring that day, and divide by the index level. That gives you the approximate expected move. In late September, reports noted that VIX futures for the October and November contracts were trading above the spot VIX, a sign that traders were already paying up for protection around the election window.
Which Sectors React to Midterm Results
Election outcomes tend to hit sectors where policy is actively debated, rather than the whole market evenly. The specific sectors change from cycle to cycle depending on what's at stake, but a few groups are sensitive in almost every election.
Healthcare and pharmaceuticals. Drug pricing and insurance policy come up in nearly every election cycle. BlackRock's analysis, citing Bloomberg data, found healthcare was the best-performing sector on average around midterms, with an average return of 10.7 percent.
Energy. Energy policy, drilling permits, and clean energy incentives can move oil, gas, and renewable stocks in opposite directions depending on the outcome. The same BlackRock analysis found energy averaged 8.9 percent.
Financials and industrials. These were the weakest sectors on average in the same data, at negative 0.6 percent and 0.6 percent respectively, possibly reflecting their sensitivity to regulation and government spending.
Defense, infrastructure, and sectors tied to government contracts. Spending priorities differ between parties, and a change in control of either chamber can shift expectations for budget fights and funding deadlines. The current government funding measure runs through December 11, so budget negotiations will follow the election closely.
AI and technology regulation. BlackRock noted polling showing more voters viewing AI negatively than positively, making AI regulation a possible issue for the next Congress. How much that affects AI stocks will depend more on what Congress actually does than on campaign talk.
Sector averages across a dozen elections are thin evidence. Use them as a list of places to look on November 4, not as a list of trades to put on before November 3. A Trade Ideas scan for gaps and unusual premarket volume across these sectors on the morning after the election can show you which groups the market is actually repricing, rather than which ones commentators expected to move.

How to Prepare as a Day Trader
The goal around an election is not to predict the result. It's to avoid being caught in a gap you didn't plan for and to be ready to trade the reaction once it's clear.
Decide what you're holding overnight on November 3. Any position held through the close on Election Day is exposed to an overnight gap that no stop order can protect against. If you're a day trader, the simplest approach is to be flat or small at the close. If you do hold, size the position as if the worst-case gap will happen.
Check the expected move before the close. Use the SPX straddle method above to see what the options market is pricing. If the expected move is larger than usual, expect a wider opening range and wider stops on November 4.
Watch the futures overnight, but don't trade headlines at 11 PM. Overnight futures are thin, and early results can mislead. The morning's premarket session usually gives a cleaner picture of what's been priced in.
Wait for the opening range. On a gap day, the first 15 to 30 minutes often determine whether the gap holds or fills. The playbook for day trading in a high-VIX market covers how to adjust position size, stops, and targets when volatility spikes.
Keep the rest of the calendar in view. The October jobs report typically lands on the first Friday of November, and megacap earnings could fall the same week. An election result can be overwhelmed by a data release within 48 hours, as it was in 2022.
Separate prediction markets from stock markets. Election betting markets can give a real-time read on expected outcomes, but they're a different product with their own regulatory questions. Our guide to prediction markets and CFTC event contracts covers what's tradable and the risks involved. The stock market's reaction depends on what was already priced in, not only on who wins.
Where the Midterm Playbook Goes Wrong
The midterm pattern is appealing because it's simple. That's exactly why it gets misused.
Treating averages as forecasts. An average return of 12 to 14 percent in the year after midterms includes years with very different outcomes. U.S. Bank's statistical tests found the effect wasn't reliable enough to be significant. An average is not a prediction for any single year.
Ignoring the macro backdrop. In 2022, the midterm-year decline was driven mostly by inflation and aggressive Fed hikes, not by politics. In 2026, a similar hiking cycle is underway. Rates, inflation, and energy could matter more than the election.
Trading your own political views. Traders who position based on which outcome they prefer, rather than on what's priced in, tend to overreact to results that match or clash with their expectations. BlackRock's hypothetical example of a $100,000 S&P 500 investment from 2013 into 2026 found that moving to cash whenever a preferred party was out of power left an investor with roughly half the ending balance of simply staying invested. The market doesn't care which party you support.
Assuming a clear result by Wednesday morning. Close races, recounts, and runoffs can leave control of Congress undecided for days. A plan that depends on a clean result on November 4 can fail even if you correctly guessed who would win.
Chasing the first post-election move. Gaps on the morning after an election can reverse as the market digests close races and turns back to rates and earnings. The first move is information, not a guarantee of direction.
How This Fits a Complete Trading Plan
Midterm elections belong on your calendar as a scheduled volatility event, in the same category as a Fed decision or a major data release. They can widen ranges, create overnight gaps, and move specific sectors. What they rarely do is override the forces that are already driving the market.
This year, those forces are rates, inflation, and earnings. The most practical plan for the first week of November is to know your overnight exposure on November 3, measure the expected move before the close, trade the reaction rather than the forecast, and keep one eye on the bond market the whole time. The election will resolve one source of uncertainty. It won't resolve the others.
Frequently Asked Questions
How do midterm elections affect the stock market?
Fidelity found that the S&P 500 has posted gains in the 12 months after midterms about 95 percent of the time since 1938, averaging about 14 percent. But U.S. Bank's statistical analysis of 31 midterms found the effect wasn't consistent enough to be statistically significant, and many weak midterm years coincided with inflation, rate hikes, or crises that had nothing to do with the election.
Key Takeaway: The midterm pattern exists in the averages, but other forces often matter more in any given year.
When are the 2026 midterm elections?
Results begin arriving after polls close in the evening Eastern time, while the stock market is closed. Futures trade overnight, so the first market reaction appears there, and the stock market's first full-session reaction comes at the 9:30 AM ET open on Wednesday, November 4.
Key Takeaway: Plan your overnight exposure for the close on November 3, since results arrive after the market closes.
Do stocks go up after midterm elections?
That record is consistent, but it covers a small number of elections, and each took place in a different economic environment. The gains also reflect other factors, including the Fed, earnings, and the business cycle, which aren't caused by the election. Past post-midterm rallies don't guarantee one this year.
Key Takeaway: Post-midterm strength is a historical tendency, not a promise, and it depends heavily on the rate and earnings backdrop.
Why is the stock market often volatile before midterm elections?
Fidelity found the average peak-to-trough decline during midterm years since 1961 has been about 19 percent. Much of that volatility tends to fade once results are known, which is why the months after the election have historically been calmer and stronger.
Key Takeaway: Pre-election volatility is largely about uncertainty, which is why it tends to ease once results are clear.
What happened to stocks the day after the 2022 midterm elections?
The next morning, November 10, a cooler-than-expected CPI report sent the S&P 500 up about 5.5 percent, one of its best days in years. The election's effect was quickly overwhelmed by inflation data, which was the market's main concern at the time.
Key Takeaway: In a rate-driven market, a major data release can matter far more than an election result, even in the same week.
Which sectors are most affected by midterm election results?
BlackRock's analysis, citing Bloomberg data, found healthcare and energy were the best-performing sectors on average around midterms, while financials and industrials were the weakest. These averages cover a limited number of elections and shouldn't be treated as predictions.
Key Takeaway: Use sector history as a watchlist for the morning after the election, not as a set of trades to place before it.
Should day traders hold positions overnight on Election Day?
A stop-loss order doesn't protect against an overnight gap. If you choose to hold, size the position assuming the worst-case gap happens. Most day traders are better off being flat at the close on November 3 and trading the reaction once the market opens on November 4.
Key Takeaway: Treat the close on Election Day like the close before a major earnings report: decide your exposure deliberately.
How can I tell how big a move the market expects after the election?
If that expected move is larger than a typical day's range, plan for a wider opening range and wider stops on November 4. You can also compare the VIX futures for October and November with the spot VIX. When the later contracts trade higher, traders are paying extra for protection around the election window.
Key Takeaway: Measure the expected move before the close on November 3 so you know what counts as a surprise the next morning.
Does a divided government help the stock market?
BlackRock's analysis found the six months after midterms averaged 14.1 percent returns overall, with somewhat higher average returns when control was gained or remained divided. The effect is modest and inconsistent, and the broader economy, interest rates, and earnings have always mattered more than the balance of power in Congress.
Key Takeaway: Divided government has historically been associated with fewer surprises, but it's not a reliable trading signal on its own.
Will the Fed or the election matter more for stocks this fall?
Elections resolve one source of uncertainty. Rate hikes affect every company's borrowing costs and every stock's valuation. In 2022, a similar hiking cycle drove most of the midterm year's decline, and inflation data overwhelmed the election reaction within a day.
Key Takeaway: Watch rates and inflation data at least as closely as election results in the weeks around November 3.
Disclaimer
Article Sources
- Fidelity: How might midterm elections impact the stock market? - midterm-year returns, drawdowns, and post-election performance since 1938
- U.S. Bank: How midterm elections affect the stock market - 31-election study and statistical significance testing
- Charles Schwab: What the 2026 Midterms Could Mean for the Markets - election date, congressional balance, and post-election returns since 1974
- BlackRock: Midterm Elections and Stock Market Trends - sector performance and pre-election rally data
- CNBC: Dow closes more than 600 points lower after indecisive midterms - the market reaction on November 9, 2022
- Yahoo Finance: Stocks stage blowout rally after milder CPI print - the November 10, 2022 CPI rally
Was this helpful?
Be the first to weigh in

Written by
Kazi Mezanur RahmanFounder, independent researcher, and editor of DayTradingToolkit. A one-person publication focused on risk-first trading education and documented tool research. He trades his own capital as a retail trader and combines personal market experience with systematic primary-source research.
Keep Reading
Market Analysis & Insights
Anthropic's IPO: How Day Traders Should Prepare
Anthropic filed confidentially for an IPO at a $965 billion valuation. Here's the Nasdaq-100 fast entry rule, the lockup calendar, and the options timeline day traders should map out before it lists.
Market Analysis & Insights
Nvidia, a New Fed Chair, and a Bond Market That Won't Cooperate: Weekly Market Insights, August 24-28
Warsh's first Jackson Hole speech, Nvidia's earnings, and fresh Iran and Canada shocks collide this week. The full Aug 24-28 catalyst map, stock watchlist, and scenario tree for traders.

Market Analysis & Insights
Two Wars, a Trade Fight, and CPI Still Has to Land Clean: Weekly Market Insights, September 7-11
A blowout jobs report already pushed rate-hike odds above 58%. Now a widening Middle East war and a new US-Canada trade fight collide with the last inflation data before the Fed's September 15-16 decision, while Nokia, Compass Pathways, Qualcomm, and Amgen all move on stories the calendar never saw coming.
Market Analysis & Insights
Warsh Wants Fewer Fed Meetings: What Changes for Traders
Fed Chair Kevin Warsh is exploring cutting FOMC meetings from eight a year to as few as five or six. Here's what's actually been proposed, the history behind the eight-meeting standard, and what wider gaps between Fed decisions would mean for your trading calendar.
Comments
No comments yet. Be the first to share your thoughts.