

Two stocks both poke a penny above their morning RangeA range (or trading range) is a price zone where a stock oscillates between a defined support floor and resistance ceiling without making meaningful new highs or lows — price is consolidating rather than trending, and the dominant trade is Read definition → at 10:20 AM ET. Stock A trades $0.03 above the range on one print, gets no follow-through, and is back inside the range within ninety seconds. Stock B trades through the same distance, then keeps trading there, printing at the new level for the next twenty minutes and building a fresh cluster of activity above the old range.
Same initial move. Completely different outcomes. Auction market theory is the framework that explains why, and more importantly, gives a trader a way to tell which one is happening while it's still unfolding, not just after the fact.
What is auction market theory? Auction market theory describes financial markets as a continuous two-way negotiation between buyers and sellers, where price moves up or down specifically to find a level that attracts enough opposing activity to facilitate trade. Markets alternate between balance, a range where buyers and sellers broadly agree on value, and imbalance, a directional move where one side dominates until a new, higher or lower level of agreement is found.
Auction Market Theory vs. Market Profile: The Idea Behind the Chart
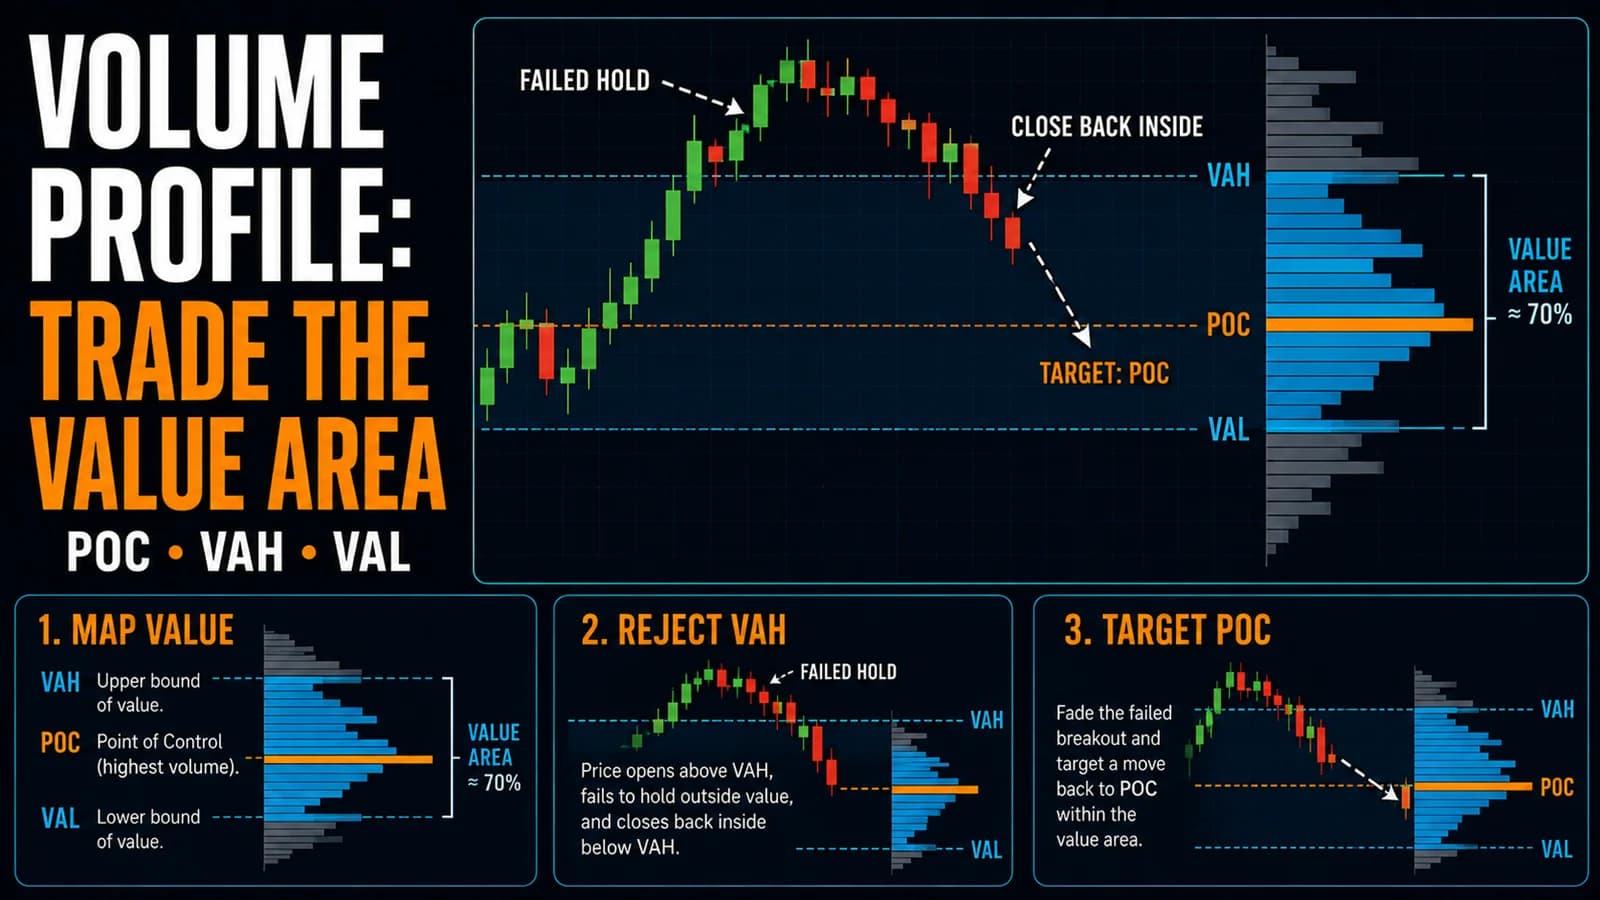
Market Profile is the charting method: half-hour TPO brackets, value areas, points of control, built to visualize where a session's trading activity concentrated. Auction market theory is the conceptual framework underneath that chart, the explanation for why markets build that particular shape in the first place.
Where the Market Profile guide focuses on reading the resulting structure, this article focuses on the mechanism generating it: the market as a continuous auction, constantly testing whether the current price attracts enough of the opposite side to keep trading there, or whether it needs to move further to find genuine two-sided interest. Understanding both together is more useful than either alone; the theory explains what the chart is showing, and the chart makes the theory's abstract concepts visible and measurable.
The Core Mechanics: Balance, Imbalance, and Facilitating Trade
A market's core job, in this framework, is to facilitate trade, meaning to keep finding prices that bring buyers and sellers together. It does this by moving. A price where buyers vastly outnumber willing sellers doesn't stay there; it moves up until enough sellers are attracted to balance the buying. A price where sellers dominate moves down until it attracts enough buyers.
Balance describes a state where that search has, at least temporarily, succeeded: price oscillates within a defined range because the current level range is broadly agreeable to both sides, and neither side has enough conviction to push decisively beyond it. Imbalance describes the opposite: one side has clearly overwhelmed the other, and price moves directionally, often quickly, until a new balance point is found.
Two further concepts refine this. Initiating activity is trading that pushes price to a new area, typically associated with larger, more committed participants willing to pay a premium (buying above the recent range) or accept a discount (selling below it) to establish a new position. Responsive activity is trading that happens at the edges of an established range, buying SupportSupport is a price level where buying pressure has historically overcome selling pressure, causing price to stop declining and reverse — it's the floor where demand enters the market, and when it holds, it's a potential long entry; when it Read definition → and selling ResistanceResistance is a price level where selling pressure has historically overcome buying pressure, causing price to stall, reverse, or consolidate — it's the ceiling where supply enters the market and where breakout traders watch for either a coRead definition →, essentially betting that the existing balance will hold rather than break. Recognizing which type of activity is dominating at a given moment, initiating (pushing toward new territory) or responsive (defending the existing range), is central to reading which regime the market is currently in.
Excess vs. Acceptance: Telling a Real Break From a Fake One
The single most useful practical distinction auction market theory offers is between excess and acceptance at the edge of a range. Excess is a brief, unconfirmed probe beyond a boundary that gets immediately rejected, a single quick test that finds no real interest and snaps back. Acceptance is genuine: price trades beyond the boundary and stays there long enough, across multiple time brackets, to show real participants are willing to transact at that new level.
This is precisely the distinction in the Stock A versus Stock B example that opened this article. Stock A showed excess: a probe with no follow-through, rejected almost immediately. Stock B showed acceptance: sustained trading at the new level over an extended window, evidence that a fresh auction had genuinely opened up there. Confusing the two, treating every boundary poke as a BreakoutA breakout is when price moves decisively beyond a defined level — a resistance zone, a consolidation boundary, a chart pattern boundary, or a prior high — suggesting that the previous supply at that level has been overcome.Read definition → worth chasing, is one of the most common and costly misreads in day trading generally, not just in strategies explicitly built around this framework.
When Auction Market Theory Reading Actually Applies
This framework works best in markets with continuous, genuinely two-sided participation: liquid futures, major index products, and actively traded large-cap and mid-cap equities. The concepts of balance and imbalance depend on there being real competing interest on both sides; in a thin, single-market-maker name, there's no meaningful auction happening in the first place, just one participant setting a price largely unopposed.
Binary, event-driven moves are a separate case worth flagging explicitly. A stock gapping on an EarningsAn earnings report is the quarterly financial disclosure a public company files with the SEC, revealing revenue, earnings per share (EPS), profit margins, and forward guidance — it's the most significant regular catalyst for individual stocRead definition → surprise or reacting instantly to an FOMC statement isn't gradually negotiating its way to a new balance point the way this framework describes; it's repricing almost immediately based on new information, and the gradual, auction-based read described here applies much better once that initial repricing settles than during the first violent seconds of the reaction itself.
The Balance-Break Acceptance Setup
The clearest tradeable pattern this framework produces is a confirmed breakout from balance into imbalance, using acceptance, not just a single price probe, as the entry trigger.
- Component
- Market Conditions Required
- Rule
- A recognized, multi-bracket balance range (at least 3 consecutive 30-minute brackets trading within a defined boundary); liquid, two-sided instrument
- Component
- Time of Day
- Rule
- Any session, but most reliable during the first 90 minutes and final hour when genuine directional conviction is highest
- Component
- Stock Selection Criteria
- Rule
- RVOL at 1.5 or higher on the breakout attempt; average daily volume sufficient to have built a clean balance range in the first place
- Component
- Entry Trigger
- Rule
- Price trades beyond the balance range's boundary and two consecutive 30-minute brackets both close outside the old range without a full reentry (acceptance, not excess)
- Component
- Stop Loss
- Rule
- Back inside the old balance range, beyond its nearest boundary
- Component
- Initial Profit Target
- Rule
- A measured move equal to the balance range's own width, projected from the breakout point, or a 1:1 R-multiple
- Component
- Trade Management
- Rule
- Hold while the new area builds its own developing value with initiating activity continuing in the breakout direction; trail using the new range's low (long) or high (short)
- Component
- Invalidation Criteria
- Rule
- Price fully reenters the old balance range after initially showing acceptance
| Component | Rule |
|---|---|
| Market Conditions Required | A recognized, multi-bracket balance range (at least 3 consecutive 30-minute brackets trading within a defined boundary); liquid, two-sided instrument |
| Time of Day | Any session, but most reliable during the first 90 minutes and final hour when genuine directional conviction is highest |
| Stock Selection Criteria | RVOL at 1.5 or higher on the breakout attempt; average daily volume sufficient to have built a clean balance range in the first place |
| Entry Trigger | Price trades beyond the balance range's boundary and two consecutive 30-minute brackets both close outside the old range without a full reentry (acceptance, not excess) |
| Stop Loss | Back inside the old balance range, beyond its nearest boundary |
| Initial Profit Target | A measured move equal to the balance range's own width, projected from the breakout point, or a 1:1 R-multiple |
| Trade Management | Hold while the new area builds its own developing value with initiating activity continuing in the breakout direction; trail using the new range's low (long) or high (short) |
| Invalidation Criteria | Price fully reenters the old balance range after initially showing acceptance |
The setup is deliberately conservative: it requires two full brackets of confirmation rather than entering on the first probe, trading patience for a meaningfully lower false-signal rate. A trader willing to accept a worse entry price in exchange for a much higher-confidence read is the target user for this specific version of the setup.
Walking Through a Live Balance-to-Imbalance Read
Picture a liquid mid-cap stock that's spent the first two hours of the session in a tight balance range between $67.40 and $67.90, visible across four consecutive 30-minute brackets with overlapping TPOs throughout that range and no sustained activity outside it.
At 11:35 AM ET, RVOL picks up and price trades through $67.90 on a burst of initiating buying, reaching $68.05 before the bracket closes at 12:00 PM. That single bracket's push above the range, on its own, would be excess if it snapped straight back, or the start of acceptance if it holds. The next bracket, 12:00 to 12:30 PM, is where the read gets confirmed: price stays above $67.90 the entire bracket, trading between $67.95 and $68.15, never reentering the old range. Two consecutive brackets outside the old boundary, with no full reentry, is the acceptance confirmation.
A trader's entry trigger fires at 12:30 PM as that second bracket closes, buying around $68.10, stop at $67.85 (back inside the old range), and an initial target using the measured-move method: the old balance range was fifty cents wide ($67.40 to $67.90), projected from the $67.90 breakout point, giving a target near $68.40.
Managing a Trade Built on the Balance-Break Setup
Once in the trade, watch whether the new area above the old range starts building its own balance, developing overlapping TPOs and a shrinking range, which would suggest the market has found a fresh, if temporary, agreement point and the trend may be pausing there rather than continuing immediately. Continued initiating activity, fresh pushes to new highs on rising RVOL, supports holding for the full measured-move target or beyond.
Scale partial size at the initial target, and treat a full reentry back into the original $67.40 to $67.90 range as the invalidation signal, since that would mean the market ultimately judged the breakout as excess after all, just on a longer delay than the setup's two-bracket confirmation window initially suggested.
Where Auction Market Theory Reading Breaks Down
The framework's core weakness is that "balance" and "imbalance" are judgment calls without a single universal, mechanical threshold separating them, unlike, say, a specific price level or a specific RVOL number. Two traders can reasonably disagree about whether a given range counts as genuine balance or whether a breakout has shown real acceptance versus extended excess. The setup in this article addresses that by requiring a specific, countable confirmation, two full brackets without reentry, but that's a deliberate simplification of a genuinely more fluid, interpretive framework, not a claim that the underlying theory itself reduces cleanly to hard numbers.
There's also a real risk of circular reasoning if applied carelessly: calling every successful breakout "acceptance" after the fact and every failed one "excess" retroactively explains everything and predicts nothing. The discipline the setup enforces, requiring the two-bracket confirmation before entry rather than labeling the move after it's already resolved, is what keeps the framework honest as something a trader risks capital on in real time rather than a story told afterward.
Sudden, event-driven repricing is a second honest limitation. A market reacting to a surprise headline doesn't gradually negotiate its way through excess and acceptance the way this framework describes; it can gap and hold instantly, with the normal multi-bracket confirmation process either compressed into seconds or simply not applicable until the initial shock settles.
Applying the Framework Across Timeframes
Balance and imbalance aren't limited to a single intraday range. A stock can be in a multi-day or multi-week balance area on a daily chart while showing several smaller intraday balance-to-imbalance cycles within any single session inside that bigger range. Recognizing which scale a trader is analyzing, and not confusing a small intraday balance break for a breakout from the larger structural range it sits inside, matters for setting realistic targets: a measured move from a tight 20-minute intraday range is a much smaller trade than a genuine breakout from a balance area that's held for two weeks.
Tools and Further Study
This framework doesn't require specialized software the way footprint charts or CVD do; it's a way of interpreting price and volume structure that can be read on a standard chart once a trader understands what to look for, though pairing it with Market Profile charting makes balance ranges, value areas, and acceptance easier to see visually rather than judged purely by eye. For finding stocks currently transitioning from balance into a volume-confirmed breakout, Trade Ideas can scan for the RVOL and price-action conditions this setup depends on across a much wider universe of stocks than a trader could watch manually.
Where Auction Market Theory Fits Inside a Complete Trading Plan
This framework is best used as a lens for classifying market conditions, is the current environment in balance or imbalance, rather than a source of constant new trade signals. A trader who correctly identifies balance can choose range-based tactics; a trader who correctly identifies genuine imbalance can choose trend-following tactics; getting that classification wrong, chasing every range poke as a breakout or fading every genuine trend as a temporary excess, is a common and expensive mistake this framework is specifically built to prevent. Combined with defined position sizing and a clear risk/reward framework, it improves the quality of that classification. It doesn't replace the need for a specific, mechanical entry trigger like the one described above.
Frequently Asked Questions
How many brackets of confirmation are actually needed to distinguish excess from acceptance?
A single bracket's push beyond a range could still resolve as excess if the next bracket reverses it fully. Requiring two consecutive brackets to hold outside the old range meaningfully reduces false signals, though it comes at the cost of a later, sometimes less favorable entry price than acting on the very first probe.
Key Takeaway: Two-bracket confirmation trades a better win rate for a later entry; a trader who wants to be earlier accepts more false signals in exchange.
What's the difference between initiating and responsive activity in practice?
Watching which type dominates helps classify the current regime. A range where responsive buying and selling repeatedly defends the same boundaries is balance. A range where initiating activity repeatedly overwhelms the responsive side and pushes into new territory is the early stage of imbalance.
Key Takeaway: Track whether trading at the range's edges is defending it (responsive) or breaking it (initiating) to judge which regime is currently in control.
Does auction market theory work the same way during a scheduled economic release like CPI or an FOMC announcement?
The framework applies much more reliably once the initial reaction settles and a new, post-event range starts to form, rather than during the first seconds or minutes of the reaction itself, when price can gap and whipsaw in ways that don't reflect a gradual auction process.
Key Takeaway: Wait for the immediate post-release volatility to settle before applying balance-versus-imbalance reasoning around a scheduled economic release.
Can a stock be in balance on the daily chart while showing imbalance intraday?
A stock stuck in a multi-week balance range on the daily chart can still show several genuine intraday balance-to-imbalance cycles within individual sessions, none of which necessarily represents a break of the larger structural range. Both reads can be valid at their own scale simultaneously.
Key Takeaway: Always be clear about which timeframe's balance range is being analyzed before sizing a target off it.
Is there a risk of just calling every outcome "acceptance" or "excess" after the fact to fit the theory?
The fix is requiring a specific, countable, pre-defined confirmation rule, like the two-bracket standard used in this article's setup, decided before the trade rather than assigned as a label afterward.
Key Takeaway: Commit to a specific confirmation rule in advance; don't let the excess-versus-acceptance label become a story told only after the outcome is known.
How does this framework relate to a standard support and resistance approach?
A trader used to thinking in terms of hard support and resistance lines can find the balance-and-imbalance framing initially less precise but ultimately more descriptive of how liquid markets actually behave over time, since it explicitly accounts for the process of a level being tested and either reaffirmed or abandoned.
Key Takeaway: Think of auction market theory as a more dynamic, process-oriented version of support and resistance, not a replacement that discards the concept of key levels entirely.
Why does the framework work less reliably in thin, low-float stocks?
The framework's entire premise is that price moves to find a level that attracts opposing interest from real, independent participants. In a stock effectively controlled by one or two market makers, that dynamic doesn't play out the same way, and the resulting "balance" or "imbalance" reads carry much less information.
Key Takeaway: Reserve this framework for liquid, genuinely two-sided instruments; thin names don't produce a meaningful auction to interpret.
Do all breakouts from balance eventually lead to a sustained trend?
This is why the setup in this article uses a measured-move target based on the old range's width rather than assuming unlimited continuation. Many confirmed breakouts travel a defined distance and then pause into a new balance area rather than trending indefinitely.
Key Takeaway: Use a measured, defined target after a confirmed breakout rather than assuming the move will continue without a fresh consolidation.
Disclaimer
Article Sources
- The Price Impact of Order Book Events (Cont, Kukanov, Stoikov) - academic research on how order flow imbalance drives short-term price movement.papers.ssrn.com
- SEC: Hiding Behind the Veil — Informed Traders and Pre-Trade Opacity - SEC research seminar paper on informed versus uninformed order flow, relevant to distinguishing initiating from responsive activity.sec.gov
- CME Group Education Hub - exchange-provided courses on futures market structure and trading concepts.cmegroup.com
- SEC: Types of Orders (Investor.gov) - official reference on order types and market structure fundamentals.investor.gov