

Author Profile
Kazi Mezanur Rahman
Founder, independent researcher, and editor of DayTradingToolkit. A one-person publication focused on risk-first trading education and documented tool research. He trades his own capital as a retail trader and combines personal market experience with systematic primary-source research.
Areas of expertise
465
Published articles
Risk-first
Editorial focus
Independent
Review standard
About the Author
Kazi Mezanur Rahman is the founder, independent researcher, and editor behind DayTradingToolkit, a one-person publication. He built the site to organize practical trading education, primary-source research, calculators, and documented tool reviews in one place.
Kazi trades his own capital as a retail trader. He does not present himself as a professional trader, full-time trader, financial adviser, broker, accountant, or attorney. His experience comes from personal market participation combined with systematic research. The editorial approach is intentionally conservative: explain risks plainly, disclose affiliate relationships, avoid profit promises, clearly distinguish research from first-hand experience, and correct material errors when they are found.
Kazi oversees the site’s education library, research methodology, review structure, and content updates across beginner lessons, strategy explainers, psychology guides, calculators, and software comparisons.
Author Archive
Articles by Kazi Mezanur Rahman
Page 8 of 39. Showing 12 of 465 published guides, reviews, and trading resources.
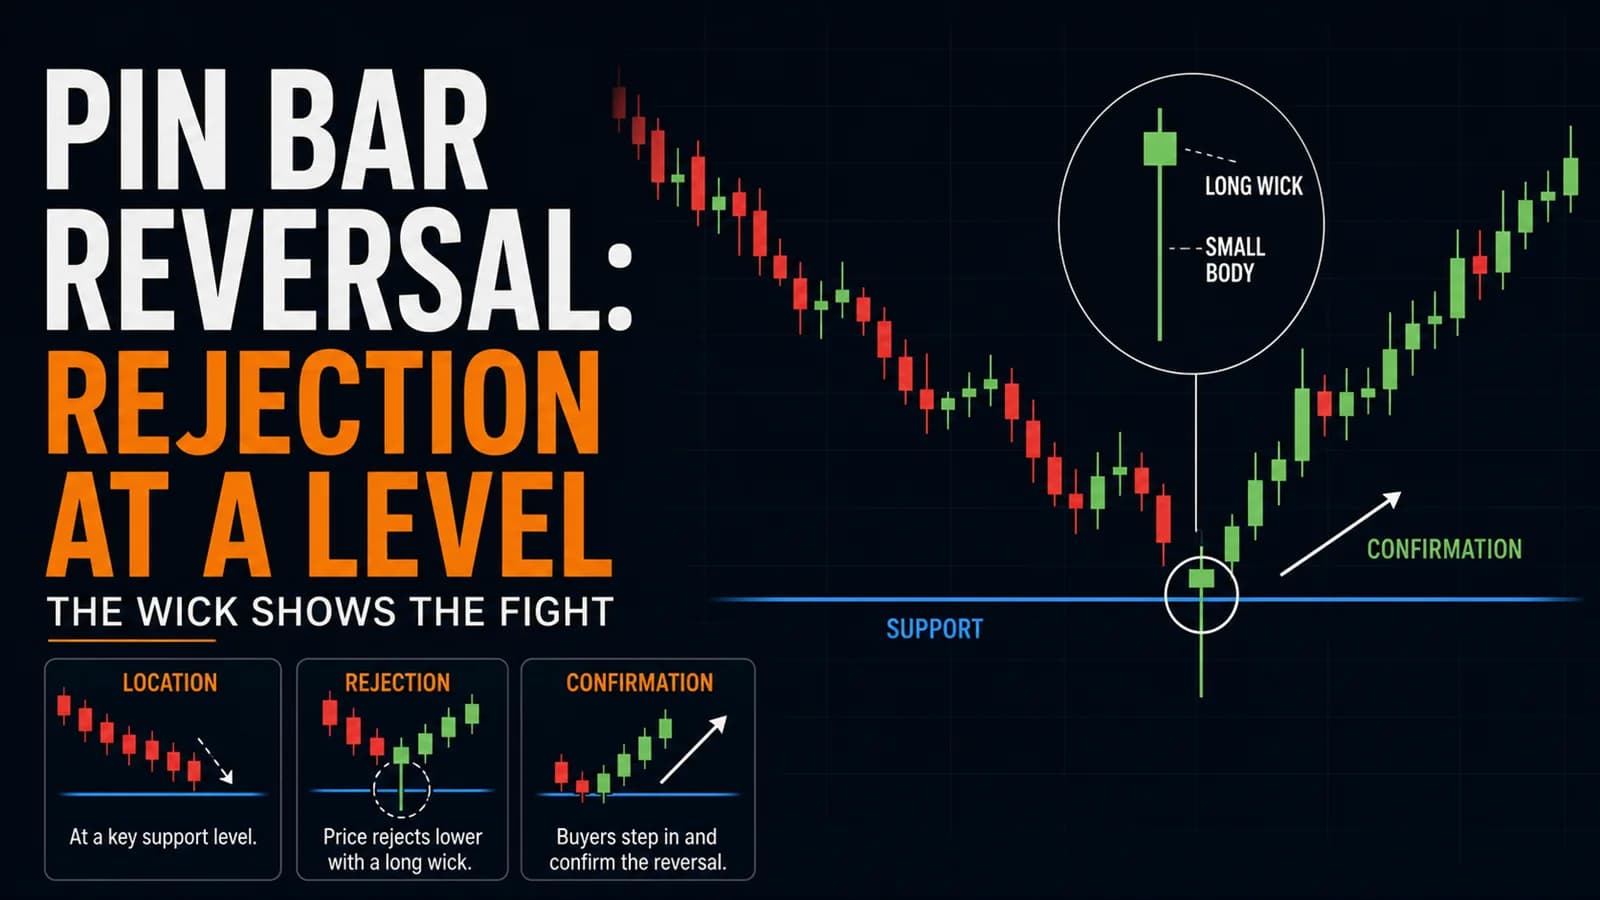
The Pin Bar Reversal Strategy for Intraday Traders
A pin bar's long wick looks like decisive rejection. The candle-by-candle research says the move it produces is usually smaller than the shape suggests.
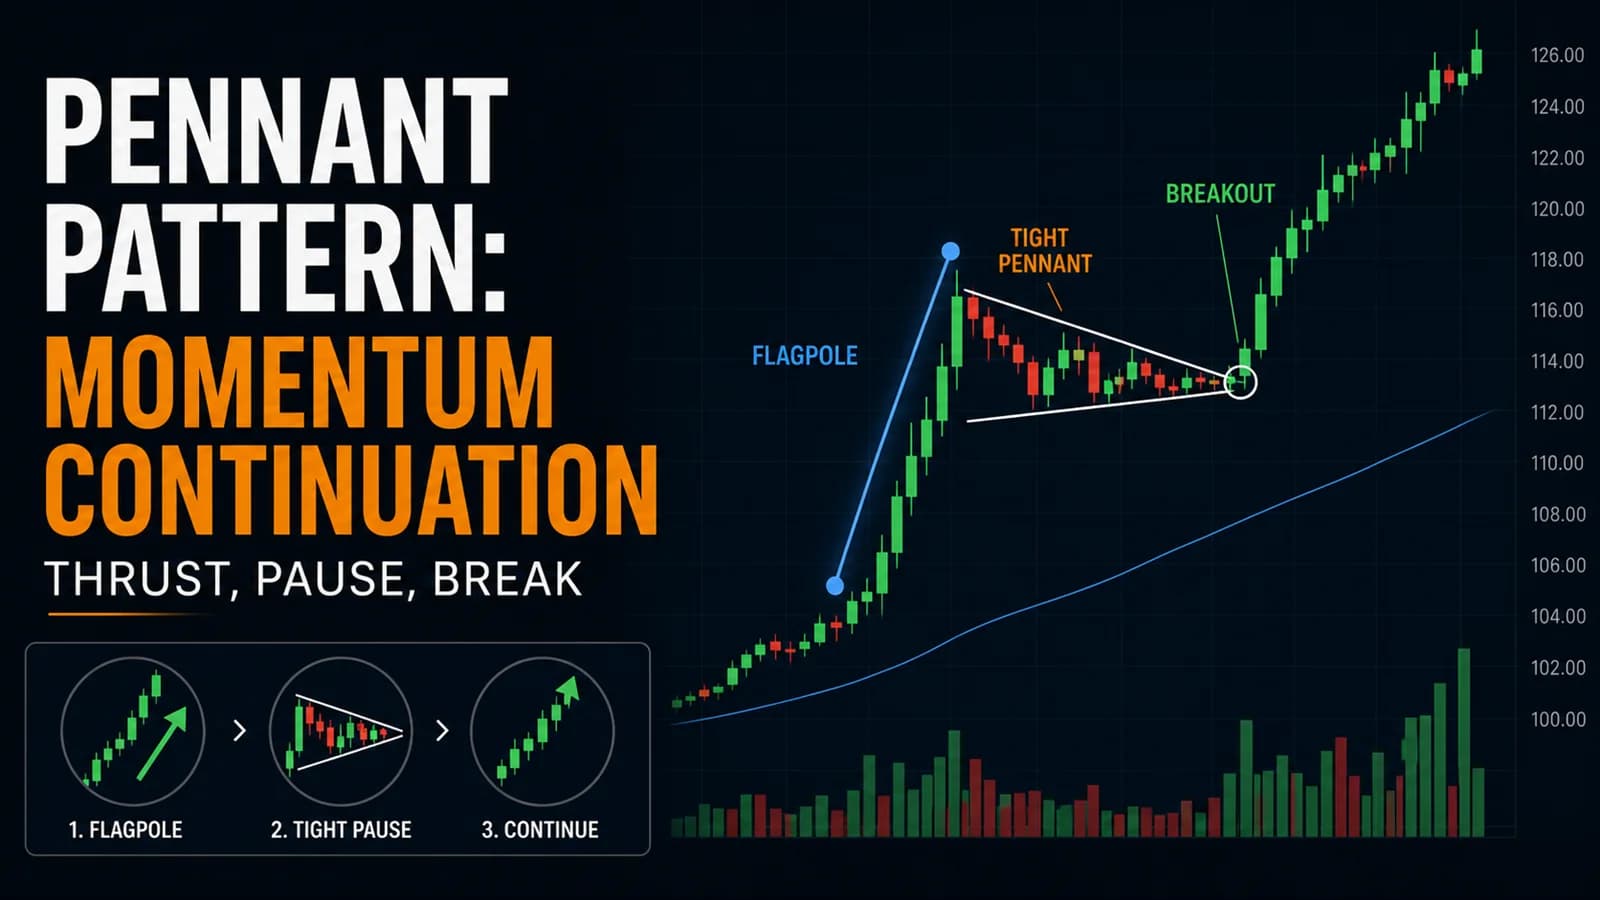
The Pennant Pattern Trading Strategy
Pennants look like the cleanest continuation pattern on the chart. The research says most of them fail to reach their target. Here's how to trade the minority that don't.
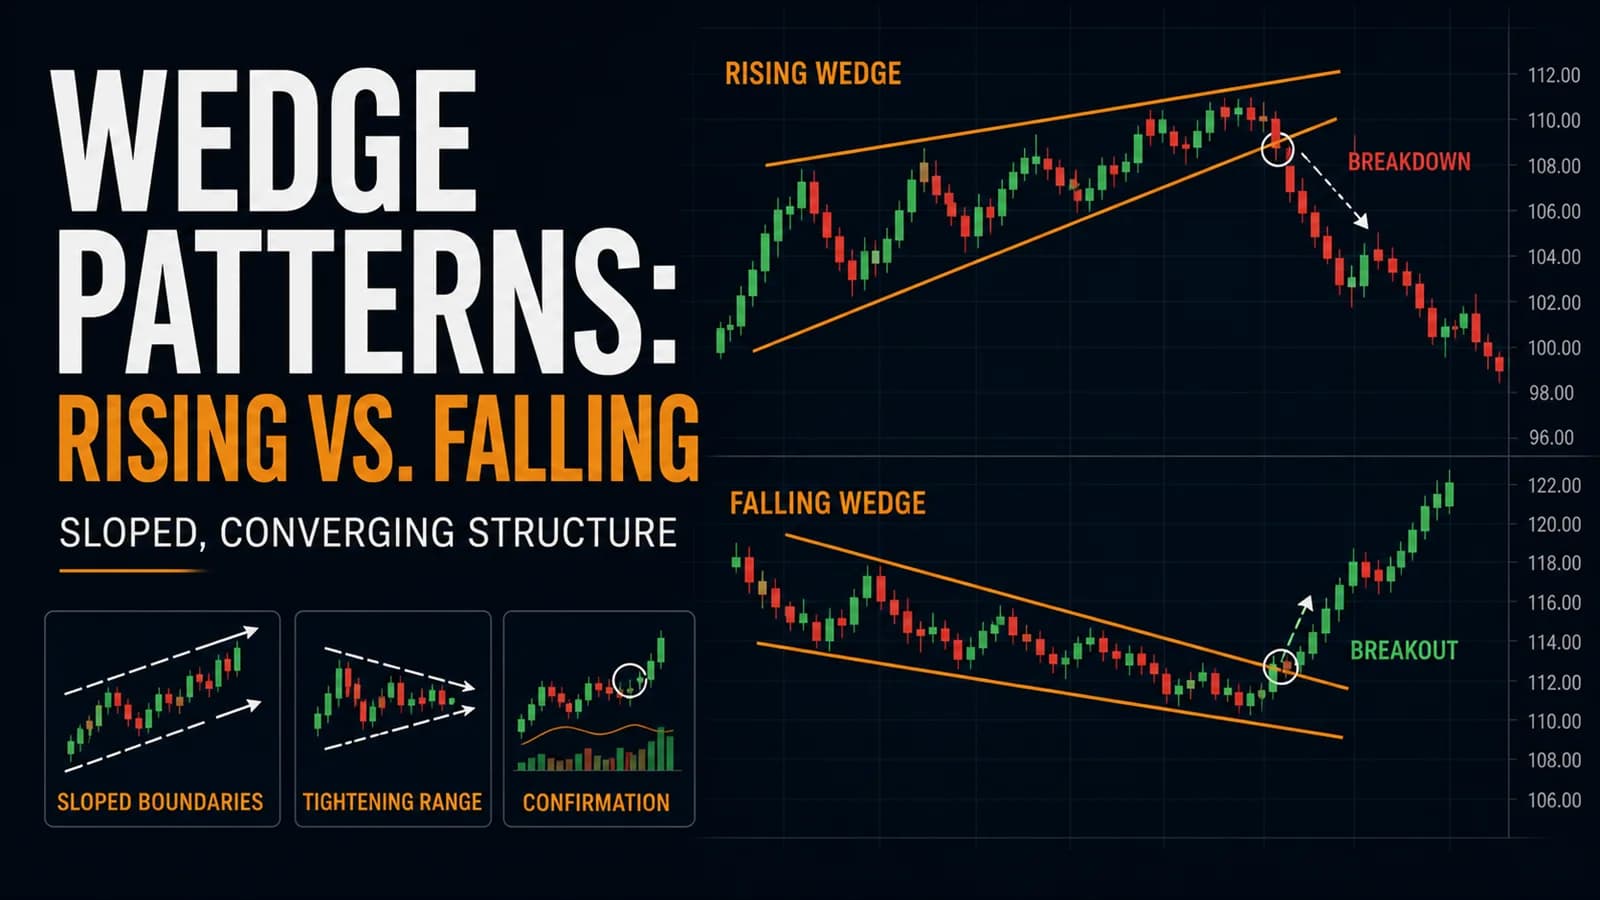
The Wedge Pattern Trading Strategy: Rising and Falling Wedges
Wedges are taught as high-conviction reversal signals. The underlying research says otherwise. Here's how to trade them anyway, sized for what the data actually shows.
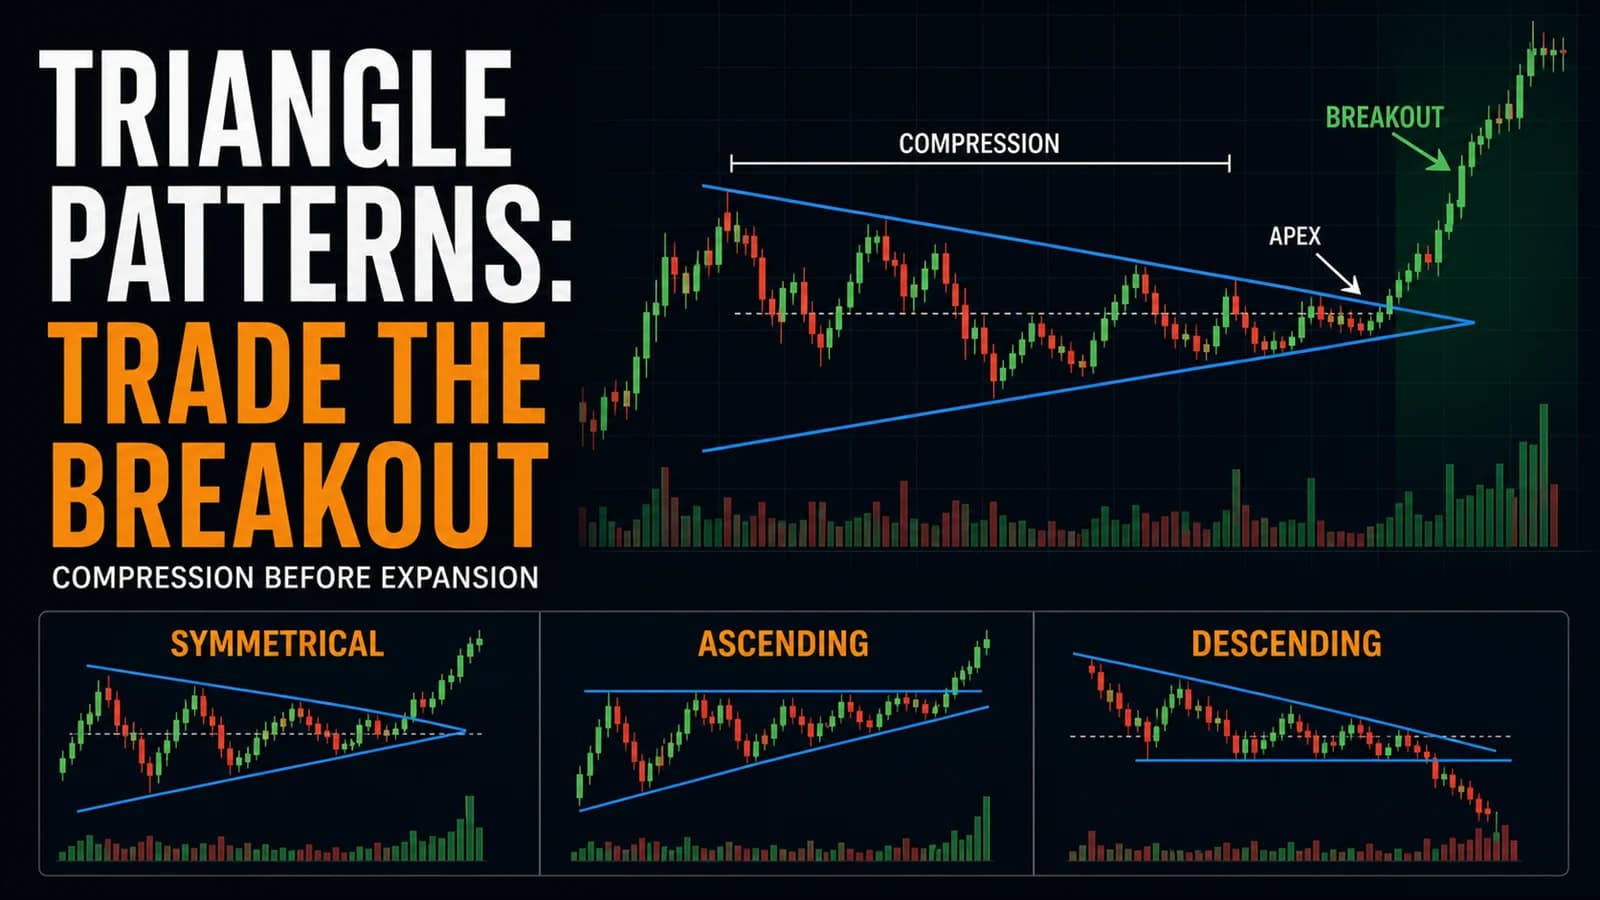
The Triangle Pattern Trading Strategy (Symmetrical, Ascending, Descending)
Descending triangles are taught as bearish. The data says otherwise more often than most traders assume. Here's the honest version of trading triangles intraday.
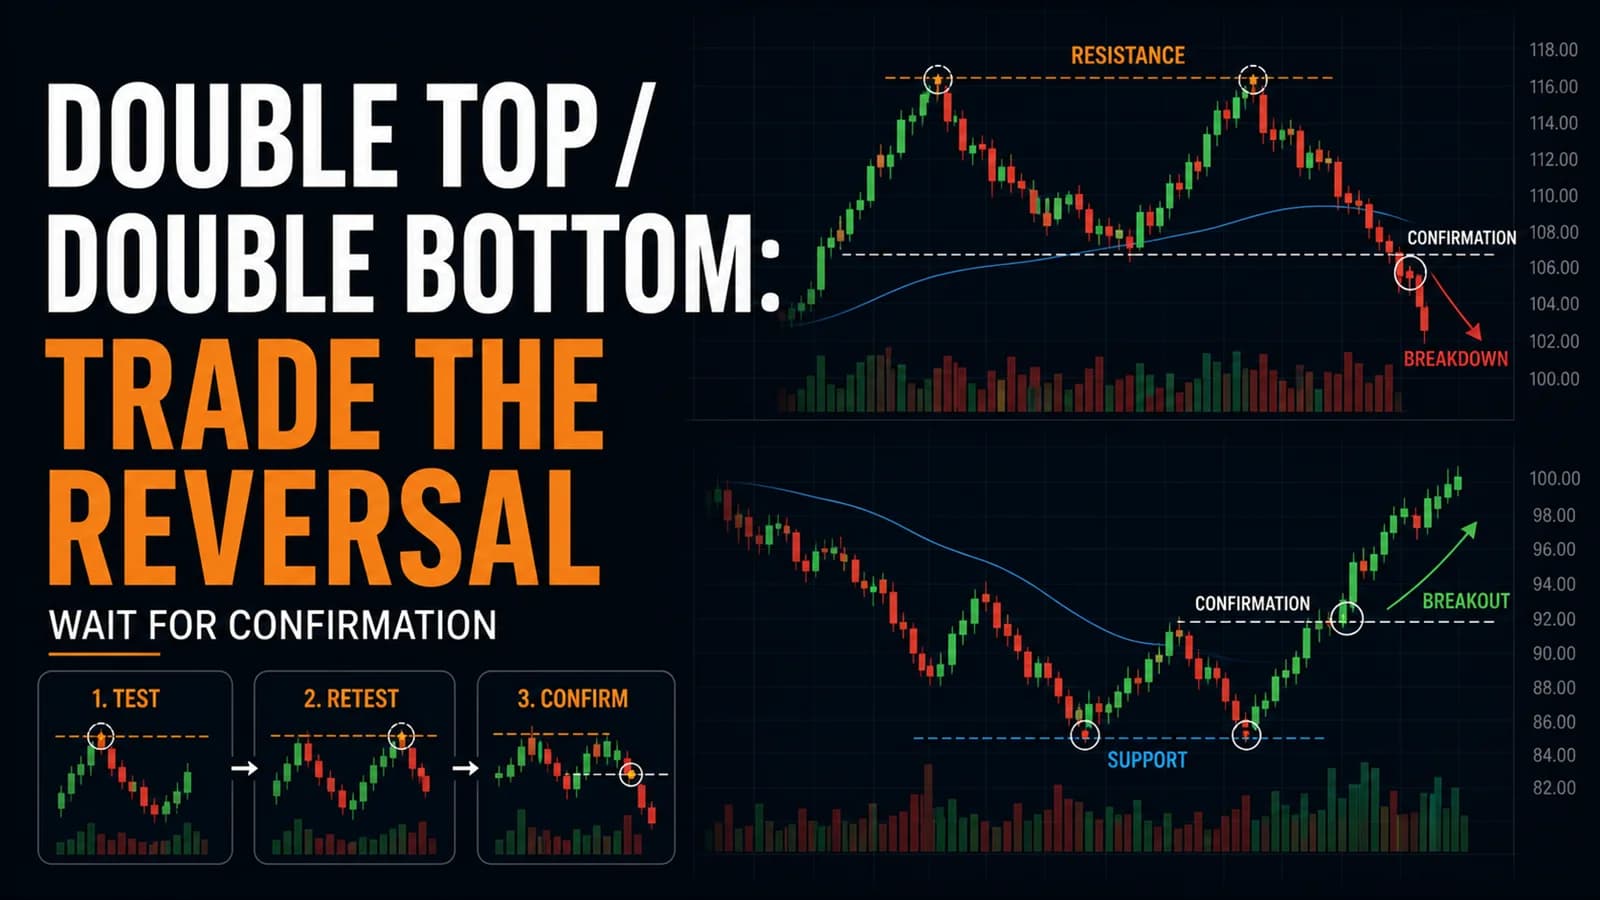
The Double Top / Double Bottom Trading Strategy
Most double tops never confirm. Here's the confirmation line that separates a real reversal from two random peaks, plus the honest failure rate behind each.
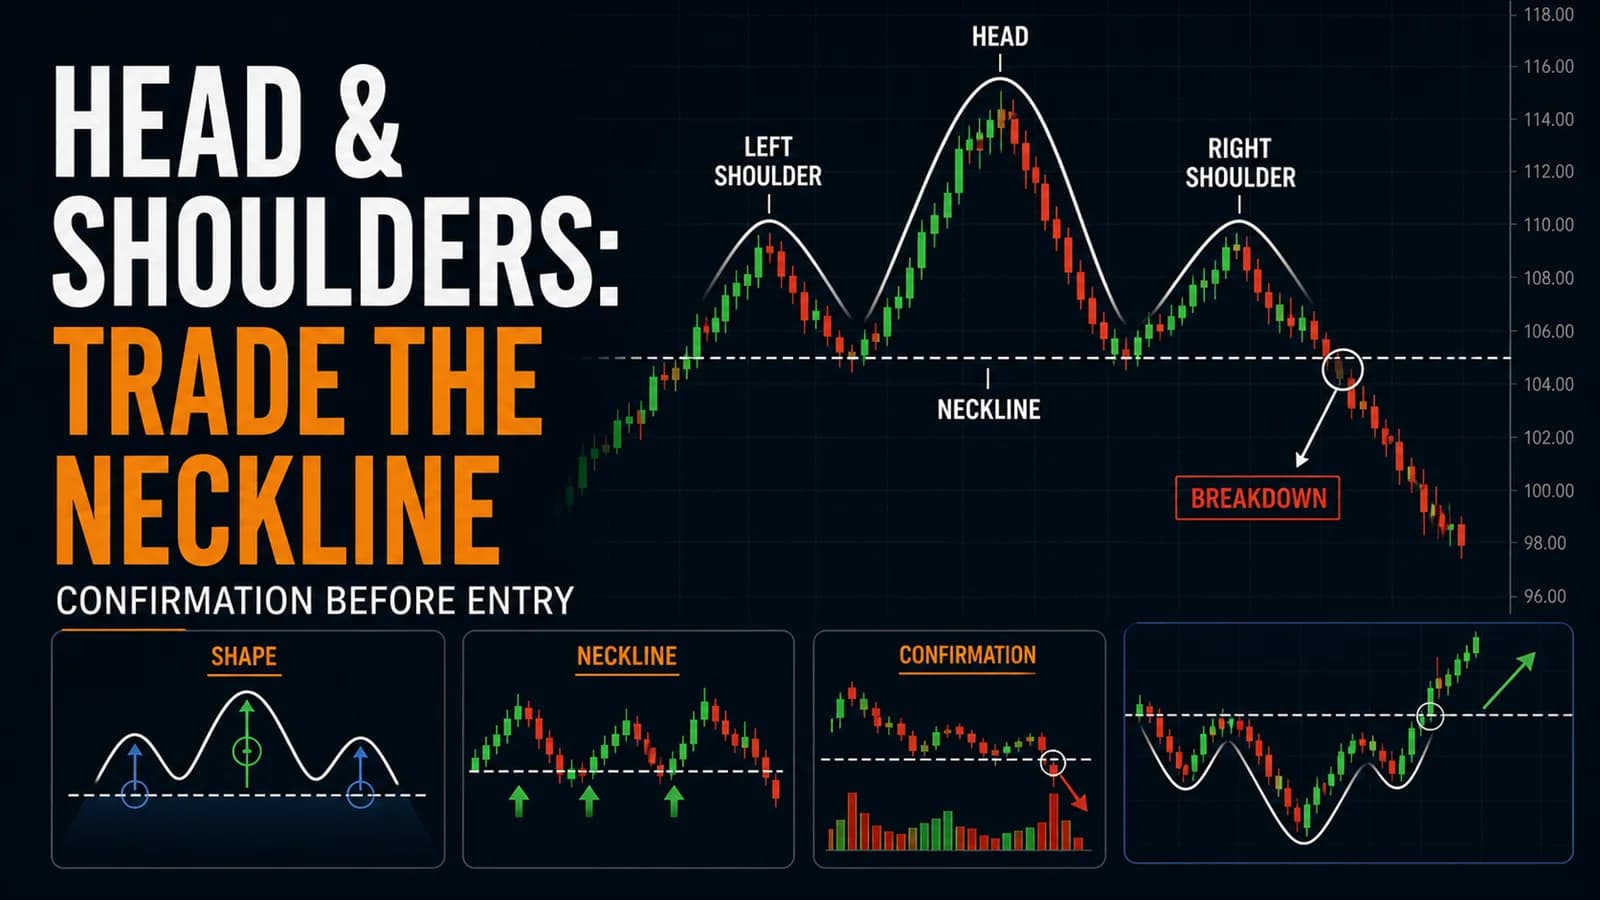
The Head and Shoulders Trading Strategy (And Inverse H&S)
The most famous reversal pattern in trading is also one of the most misdiagnosed. Here's how to actually confirm it before the neckline breaks.
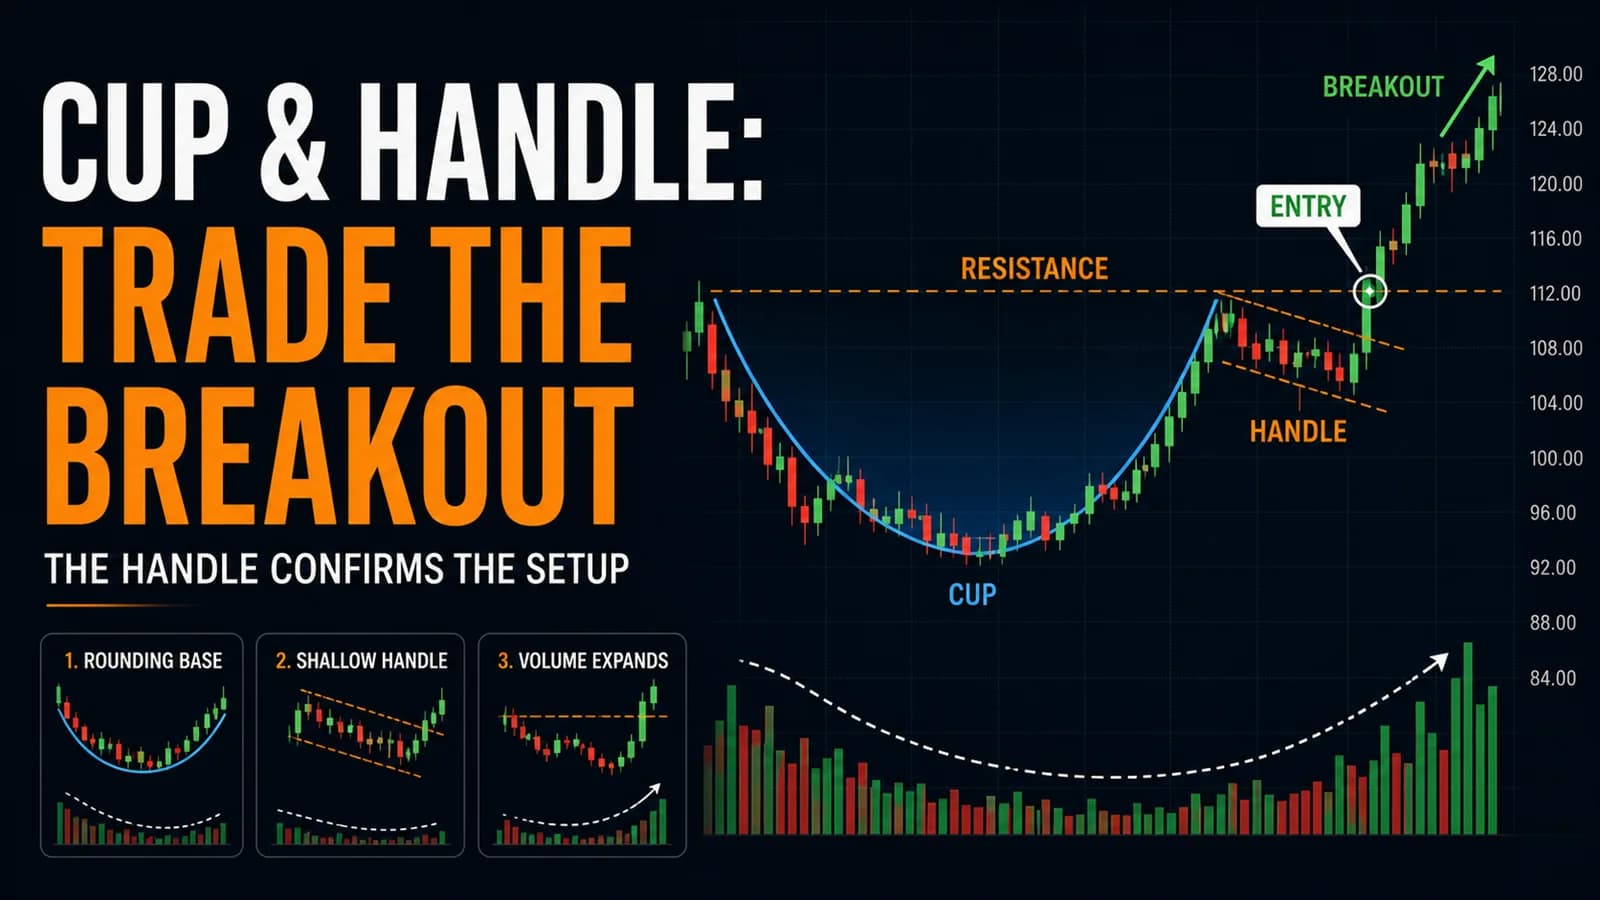
The Cup and Handle Day Trading Strategy
The cup and handle rewards patience most patterns don't. Here's the intraday version, with a real Setup Spec and the specific way the handle fails.
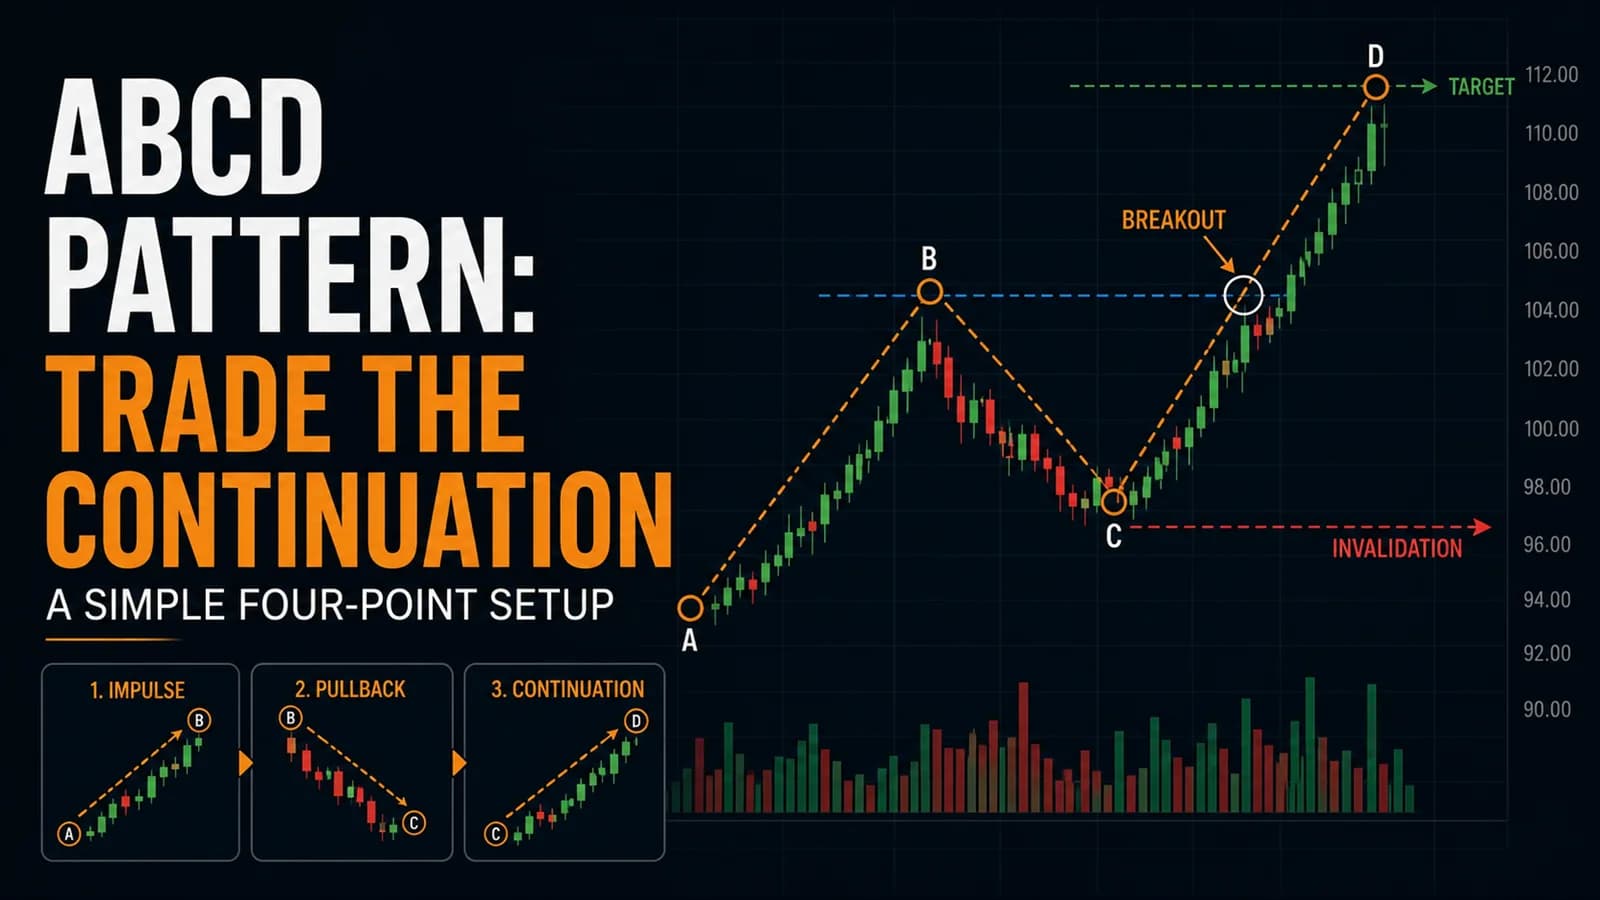
The ABCD Pattern Trading Strategy: A Beginner-Friendly Setup
The ABCD pattern turns a messy pullback into a measured price target. Here's the mechanical version day traders actually use, including where it breaks down.
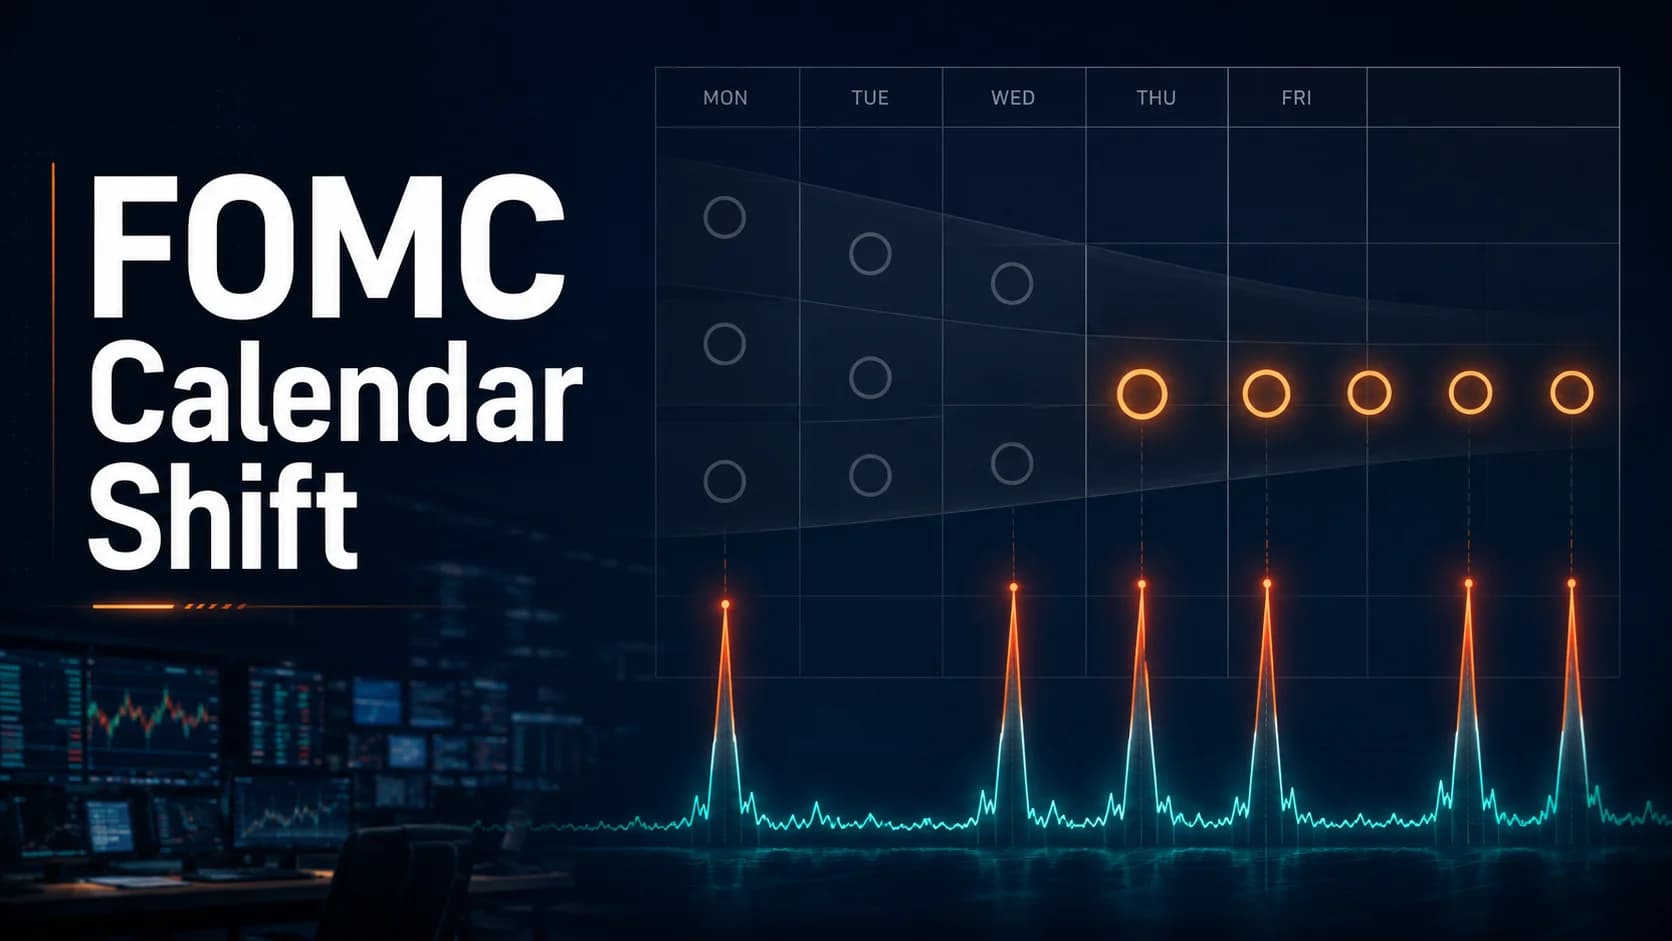
Warsh Wants Fewer Fed Meetings: What Changes for Traders
Fed Chair Kevin Warsh is exploring cutting FOMC meetings from eight a year to as few as five or six. Here's what's actually been proposed, the history behind the eight-meeting standard, and what wider gaps between Fed decisions would mean for your trading calendar.
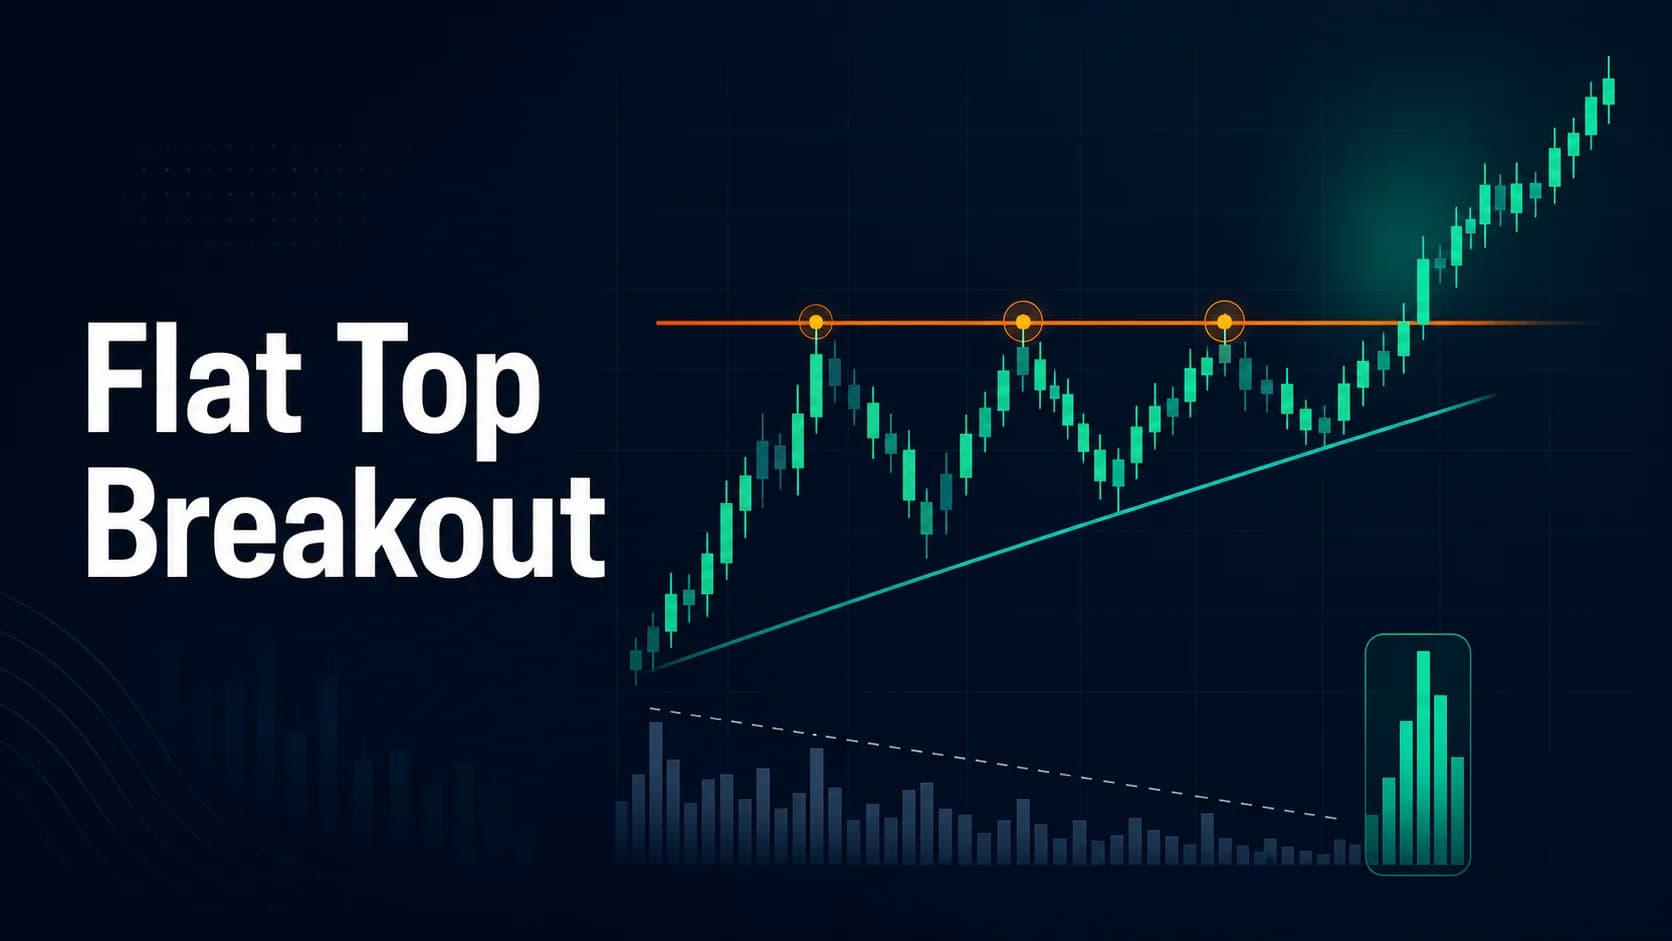
The Flat Top Breakout Strategy (a.k.a. Ascending Triangle Day Play)
Ascending triangles aren't perfectly symmetric. The data shows a genuinely solid long setup on the upward breakout, but a weak trade on the downside.

Weekly Market Insights August 10-14, 2026: A Weak Jobs Report Bought the Fed Room to Wait. CPI and a Wall of AI Earnings Decide If It Holds.
A weak jobs report eased rate fears, but CPI, PPI, and earnings from CoreWeave, Nebius, Cisco, and Applied Materials test whether the AI trade holds this week.
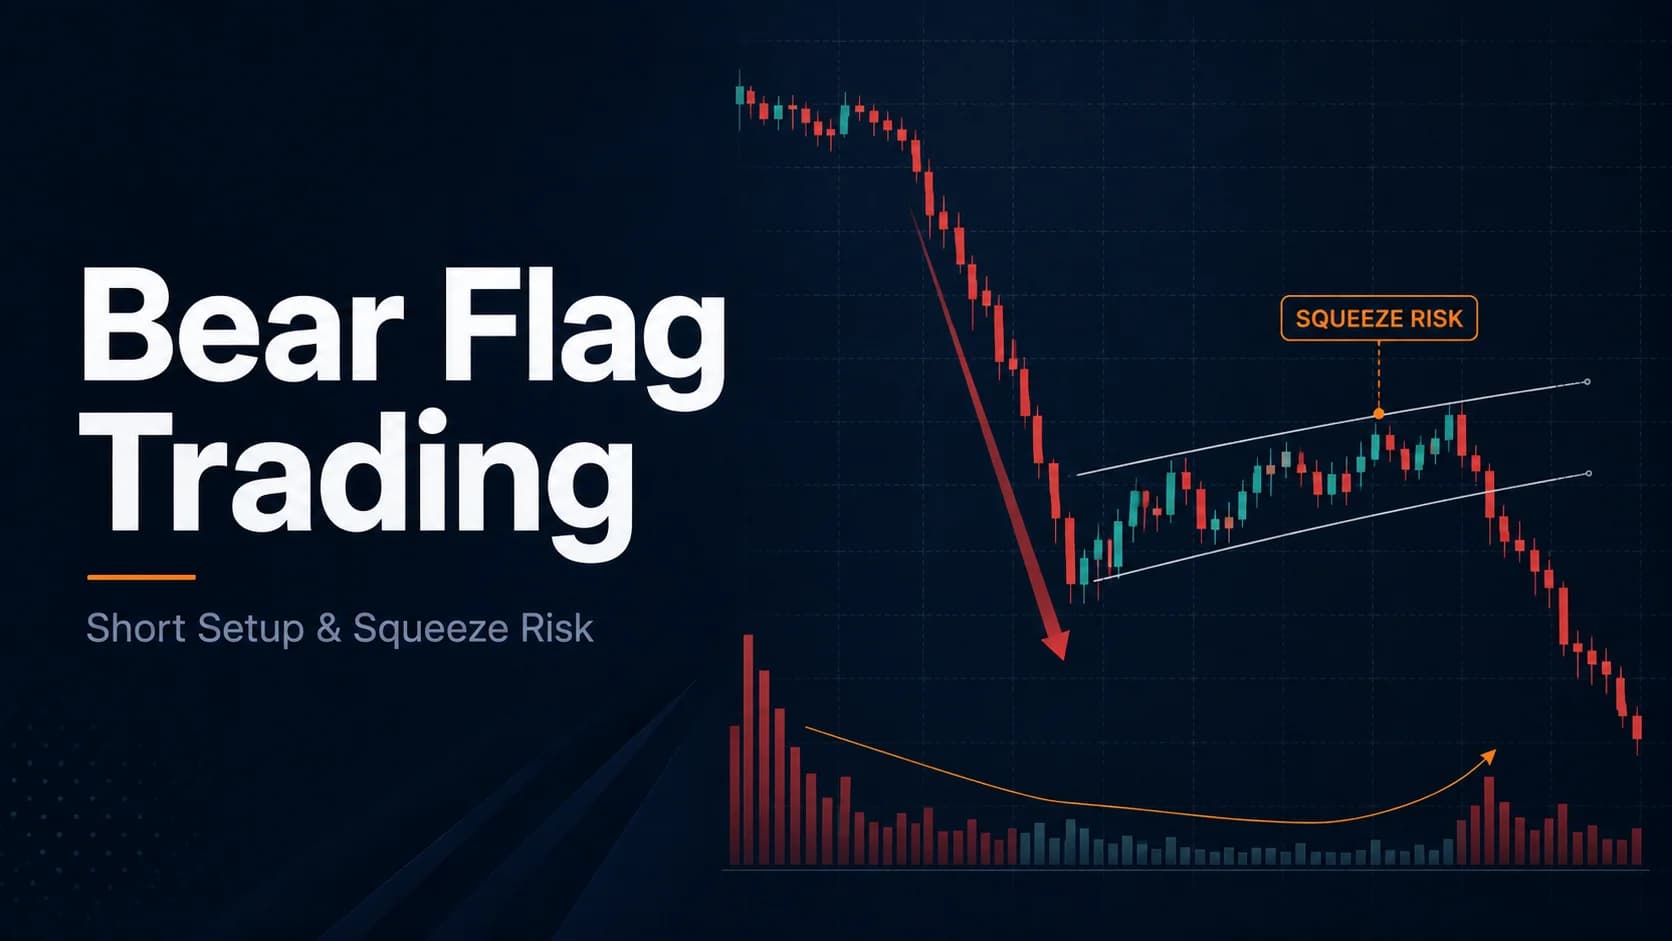
The Bear Flag Trading Strategy: Shorting the Continuation
A bear flag looks like a bull flag flipped upside down, but shorting one carries a risk the long version doesn't have. Here's the real setup and numbers.