
The Bear Flag Trading Strategy: Shorting the Continuation

In this article12 sections
A stock craters 15% in ten minutes, then drifts quietly higher for the next quarter hour. Some traders read that bounce as the selling being over. Chart-pattern research suggests something closer to the opposite: a tight, low-volume bounce after a sharp decline is often just the pause before the decline resumes, not the start of a recovery. Knowing the difference, and knowing the one risk this specific short setup carries that its bullish mirror image doesn't, is what separates trading a bear flag well from getting run over by one.
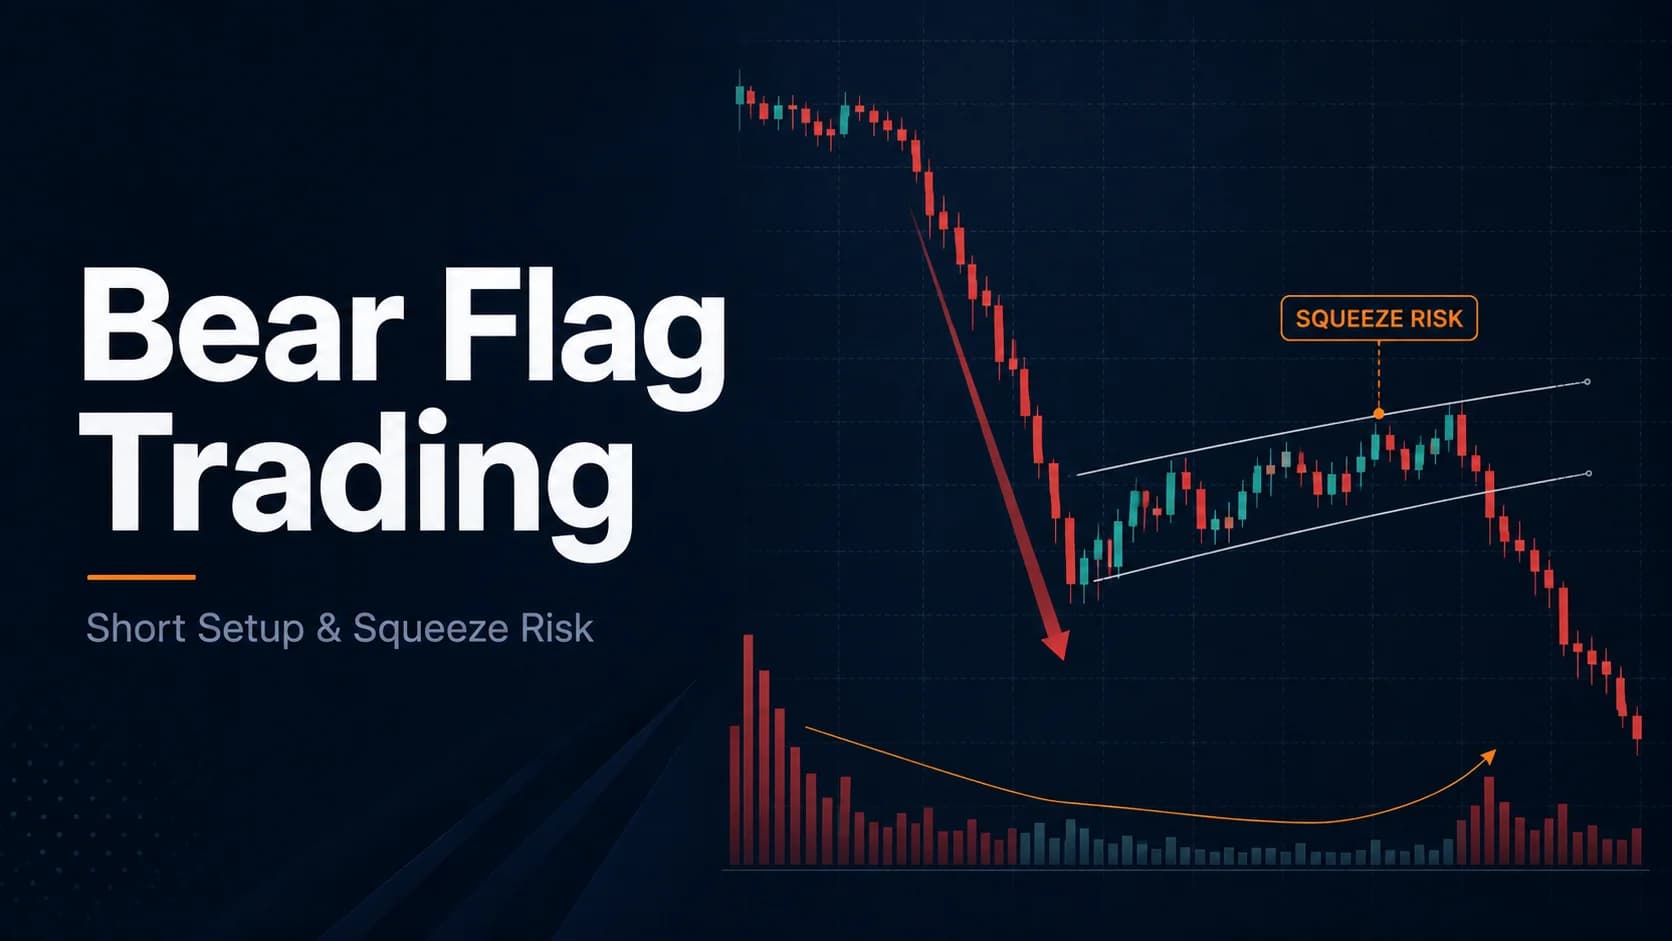
What is a bear flag? A bear flag is a chart pattern that forms when a stock makes a sharp, steep decline (the flagpole), then pauses in a tight, short consolidation that drifts slightly upward against the prior trend (the flag), before breaking down and continuing lower. It signals a brief pause in selling pressure, not necessarily a reversal.
Anatomy of a Bear Flag: A Down Move That Pauses, Not Reverses
A genuine bear flag mirrors the bull flag's identification criteria in reverse. The flagpole needs to be a steep, near-vertical decline; a slow grind lower doesn't qualify. The flag portion needs to stay short, under roughly three weeks on a daily chart, trading between two roughly parallel trendlines that drift upward, against the direction of the flagpole. A flag that drifts sideways with no real upward tilt, or one that's wide and choppy rather than tight, is a weaker, less textbook version of the pattern.
Volume matters just as much here as shape. In Thomas Bulkowski's data, volume trended downward during the flag itself in 77% of patterns that went on to break out (or in this case, break down) to the downside, a slightly higher rate than the 74% seen in upward-breakout flags. A bounce on fading, thinning volume is showing exhausted buying rather than a genuine change in control. A bounce on rising or erratic volume is a different, less reliable signal entirely, and deserves considerably less confidence as a continuation setup.
The Psychology: Short Covering, Fresh Shorts, and the Bounce That Isn't a Reversal
The flagpole represents a burst of aggressive selling, often triggered by bad news, a broken support level, or a sudden shift in sentiment, that pushes price down quickly. Once that burst runs its course, two groups are left holding opposite positions: short sellers who are sitting on quick gains and start covering, buying back shares to lock in profit, and traders who missed the initial decline and are shorting the bounce, betting the move isn't over.
That tug of war produces the flag's upward tilt: mild, controlled buying from covering shorts, absorbed by fresh selling from traders fading the bounce, in a range too narrow and orderly to represent genuine accumulation. The fading volume during the flag is the signature of that dynamic. If real buyers were stepping in to reverse the trend, volume during the bounce would typically expand as conviction built, not shrink. A bear flag that behaves this way, a quiet pause with thinning participation rather than a fight, is showing exhaustion, not a genuine change of direction.
What Bulkowski's Data Actually Shows for Downward Breakouts
The same correction that applies to bull flags applies here. Bulkowski's updated 2020 statistics show a 45% break-even failure rate for downward breakouts, meaning 45% of bear flags failed to produce even a 5% decline after the breakdown. The average decline across all of them was 8%. Both figures are close to, and very slightly worse than, the equivalent bull flag numbers (44% failure, 9% average rise), a small but real asymmetry worth knowing rather than assuming the pattern behaves identically in both directions.
As with the bull flag, this average is measured from the breakdown to the end of the short-term price swing that follows, not to the pattern's ultimate low the way most other chart patterns are scored, which is why the 8% figure looks modest next to other pattern types. About 46% of bear flags with downward breakouts met their measured price target, and roughly 40% of all flags in Bulkowski's broader sample break out downward. None of these statistics, like the bull flag's, come from intraday timeframes; they describe daily-bar charts and multi-day swings, and this guide treats the pattern's underlying logic as transferable across timeframes while treating the specific percentages as descriptive of the daily chart, not a same-session guarantee.
The Squeeze Risk That Makes Bear Flags Different From Their Bullish Mirror
Here's where the bear flag genuinely isn't just a bull flag with the signs flipped. A long position in a failed bull flag loses money the way any failed long trade does. A short position in a failed bear flag carries a risk the long version structurally can't: a short squeeze.
If the stock behind a bear flag is heavily shorted or has a limited float, the same upward bounce that looks like ordinary short covering in the psychology described above can accelerate into forced buying, as short sellers caught offside scramble to cover into a thin order book. That dynamic doesn't exist in reverse for a bull flag; there's no equivalent mechanical force that turns a failed long breakout into a violent, self-reinforcing spike the way covering can for a short. Checking a stock's short interest and float before shorting a bear flag is a reasonable habit specifically because of this asymmetry, not just general caution.
There's also a specific regulatory mechanic worth knowing. Under SEC Regulation SHO Rule 201, a stock that has already declined 10% or more intraday from the prior day's close triggers a short-sale circuit breaker, restricting new short sales to prices above the current national best bid for the rest of that session and the following one. A bear flag forming after a stock has already dropped sharply enough to trigger that circuit breaker can mean the entry this setup describes isn't executable in the ordinary way it would be on a stock that hasn't triggered the restriction. This hub's dedicated guide to short-selling mechanics covers locate requirements, borrow costs, and this circuit breaker in more depth than belongs in a pattern-specific guide.

The Bear Flag Setup Specification
Every component below adapts Bulkowski's identification criteria to shorting an intraday chart.
- Component
- Market Conditions Required
- Rule
- A genuinely steep, near-vertical flagpole decline on above-average volume; broad market not fighting the direction of the move.
- Component
- Time of Day
- Rule
- Most reliable during the 9:45 AM to 3:30 PM ET window, after opening volatility settles; flags forming in the first 15 minutes carry less information.
- Component
- Stock Selection Criteria
- Rule
- A real, identifiable catalyst behind the flagpole decline; shares confirmed available to borrow before attempting entry, not assumed.
- Component
- Entry Trigger
- Rule
- A break below the flag's lower trendline (or the low of the most recent consolidation bar) on renewed volume, not a break on the same fading volume that defined the flag itself.
- Component
- Stop Loss
- Rule
- Above the high of the flag's consolidation range, or above the most recent lower high inside the flag for a tighter version.
- Component
- Initial Profit Target
- Rule
- The height of the flagpole, measured from its start to its low, projected downward from the breakdown point.
- Component
- Trade Management
- Rule
- Scale a portion at the measured target, trail the remainder if volume stays elevated and the stock continues making lower highs.
- Component
- Invalidation Criteria
- Rule
- Price closes back above the flag's upper trendline, volume expands sharply on the bounce rather than fading, or the breakdown occurs on volume no higher than the fading volume seen during the flag itself.
| Component | Rule |
|---|---|
| Market Conditions Required | A genuinely steep, near-vertical flagpole decline on above-average volume; broad market not fighting the direction of the move. |
| Time of Day | Most reliable during the 9:45 AM to 3:30 PM ET window, after opening volatility settles; flags forming in the first 15 minutes carry less information. |
| Stock Selection Criteria | A real, identifiable catalyst behind the flagpole decline; shares confirmed available to borrow before attempting entry, not assumed. |
| Entry Trigger | A break below the flag's lower trendline (or the low of the most recent consolidation bar) on renewed volume, not a break on the same fading volume that defined the flag itself. |
| Stop Loss | Above the high of the flag's consolidation range, or above the most recent lower high inside the flag for a tighter version. |
| Initial Profit Target | The height of the flagpole, measured from its start to its low, projected downward from the breakdown point. |
| Trade Management | Scale a portion at the measured target, trail the remainder if volume stays elevated and the stock continues making lower highs. |
| Invalidation Criteria | Price closes back above the flag's upper trendline, volume expands sharply on the bounce rather than fading, or the breakdown occurs on volume no higher than the fading volume seen during the flag itself. |
The borrow-availability check belongs in the setup specification itself, not as an afterthought, because a short that can't actually be executed, or can only be executed at a punishing borrow fee, isn't a viable version of this trade regardless of how clean the chart looks.
A Walkthrough: Shorting a Bear Flag on a Hypothetical Intraday Chart
Consider a hypothetical stock, ticker PLV, to show the mechanics. None of the prices or times below describe an actual company.
PLV trades around $18.50 through the first hour of the session. At 10:12 AM ET, on a volume surge running roughly six times its average pace, PLV drops from $18.40 to $16.70 in under seven minutes, forming a steep flagpole decline. Over the following fifteen minutes, PLV drifts back up in a tight range between $16.85 and $17.05, printing small-bodied bars inside two narrow, roughly parallel lines tilted slightly upward, while volume fades steadily back toward its normal baseline.
At 10:33 AM, PLV breaks below $16.85, the flag's lower boundary, on a fresh pickup in volume running about three times the pace seen during the quiet bounce. That break is the entry trigger, and shares were already confirmed available to borrow before the trade was placed. A stop goes in just above $17.05, the high of the flag's range.
The flagpole measured $1.70 ($18.40 to $16.70), so the measured target from the $16.85 breakdown point projects to roughly $15.15. PLV reaches $16.10 by 10:55 AM, where a portion of the position is covered, with the remainder trailing behind the developing lower highs. PLV continues to $15.40 by 11:20 AM before volume tapers and the decline stalls, and the remaining position is covered near $15.55, short of the full measured target but capturing the bulk of the move that followed genuine, volume-confirmed continuation.
Managing a Short Position Once the Flag Breaks Down
The measured target is a reference point for scaling out, not a mechanical cover order. Genuine continuation keeps printing lower highs on sustained volume; a position that reaches the target while that structure stays intact has no particular reason to be covered early just because a projected number has been hit.
The clearer signal to cover is volume fading back toward normal without fresh lows forming, the same signature covered in the invalidation criteria above. A breakdown that runs hard for a few minutes and then goes quiet on thinning volume is behaving like a flag that's already given what it had to give. Given the squeeze risk covered above, this setup rewards a somewhat quicker trigger finger on covering into weakness than the equivalent long setup does on taking profit; a bounce that starts gaining volume rather than losing it deserves faster action on the short side than the mirror situation does on the long side.
Where This Strategy Fails: Squeezed Shorts and Fading Downside Volume
The most damaging failure is a squeeze, covered in detail above: a heavily-shorted or low-float name where the bounce inside the flag stops being orderly profit-taking and starts becoming forced, accelerating buying. Checking short interest and float before entering, not just the chart pattern, is the direct defense against this specific failure mode.
A second failure is trading a loose, choppy bounce as though it were a tight flag. The same tightness standard that applies to bull flags applies here; a wide, jagged consolidation that technically sits between two generously-drawn trendlines carries less reliability than a genuinely tight, orderly pause.
A third is a flagpole with nothing real behind it, a fast drop on thin volume rather than genuine broad selling. A steep decline without real participation is a weaker foundation for the whole pattern, since the setup's premise depends on real selling pressure needing a pause, not a proxy for one.
A fourth is breaking down on the same fading volume that defined the flag itself, an unconfirmed signal that's closer to a drift through a level than genuine resumption of the earlier selling, and exactly what this setup's invalidation criteria exist to filter out.
Locates, Borrow Costs, and Other Short-Selling Mechanics
Everything specific to shorting mechanically, confirming a locate before entry, understanding hard-to-borrow fees on low-float names, and how Rule 201's circuit breaker can restrict entries after a sharp enough decline, is covered in full in this hub's dedicated short-selling guide. That guide's mechanics apply directly to this pattern; this guide focuses on the flag-specific shape, psychology, and statistics rather than repeating that ground.
Scanning for Fresh Bear Flags Before the Breakdown
Spotting a genuine flagpole decline as it happens, then watching for the volume-fade signature that defines a real bear flag rather than random chop, is difficult to do manually across a watchlist in real time.
Trade Ideas works as a comprehensive scanning and research platform for this job, surfacing stocks making sharp, high-volume declines in real time and providing the built-in charting needed to watch whether the bounce that follows actually tightens up on fading volume the way a genuine bear flag should. The scan surfaces candidates with a real flagpole already in progress; confirming the tight, volume-fading bounce, borrow availability, and the entry trigger above still governs whether a position gets taken.
Fitting the Bear Flag Into a Complete Trading Plan
This setup mirrors the bull flag strategy covered elsewhere on this hub in shape and mechanics, with the squeeze risk and borrow considerations above as the meaningful differences that come from trading the short side specifically. It also assumes familiarity with chart pattern basics and reading volume, since volume behavior does as much work here as the shape itself.
The psychological trap specific to this setup is holding a losing short position too long out of a belief the decline "has to" resume, rather than respecting the invalidation criteria the moment a bounce starts gaining rather than losing volume. This hub's guide to staying patient and objective applies directly: patience means waiting for the volume-confirmed breakdown before entering, and it equally means covering quickly once the setup's own invalidation signal shows up, rather than hoping a squeeze reverses itself. This strategy belongs on the Strategies Hub as the short-side counterpart to the bull flag, carrying the same volume-first discipline plus the extra mechanical caution that comes with selling short.
Common Questions About Trading Bear Flags
Is a bear flag just a bull flag with the numbers flipped?
The statistics are close to mirror images (45% break-even failure and an 8% average decline for bear flags, versus 44% and 9% for bull flags), but the squeeze risk and short-selling mechanics, including borrow availability, make the two setups meaningfully different to actually trade.
Key Takeaway: The chart pattern is symmetric; the risk profile of shorting it isn't.
What is a short squeeze, and why does it matter for this setup specifically?
Checking a stock's short interest and float before shorting a bear flag is a direct, practical defense, since the squeeze risk concentrates specifically in names where a large share of the float is already sold short.
Key Takeaway: A bear flag on a heavily-shorted, low-float stock deserves more caution than the same pattern on a stock with normal short interest.
What is Regulation SHO's Rule 201, and how does it affect this setup?
A bear flag forming after a stock has already triggered this circuit breaker may not be shortable in the straightforward way this guide's entry trigger describes, which is worth checking before assuming the trade is executable as planned.
Key Takeaway: A sharp enough decline can restrict new short entries by regulation, independent of anything about the chart pattern itself.
Why does volume need to fade during the bounce inside a bear flag?
A bounce on rising or erratic volume is a different, less reliable signal, closer to genuine buying interest than a brief pause, and deserves less confidence as a continuation setup.
Key Takeaway: Fading volume during the bounce is part of the pattern's definition, not just a supporting detail.
How is the profit target set for a bear flag short?
This grounds the target in the specific move that created the pattern, functioning as a reference point for scaling out of the short rather than a mechanical, must-cover level.
Key Takeaway: Use the flagpole's own height as the basis for the target, not an arbitrary percentage.
Do bear flags perform differently than bull flags?
The bigger practical difference isn't the base statistics; it's the squeeze risk and short-selling mechanics that apply specifically to trading the pattern from the short side.
Key Takeaway: The pattern itself performs almost identically in both directions; the risk of trading it does not.
What should be confirmed before entering a bear flag short, beyond the chart pattern itself?
This hub's dedicated short-selling guide covers locate requirements and borrow costs in full, and treating that check as part of the setup specification, not an afterthought, avoids planning a trade around shares that turn out to be unavailable.
Key Takeaway: A clean chart pattern doesn't guarantee a clean execution on the short side.
How quickly should a losing bear flag short be covered?
Waiting to see if a strengthening bounce reverses itself, rather than respecting the invalidation signal immediately, is exactly the hesitation that turns an ordinary losing trade into a squeeze-driven one.
Key Takeaway: React faster to a strengthening bounce on a short than instinct might suggest is necessary.
What tool or filter would help find a fresh bear flag as it's forming?
Trade Ideas, covered earlier in this guide, handles this job, flagging strong intraday decliners as they happen and providing the charting needed to watch whether the bounce that follows tightens into a real flag.
Key Takeaway: The scan finds the flagpole; confirming the tight bounce, volume signature, and borrow availability still governs whether a short gets taken.
Disclaimer
Article Sources
- Flags, ThePatternSite.com - the primary source for flag identification criteria and downward-breakout performance statistics, including the 8% average decline and 45% break-even failure rate
- SEC, Short Sale Price Test Restrictions: A Small Entity Compliance Guide - the official SEC guidance explaining Regulation SHO Rule 201's short-sale circuit breaker
Was this helpful?
Be the first to weigh in

Written by
Kazi Mezanur RahmanFounder, independent researcher, and editor of DayTradingToolkit. A one-person publication focused on risk-first trading education and documented tool research. He trades his own capital as a retail trader and combines personal market experience with systematic primary-source research.
Keep Reading

Strategies
Trading Breakouts From Consolidation: The Volatility Contraction Pattern
The VCP isn't just a volatility squeeze. This guide covers the staged contraction sequence, the pivot point, and why context matters as much as the pattern.
Strategies
The Double Top / Double Bottom Trading Strategy
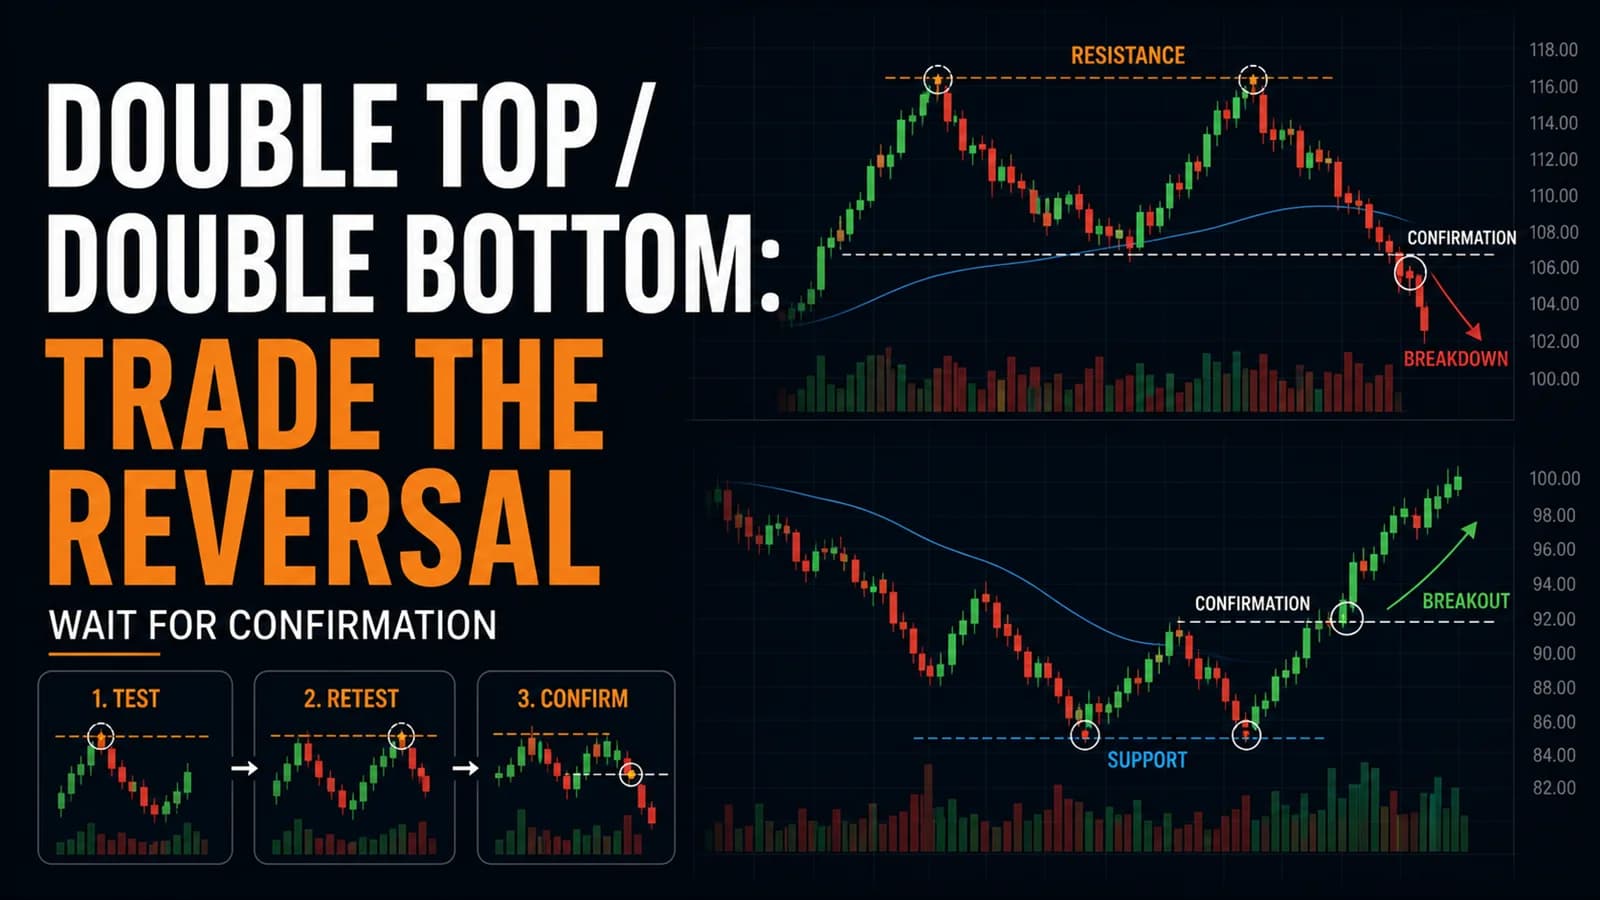
Most double tops never confirm. Here's the confirmation line that separates a real reversal from two random peaks, plus the honest failure rate behind each.
Strategies
The ABCD Pattern Trading Strategy: A Beginner-Friendly Setup
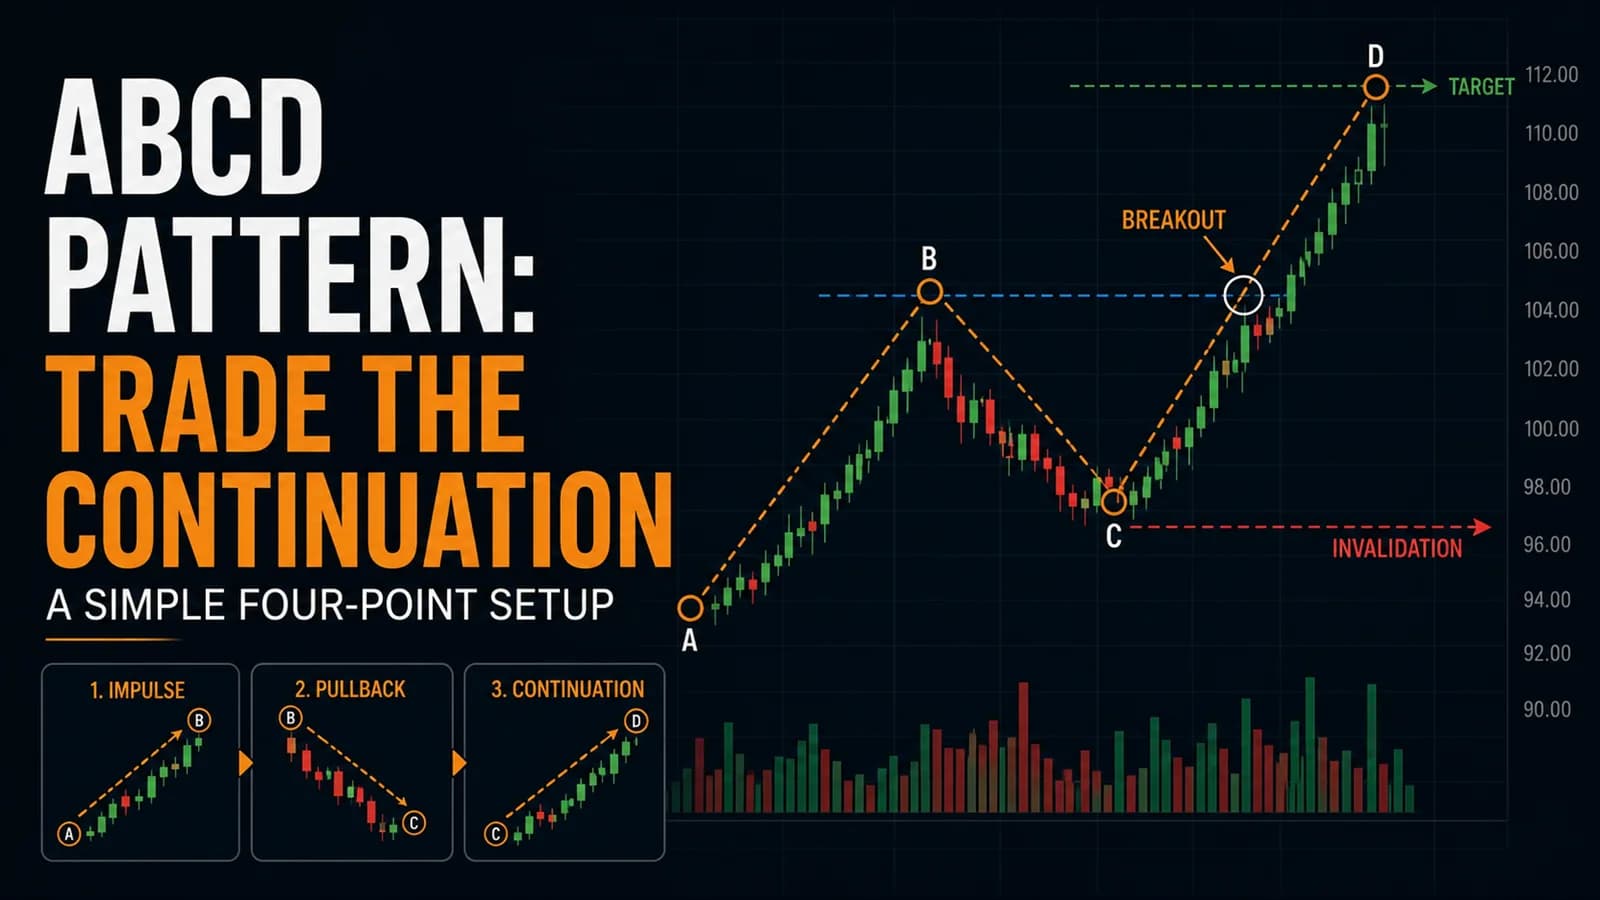
The ABCD pattern turns a messy pullback into a measured price target. Here's the mechanical version day traders actually use, including where it breaks down.
Strategies
The Head and Shoulders Trading Strategy (And Inverse H&S)
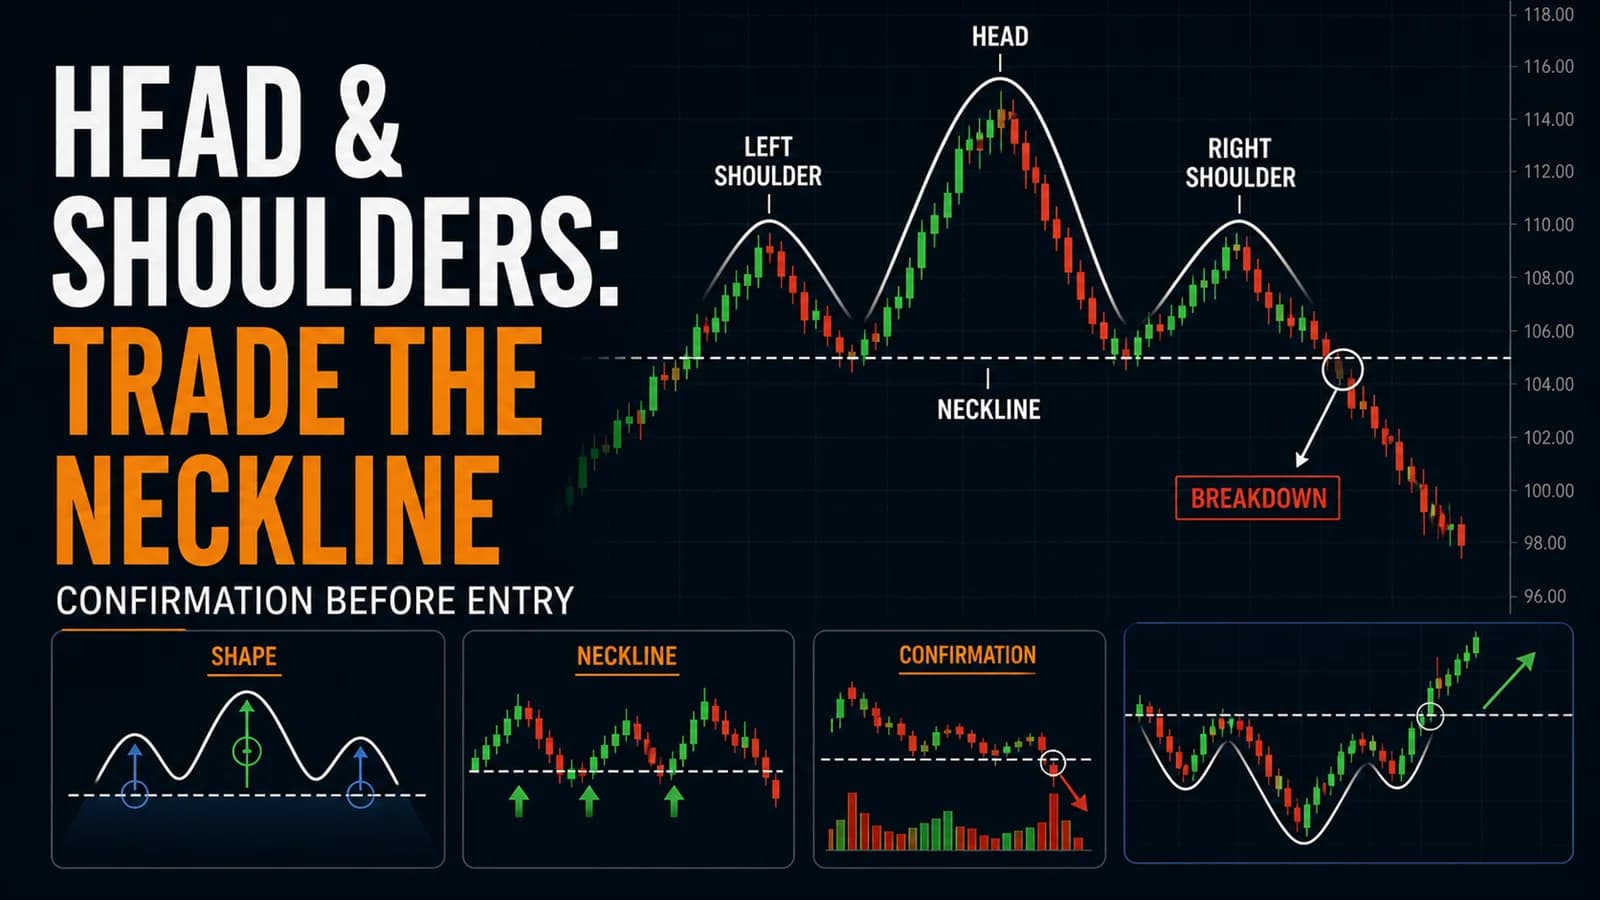
The most famous reversal pattern in trading is also one of the most misdiagnosed. Here's how to actually confirm it before the neckline breaks.
Comments
No comments yet. Be the first to share your thoughts.