
The Triangle Pattern Trading Strategy (Symmetrical, Ascending, Descending)

In this article11 sections
Most trading education teaches the descending triangle as a bearish pattern: a flat support line, a falling upper boundary, sellers pressing harder each time. Trade it short on the breakdown. That's the textbook version, and it's incomplete in a way that costs traders money, because the underlying research on this pattern shows it actually breaks out upward slightly more often than it breaks down.
That doesn't mean the descending triangle is secretly a bullish pattern. It means direction bias assumptions, taught with total confidence in most trading courses, deserve to be checked against real data before they're traded with real capital. This guide does that for the two triangle patterns intraday traders see most often.
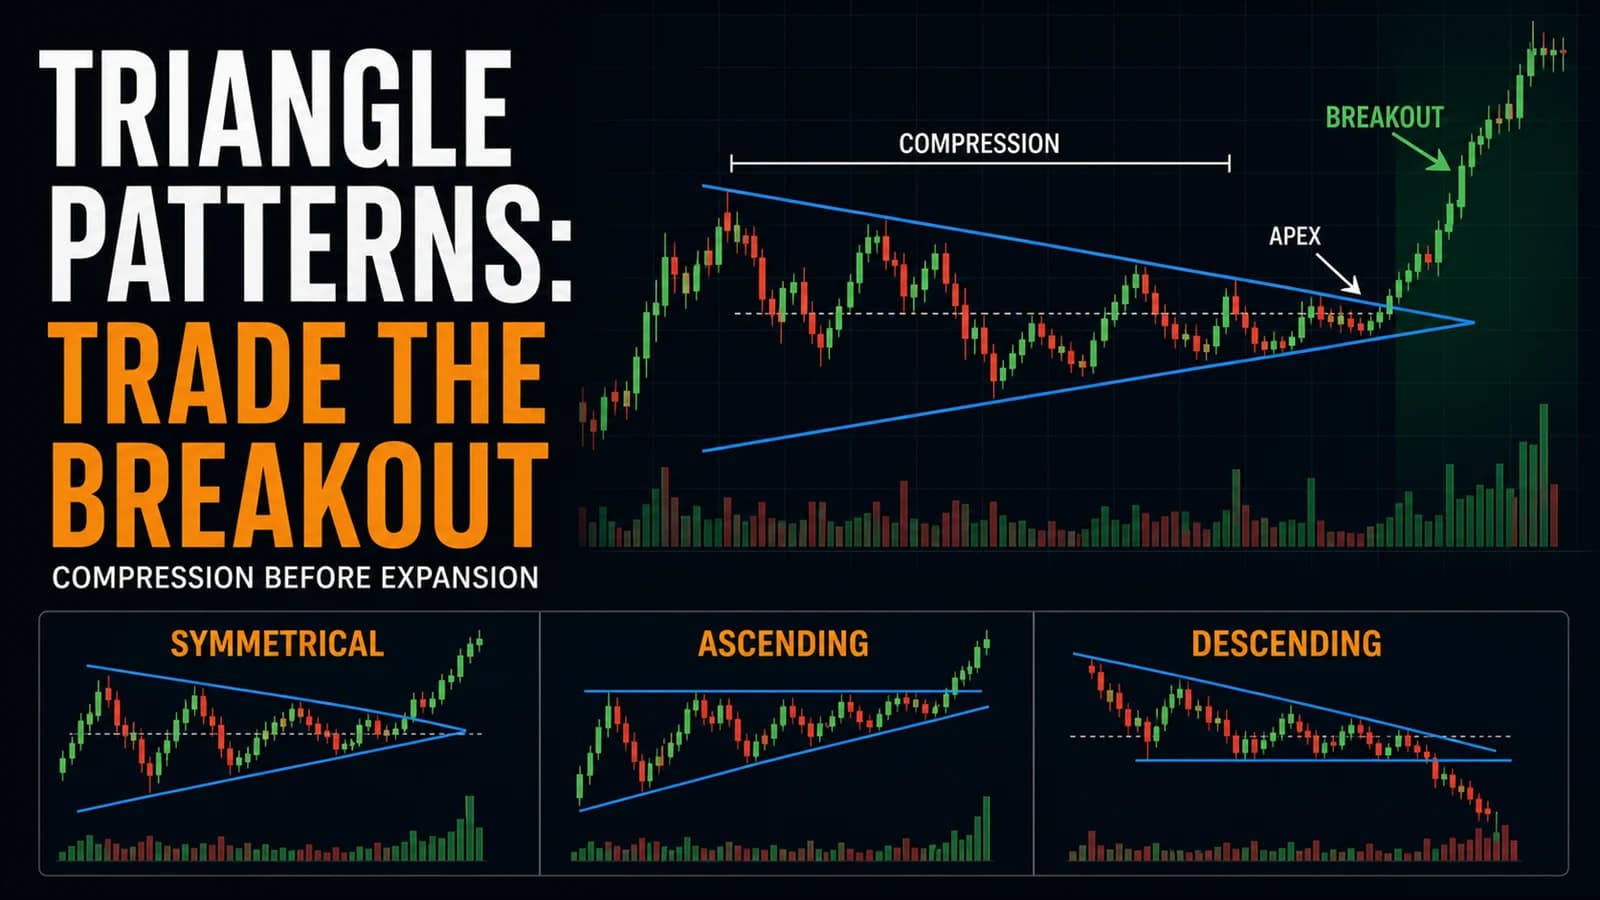
What is a triangle pattern? A triangle is a consolidation pattern formed by two converging trendlines that compress a stock's trading range over time. A symmetrical triangle has a falling upper boundary and a rising lower boundary meeting at an apex. A descending triangle has a flat lower boundary (support) and a falling upper boundary. Both resolve when price breaks through one of the two boundaries, ideally on rising volume.
Why Ascending Triangles Get Their Own Article, and This One Doesn't Repeat It
This hub already has a full deep dive on the ascending triangle, covered under its more common intraday name: the flat top breakout. That article covers the flat resistance line, rising support line, and the specific asymmetry between long and short trades on that particular shape in real depth, and repeating that material here would just be duplication with a different headline.
This article focuses on the two triangle shapes that flat top breakout doesn't cover: the symmetrical triangle, with both boundaries angled toward each other, and the descending triangle, with a flat support line instead of a flat resistance line. Both are meaningfully different setups from the ascending version, not just mirror images of it, and the data below explains why.
Reading a Triangle's Character Before It Resolves
Best conditions: Triangles form during genuine consolidation, periods where a stock is digesting a prior move rather than trending or reversing outright. A triangle that forms after a strong initial move (a "continuation triangle") tends to behave differently than one forming with no clear prior trend at all, and this hub's guide to trading breakouts from consolidation covers that continuation context in more depth.
Best time of day: Triangles need several touches of both boundaries to establish real structure, which typically means at least 45 minutes to 90 minutes of formation time intraday. A triangle rushed into existence in fifteen minutes on a 1-minute chart is more likely to be noise that happens to fit the shape than a genuine compression pattern.
Stock type: Works on both individual stocks and index products. Lower-float, more volatile stocks tend to produce triangles with wider, choppier boundaries that are harder to draw precisely; more liquid names produce cleaner, more tradeable versions.
Volume signature: A textbook triangle shows volume contracting as the pattern narrows toward its apex, then expanding sharply on the actual breakout candle. A triangle where volume stays flat or elevated throughout the consolidation, without the contraction, is a weaker version of the pattern and often just represents ordinary chop rather than a genuine narrowing of the trading range.
The Setup Specification: Symmetrical Triangle
- Component
- Market Conditions Required
- Rule
- Genuine consolidation with at least two touches of each boundary; volume contracting as the pattern narrows
- Component
- Time of Day
- Rule
- Formation over 45-90 minutes minimum; strongest breakouts confirm before 2:00 PM ET
- Component
- Stock Selection Criteria
- Rule
- Liquid enough for clean trendline touches; pattern width (measured at the pattern's widest point) at least 1.5-2% of the stock's price
- Component
- Entry Trigger
- Rule
- Candle closes beyond either boundary, on volume ≥ 1.5x the average of the prior ten bars
- Component
- Stop Loss
- Rule
- Below the most recent higher low (for an upward breakout) or above the most recent lower high (for a downward breakout), inside the triangle
- Component
- Initial Profit Target
- Rule
- Pattern's widest height added to (or subtracted from) the breakout point; scale a third to half at the 0.618x extension
- Component
- Trade Management
- Rule
- Trail below rising swing lows (long) or above falling swing highs (short) once the initial target zone is cleared
- Component
- Invalidation Criteria
- Rule
- Price closes back inside the triangle after an initial breakout; pattern reaches its apex without resolving (see below)
| Component | Rule |
|---|---|
| Market Conditions Required | Genuine consolidation with at least two touches of each boundary; volume contracting as the pattern narrows |
| Time of Day | Formation over 45-90 minutes minimum; strongest breakouts confirm before 2:00 PM ET |
| Stock Selection Criteria | Liquid enough for clean trendline touches; pattern width (measured at the pattern's widest point) at least 1.5-2% of the stock's price |
| Entry Trigger | Candle closes beyond either boundary, on volume ≥ 1.5x the average of the prior ten bars |
| Stop Loss | Below the most recent higher low (for an upward breakout) or above the most recent lower high (for a downward breakout), inside the triangle |
| Initial Profit Target | Pattern's widest height added to (or subtracted from) the breakout point; scale a third to half at the 0.618x extension |
| Trade Management | Trail below rising swing lows (long) or above falling swing highs (short) once the initial target zone is cleared |
| Invalidation Criteria | Price closes back inside the triangle after an initial breakout; pattern reaches its apex without resolving (see below) |
The Setup Specification: Descending Triangle
- Component
- Market Conditions Required
- Rule
- A flat, well-tested support line with a clearly falling upper boundary; at least two touches of the flat support
- Component
- Time of Day
- Rule
- Same 45-90 minute minimum formation window
- Component
- Stock Selection Criteria
- Rule
- Liquid enough for the flat support line to represent genuine, repeated buying interest rather than a single lucky bounce
- Component
- Entry Trigger
- Rule
- Candle closes beyond either boundary (the flat support or the falling resistance), on volume ≥ 1.5x the prior ten-bar average; note both directions are genuinely tradeable, covered below
- Component
- Stop Loss
- Rule
- Above the most recent lower high inside the triangle (downward breakout) or below the flat support line (upward breakout)
- Component
- Initial Profit Target
- Rule
- Pattern's widest height added to (upward) or subtracted from (downward) the breakout point; scale a third to half at the 0.618x extension
- Component
- Trade Management
- Rule
- Trail below the flat support line (long) once cleared, or above falling swing highs (short)
- Component
- Invalidation Criteria
- Rule
- Price closes back inside the pattern after breakout; flat support line breaks with no follow-through (a common bull-trap variant, covered below)
| Component | Rule |
|---|---|
| Market Conditions Required | A flat, well-tested support line with a clearly falling upper boundary; at least two touches of the flat support |
| Time of Day | Same 45-90 minute minimum formation window |
| Stock Selection Criteria | Liquid enough for the flat support line to represent genuine, repeated buying interest rather than a single lucky bounce |
| Entry Trigger | Candle closes beyond either boundary (the flat support or the falling resistance), on volume ≥ 1.5x the prior ten-bar average; note both directions are genuinely tradeable, covered below |
| Stop Loss | Above the most recent lower high inside the triangle (downward breakout) or below the flat support line (upward breakout) |
| Initial Profit Target | Pattern's widest height added to (upward) or subtracted from (downward) the breakout point; scale a third to half at the 0.618x extension |
| Trade Management | Trail below the flat support line (long) once cleared, or above falling swing highs (short) |
| Invalidation Criteria | Price closes back inside the pattern after breakout; flat support line breaks with no follow-through (a common bull-trap variant, covered below) |
Note the descending triangle's entry trigger explicitly covers both directions, which is deliberate and directly tied to the honest data in the next section. A trader who has only ever been taught to short descending triangles is trading with half the picture.
A Walk-Through: A Descending Triangle That Breaks the "Wrong" Way
Consider a mid-cap industrial stock, ticker XYZ, trading around $52.00 after a strong pre-market gap that fades through the first hour. From 10:05 AM ET, XYZ tests $50.20 and bounces to $51.60. At 10:41 AM, it tests $50.15, again bouncing, this time to $51.20. At 11:18 AM, a third test holds at $50.25, bouncing to $50.85. Three touches of a flat support line right around $50.15 to $50.25, with a clearly falling series of lower highs above it: $51.60, $51.20, $50.85. That's a textbook descending triangle.
Most traders watching this setup are already positioning for a breakdown, since that's what the pattern's name and most trading courses have taught them to expect. But volume on each of the three support tests has been declining, while the pattern has narrowed toward its apex around $50.20.
At 11:47 AM, instead of breaking the flat support, XYZ pushes through the falling upper boundary, closing a 5-minute candle at $50.70 on volume 2.3x the prior ten-bar average, an upward breakout. A trader following the full, both-directions Setup Specification above enters at $50.70, sets a stop below the most recent higher swing low inside the pattern at $50.25, a $0.45 risk per share, and calculates the target: pattern height of $1.35 ($51.60 minus $50.25) added to the $50.70 breakout, projecting toward $52.05.
XYZ runs to $51.90 by 1:20 PM, just short of the full projection but well past the 0.618x extension where a portion of the position was scaled out earlier. A trader who had only prepared for the downside break, based on the pattern's reputation rather than its actual documented behavior, would have missed this trade entirely, or worse, been positioned short into a genuine upward resolution.
Managing the Trade Once a Triangle Resolves
Direction bias should follow the data, not the pattern's name. The descending triangle's reputation as a purely bearish setup is strong enough that many traders never seriously prepare for the upward case, despite the underlying research showing upward breakouts occur roughly as often as downward ones. Preparing orders and levels for both directions before the breakout, rather than committing to a directional bias based on the pattern's label alone, is a meaningfully better approach.
A breakout very close to the triangle's apex is a weaker signal than one that resolves with room left in the pattern. As a triangle narrows toward its apex, the remaining room for a "real" breakout, as opposed to just the boundaries converging and forcing a resolution, shrinks. Breakouts happening in roughly the first two-thirds of a triangle's total time-to-apex tend to carry more conviction than ones that only resolve in the final stretch.
Throwback and pullback rates on triangles are high enough that a stop placed too tight will frequently get taken out on a normal retest. The next section covers the specific numbers, but the practical takeaway for trade management is the same one that shows up across most patterns in this hub: don't panic-exit a retest of the breakout level itself, only a genuine close back inside the pattern.
Where Triangle Patterns Fail
This is the section where triangles, despite being one of the most commonly taught chart patterns in all of retail trading education, deserve real honesty. Independent statistical research into the symmetrical triangle, based on Thomas Bulkowski's large-sample study of confirmed patterns on daily charts, found it to be one of the weaker-performing chart patterns studied overall, ranking near the bottom of the full pattern set for both upward and downward breakouts, despite the pattern's popularity and visual appeal. The research also found throwback and pullback rates above 60% in both directions, meaning a clear majority of triangle breakouts get retested before any sustained move develops.
The descending triangle performed somewhat better in that same research, with a meaningfully lower break-even failure rate than the symmetrical version, and the genuinely counterintuitive finding already covered above: upward breakouts occurred slightly more often than downward ones, directly contradicting the pattern's common "bearish" label. That same research also found the descending triangle's overall profitability has declined meaningfully since the 1990s, a reminder that even a well-documented pattern's edge isn't static over time. All of this data comes from multi-week daily-chart research, not the compressed intraday version this guide covers, so treat it as directional evidence about the pattern's real character rather than an exact intraday probability.
The practical failure mode this data points to is straightforward: a trader who only prepares to short descending triangles, or who assumes symmetrical triangles are a reliably high-probability pattern simply because they're widely taught, is trading against the pattern's own documented behavior. The single biggest edge available in this guide isn't a clever new entry trick; it's simply taking both directions seriously and sizing conviction based on the pattern's actual researched reliability rather than its reputation.
A second, more universal failure mode is trading a triangle that never had genuine two-way structure to begin with, meaning the "boundaries" were drawn loosely enough to fit almost any chop into a triangle shape after the fact. Requiring at least two genuine touches of each boundary, not just a rough visual approximation, is the clearest defense against this.
Variations Worth Knowing
The continuation triangle, forming after a strong prior trend rather than at an ambiguous point in the price action, tends to resolve in the direction of that prior trend more often than the base-rate statistics above would suggest, since it has directional momentum behind it that a triangle forming in isolation doesn't. This hub's volatility contraction pattern guide covers this continuation context specifically.
The expanding triangle, sometimes called a broadening formation, is the inverse structure: boundaries that widen rather than narrow over time. It reflects genuinely rising uncertainty and volatility rather than compression, and it's a meaningfully different, less reliable setup that doesn't share the same measured-move logic as the converging triangles covered in this guide.
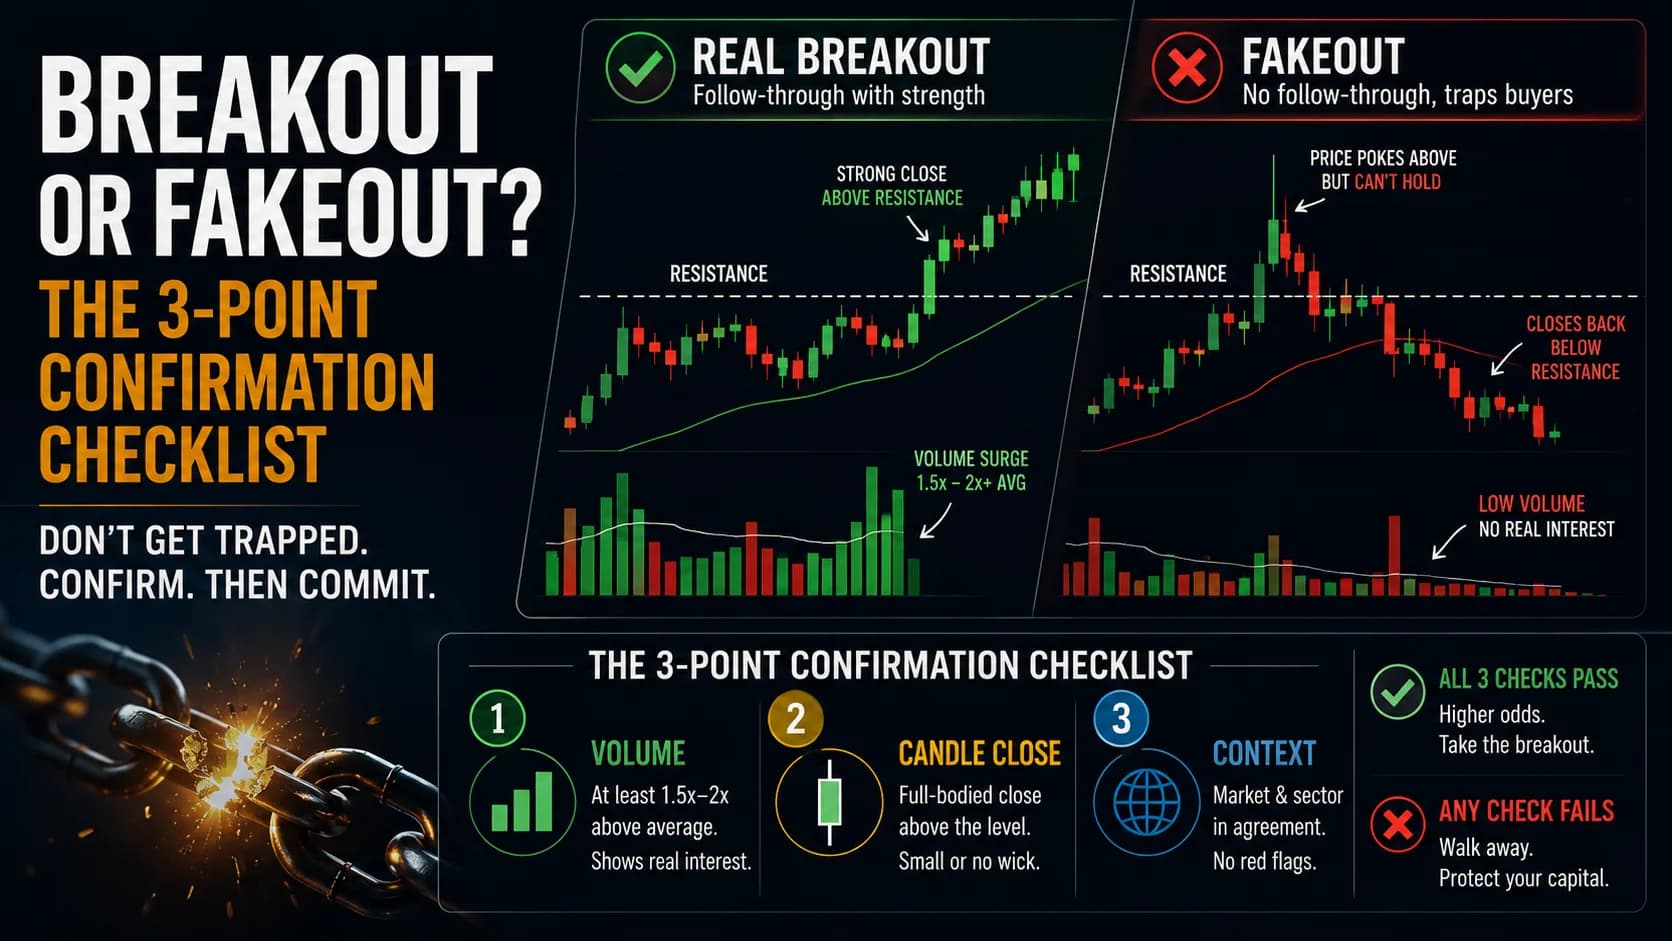
The failed triangle breakout, where price breaks one boundary and quickly reverses through the other, is itself tradeable in the opposite direction, similar to the false-breakout logic covered in this hub's breakout versus fakeout checklist.
Tools for Tracking a Triangle as It Narrows
Watching a stock's range compress in real time, across a full watchlist, is exactly the kind of pattern-recognition task a scanner handles better than a human eye scrolling through charts. Trade Ideas can be configured to flag stocks with contracting daily or intraday ranges, surfacing potential triangle candidates before the breakout, when there's still time to draw the boundaries and prepare orders for both directions. A charting platform with precise trendline tools matters more for triangles than for almost any other pattern in this hub, since both boundaries need to be drawn accurately for the entry trigger and target math to mean anything. For a broader comparison of scanning and charting tools, see the tools and reviews section.
How This Setup Fits a Complete Trading Plan
Triangles are a consolidation-reading tool, and they fit best in a trading plan that treats consolidation patterns as genuinely two-sided until proven otherwise, rather than assuming a directional bias from the shape's name alone. This connects directly to this hub's broader range-bound and choppy market coverage, since a triangle is fundamentally a specific, geometrically defined version of range compression.
Because the data above shows meaningfully different reliability between the symmetrical and descending versions, and between the two possible breakout directions within each, position sizing is a reasonable place to build in that nuance directly. A descending triangle's upward breakout, statistically the stronger of its two outcomes in the underlying research, is a defensible full-size setup under a trader's risk-per-trade plan; a symmetrical triangle's downward breakout, the weaker of its four total outcomes across both patterns, may warrant a reduced size even when the technical trigger fires cleanly.
Frequently Asked Questions
Why does the descending triangle break out upward more often than the textbook description suggests?
That repeated defense is real evidence about demand at that price. The underlying research bears this out: upward breakouts have occurred slightly more often than downward ones in large-sample studies of the pattern.
Key Takeaway: Treat the flat support line's repeated defense as real evidence of demand, not just a boundary waiting to break, and prepare for both breakout directions accordingly.
Is the symmetrical triangle worth trading at all, given how poorly it ranked in the research cited here?
A pattern ranking near the bottom of a large field of chart patterns studied doesn't mean it never works; it means the base rate of success is lower than more reliable formations covered elsewhere in this hub, like the cup and handle. Combining a symmetrical triangle with strong context, like forming as a continuation after a genuine prior trend, meaningfully improves the odds versus trading every symmetrical triangle indiscriminately.
Key Takeaway: Use the symmetrical triangle selectively, favoring continuation-context versions over ones with no clear prior trend, given its weaker documented base rate.
How many times does price need to touch each boundary before a triangle counts as valid?
A single touch on one side and multiple touches on the other suggests the "second boundary" may just be an approximate trendline drawn to fit the data, rather than a genuine, repeatedly tested level.
Key Takeaway: Require at least two real touches of each boundary before trusting a triangle's shape enough to trade its breakout.
What's the danger of trading a triangle breakout very close to the apex?
Breakouts this late in the pattern's life carry less conviction than ones that resolve with meaningful room still left before the apex.
Key Takeaway: Treat late-apex breakouts as lower-conviction than breakouts occurring earlier in the pattern's formation, even when the trigger technically fires.
How should a trader handle the high throwback and pullback rates documented for triangles?
The actual invalidation point should be a close back inside the triangle's boundaries, not merely a touch or brief dip back toward the breakout level.
Key Takeaway: Build the expectation of a retest into the trade plan from the start, and reserve the tighter, panic-driven stop adjustment for a genuine close back inside the pattern.
Do triangles work the same way on index ETFs as on individual stocks?
Broad index consolidation tends to reflect genuinely balanced aggregate buying and selling rather than one stock's idiosyncratic order flow. The same Setup Specification applies without modification.
Key Takeaway: Apply the same triangle rules to liquid index ETFs as to individual stocks, with an expectation of somewhat cleaner boundary structure.
What separates a genuine descending triangle from a stock just bouncing along its VWAP?
The specific combination of a flat support line and a falling resistance line, both tested multiple times, is what defines the pattern; simple VWAP-hugging chop doesn't meet that bar.
Key Takeaway: Confirm both a genuinely flat, tested support line and a clearly falling resistance line before labeling any sideways action a descending triangle.
Why does volume need to contract during the triangle's formation?
A triangle with flat or rising volume throughout its formation lacks that contrast, making the eventual breakout harder to distinguish from ordinary volatility.
Key Takeaway: Look for volume contraction during formation as a quality signal, since it's what makes the breakout candle's volume expansion meaningful by comparison.
How does a triangle differ from a wedge pattern?
This hub covers the wedge pattern separately, since the two shapes carry meaningfully different statistical behavior despite both being converging consolidation patterns.
Key Takeaway: Distinguish triangles from wedges by boundary direction, both angled toward each other or one flat for a triangle, both sloping the same way for a wedge, since their documented reliability differs.
Should position size differ between a symmetrical triangle trade and a descending triangle trade?
Both should still respect the same underlying risk-per-trade percentage of the account regardless of which pattern is being traded.
Key Takeaway: Let documented pattern reliability inform relative position sizing between setups, without ever exceeding a fixed maximum risk-per-trade regardless of which pattern is being traded.
Disclaimer
Article Sources
- StockCharts ChartSchool: Chart Patterns - reference library covering classic consolidation pattern structures
- StockCharts ChartSchool: Introduction to Candlesticks - foundational reading on reading price bars within a consolidation range
- FINRA: Understanding the New Intraday Margin Requirements - current regulatory framework for day-trading accounts
- FINRA Rule 2270: Day-Trading Risk Disclosure Statement - regulatory baseline for day-trading risk disclosure
- CME Group: Futures — Looking Beyond Technical Analysis - exchange-level perspective on the limits of pattern-based analysis
Was this helpful?
Be the first to weigh in

Written by
Kazi Mezanur RahmanFounder, independent researcher, and editor of DayTradingToolkit. A one-person publication focused on risk-first trading education and documented tool research. He trades his own capital as a retail trader and combines personal market experience with systematic primary-source research.
Keep Reading

Strategies
Trading Breakouts From Consolidation: The Volatility Contraction Pattern
The VCP isn't just a volatility squeeze. This guide covers the staged contraction sequence, the pivot point, and why context matters as much as the pattern.
Strategies
The Breakout vs. Fakeout Strategy: Our 3-Point Checklist
Not every break of resistance is real. This guide covers the volume, candle-close, and context checks that separate a genuine breakout from a costly trap.

Strategies
Trading Choppy Markets: A Pro Trader's Survival Guide
Choppy markets chew through accounts fast. This guide covers reading real chop with ADX, when standing aside is the trade, and how to fade range edges safely.

Strategies
Trading the Breakout of Prior-Day High/Low Levels
PDH and PDL need no formula, just yesterday's range. This guide covers the breakout, the liquidity-sweep fade, and why stops cluster right at these levels.
Comments
No comments yet. Be the first to share your thoughts.