
The Wedge Pattern Trading Strategy: Rising and Falling Wedges

In this article11 sections
A stock grinds higher for forty minutes, but each successive high comes with a little less momentum than the last, and each pullback holds at a slightly higher low, so the whole structure narrows into a rising, tightening wedge. Most trading courses teach this shape as a reliable bearish reversal setup. The underlying statistical research on this pattern tells a less flattering story, one worth knowing before sizing a trade around it.
That doesn't mean wedges are worthless. It means this is a pattern where the honest version of the strategy looks different from the confident version taught in most retail trading content, and this guide is built around the honest version.
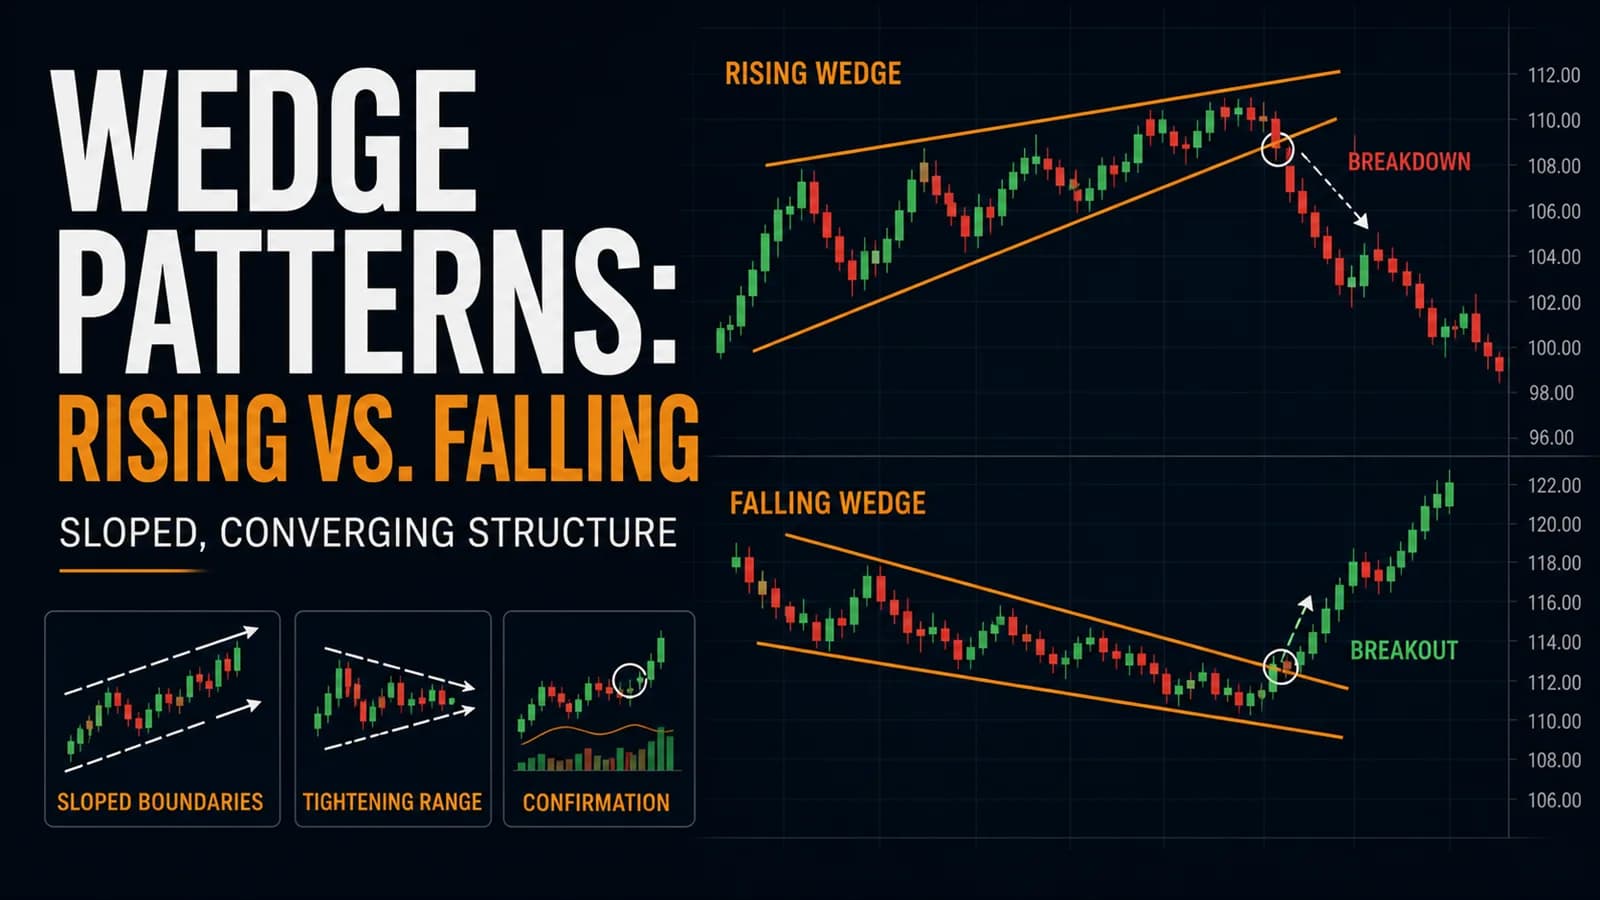
What is a wedge pattern? A wedge is a converging consolidation pattern where both boundary lines slope in the same direction. A rising wedge has both an upward-sloping support line and an upward-sloping resistance line, narrowing as price grinds higher, and is typically treated as a bearish signal. A falling wedge has both boundaries sloping downward, narrowing as price grinds lower, and is typically treated as a bullish signal.
What Actually Separates a Wedge From a Triangle
The distinction matters because the two patterns carry different implications despite looking superficially similar. This hub's triangle pattern guide covers patterns where the boundaries converge from opposite directions, one rising and one falling for a symmetrical triangle, or one flat and one angled for ascending and descending versions. A wedge is different: both boundaries slope in the same direction, which means the entire pattern is drifting, not just narrowing.
That drift is exactly why wedges are conventionally read as exhaustion signals rather than neutral consolidation. A rising wedge still makes higher highs and higher lows, technically still an uptrend by the most basic definition, but the narrowing range means each new high is a smaller advance than the last, and each new low doesn't retrace as much either. It's a trend that's visibly losing its own momentum even while nominally continuing.
When Wedges Actually Form Intraday
Best conditions: Wedges tend to form after an already-extended move, not from a flat, directionless start. A rising wedge following a strong initial rally, and a falling wedge following a sharp initial decline, both fit the exhaustion narrative the pattern is built around. A wedge with no real prior move behind it is a weaker, less interpretable version of the setup.
Best time of day: Like triangles, wedges need real time to establish a genuine converging structure, typically 45 to 90 minutes at minimum intraday. A wedge shape that appears in the final twenty minutes of a session, forced by shrinking end-of-day liquidity rather than genuine buyer or seller exhaustion, shouldn't be trusted the same way.
Stock type: Both variants can form on any liquid name, but low-float stocks in the middle of a parabolic run frequently produce rising wedges as the move matures, since each new wave of buyers is smaller than the last while the stock still grinds to fresh highs. This makes the rising wedge a particularly relevant pattern for the parabolic reversal short strategy covered elsewhere in this hub.
Volume signature: A genuine wedge shows declining volume as the pattern narrows, mirroring the exhaustion story in the price action itself. Rising volume within a narrowing wedge is a contradiction worth taking seriously; it suggests the move may have more genuine conviction left than the price structure alone implies.
The Setup Specification: Rising Wedge
- Component
- Market Conditions Required
- Rule
- A prior extended rally with both boundaries sloping upward; declining volume as the pattern narrows
- Component
- Time of Day
- Rule
- Formation over 45-90 minutes minimum; treat late-session (after 2:30 PM ET) wedges with extra caution
- Component
- Stock Selection Criteria
- Rule
- Liquid enough for clean trendline touches on both boundaries; at least two touches of each
- Component
- Entry Trigger
- Rule
- Candle closes below the lower (support) boundary, on volume ≥ 1.5x the average of the prior ten bars, for the downward breakout; a close above the upper boundary confirms the less common but statistically stronger upward continuation
- Component
- Stop Loss
- Rule
- Above the most recent lower high inside the wedge (downward breakout) or below the most recent higher low (upward breakout)
- Component
- Initial Profit Target
- Rule
- Pattern's widest height subtracted from (downward) or added to (upward) the breakout point, sized down given the weak average move documented below; scale aggressively, half or more, at the first meaningful extension
- Component
- Trade Management
- Rule
- Trail tightly given documented high pullback rates; move to breakeven quickly on confirmation of direction
- Component
- Invalidation Criteria
- Rule
- Price closes back inside the wedge after breakout; a downward breakout that immediately reverses back above the upper boundary, a specific and well-documented failure pattern covered below
| Component | Rule |
|---|---|
| Market Conditions Required | A prior extended rally with both boundaries sloping upward; declining volume as the pattern narrows |
| Time of Day | Formation over 45-90 minutes minimum; treat late-session (after 2:30 PM ET) wedges with extra caution |
| Stock Selection Criteria | Liquid enough for clean trendline touches on both boundaries; at least two touches of each |
| Entry Trigger | Candle closes below the lower (support) boundary, on volume ≥ 1.5x the average of the prior ten bars, for the downward breakout; a close above the upper boundary confirms the less common but statistically stronger upward continuation |
| Stop Loss | Above the most recent lower high inside the wedge (downward breakout) or below the most recent higher low (upward breakout) |
| Initial Profit Target | Pattern's widest height subtracted from (downward) or added to (upward) the breakout point, sized down given the weak average move documented below; scale aggressively, half or more, at the first meaningful extension |
| Trade Management | Trail tightly given documented high pullback rates; move to breakeven quickly on confirmation of direction |
| Invalidation Criteria | Price closes back inside the wedge after breakout; a downward breakout that immediately reverses back above the upper boundary, a specific and well-documented failure pattern covered below |
The Setup Specification: Falling Wedge
- Component
- Market Conditions Required
- Rule
- A prior decline with both boundaries sloping downward; declining volume as the pattern narrows
- Component
- Time of Day
- Rule
- Same 45-90 minute minimum formation window
- Component
- Stock Selection Criteria
- Rule
- Liquid enough for clean trendline touches; at least two touches of each boundary
- Component
- Entry Trigger
- Rule
- Candle closes above the upper (resistance) boundary, on volume ≥ 1.5x the prior ten-bar average, for the more common and statistically favored upward breakout
- Component
- Stop Loss
- Rule
- Below the most recent higher low inside the wedge
- Component
- Initial Profit Target
- Rule
- Pattern's widest height added to the breakout point; scale a third to half at the 0.618x extension given documented high throwback rates
- Component
- Trade Management
- Rule
- Trail below rising swing lows once the initial target zone is cleared
- Component
- Invalidation Criteria
- Rule
- Price closes back inside the wedge after an upward breakout
| Component | Rule |
|---|---|
| Market Conditions Required | A prior decline with both boundaries sloping downward; declining volume as the pattern narrows |
| Time of Day | Same 45-90 minute minimum formation window |
| Stock Selection Criteria | Liquid enough for clean trendline touches; at least two touches of each boundary |
| Entry Trigger | Candle closes above the upper (resistance) boundary, on volume ≥ 1.5x the prior ten-bar average, for the more common and statistically favored upward breakout |
| Stop Loss | Below the most recent higher low inside the wedge |
| Initial Profit Target | Pattern's widest height added to the breakout point; scale a third to half at the 0.618x extension given documented high throwback rates |
| Trade Management | Trail below rising swing lows once the initial target zone is cleared |
| Invalidation Criteria | Price closes back inside the wedge after an upward breakout |
The reduced target sizing and more aggressive scaling built into both tables above isn't a stylistic choice. It's a direct response to the underlying research on this specific pattern, covered in full below, and it's the single most important adjustment a trader should make relative to how this pattern is typically taught.
A Walk-Through: A Rising Wedge That Behaves Exactly as the Research Predicts
Consider a small-cap biotech stock, ticker XYZ, running hard on a catalyst from the pre-market open. By 9:45 AM ET, it's at $8.20, up from a $6.10 pre-market base. The stock continues higher but with progressively smaller advances: a push to $8.90 by 10:05 AM, a pullback to $8.55, a push to $9.15 by 10:28 AM (a smaller advance than the first leg), a pullback to $8.80 (a higher low than the prior pullback), and a final push to $9.35 by 10:51 AM, the smallest advance yet. Both the rising highs and rising lows are narrowing toward each other: a textbook rising wedge, with volume also declining across each successive push.
At 11:04 AM, a 5-minute candle closes at $8.95, below the wedge's lower boundary (running roughly through the $8.55 and $8.80 pullback lows), on volume 1.7x the prior ten-bar average. A trader entering the short at $8.95 sets a stop above the most recent lower high inside the wedge at $9.15, a $0.20 risk per share, deliberately tight given this pattern's documented weak average move on downward breaks.
Consistent with the underlying research on this exact scenario, the decline that follows is real but modest: XYZ drops to $8.55 by 11:40 AM, a decline of about 4.5% from the breakdown point, well short of what a trader used to more powerful reversal patterns like a head and shoulders top might expect. A trader who scaled out aggressively near the first meaningful support level, rather than holding for a much larger projected target, captured a clean, if modest, gain. A trader who held for a bigger move, expecting this pattern to behave like a stronger reversal setup, gave back most of the open profit as XYZ based and turned back higher within the hour.
Managing the Trade: Why This Pattern Demands Faster Profit-Taking
Take profit meaningfully earlier and more aggressively on wedge breakouts than on most other patterns in this hub. This isn't general caution; it's a direct response to documented average moves on wedge breakouts that run smaller than most traders expect going in, covered with specific numbers in the next section. A trader applying the same patient, let-it-run approach used on a cup and handle or head and shoulders setup to a wedge breakout is very likely to give back an open profit waiting for a move that the pattern rarely produces at full size.
Watch specifically for a downward breakout on a rising wedge that quickly reverses back above the upper boundary. This is a well-documented failure mode for this exact pattern, and it often produces a sharp move in the opposite direction as short sellers who entered on the initial breakdown are forced to cover. A trader who's aware this specific reversal risk exists can either avoid holding the short through a failed breakdown or flip to trading the reversal itself once it's confirmed.
On the more favorable falling wedge upward breakout, the high documented throwback rate means expecting, not fearing, a retest of the breakout level. As with triangles, the actual invalidation point is a close back inside the wedge's boundaries, not a mere touch of the breakout level on the way to a genuine continuation higher.
Where Wedge Patterns Fail
This is the section that separates this guide from how wedges are typically taught, and it deserves to be stated plainly rather than softened. Independent statistical research into the rising wedge, based on Thomas Bulkowski's large-sample study of confirmed patterns on daily charts, found that while downward breakouts occur more often than upward ones, consistent with the pattern's bearish reputation, the average decline following those downward breakouts was small, and the pattern's downward breakout ranked dead last among all chart pattern types studied for performance. Upward breakouts on a rising wedge, while less common, actually performed considerably better in that same research, an outcome that directly contradicts how the pattern is conventionally taught.
The falling wedge fared little better on the bullish side of its own reputation. That same body of research found the falling wedge's upward breakout, the direction it's specifically taught to signal, ranked poorly among bullish chart patterns overall, with the researcher's own conclusion describing it as a weak performer relative to other bullish setups, despite modest average gains and a real, if unremarkable, break-even failure rate. Both findings come from multi-week daily-chart research, not the intraday version this guide covers, but the lesson translates directly: neither wedge variant is the high-conviction setup its popular reputation suggests, and sizing and target expectations should reflect that honestly rather than assuming this pattern performs like a head and shoulders or cup and handle.
The practical failure mode this data points to is a trader treating a wedge breakout with the same target expectations as a stronger pattern, holding for a large projected move that the underlying research shows rarely materializes at full size, and giving back real, achievable gains in the process. The Setup Specification's built-in aggressive early scaling exists specifically to counter this.
A second, more universal failure mode is drawing wedge boundaries too loosely, forcing a same-direction slope onto what's really just ordinary trending price action with normal pullbacks. Requiring genuine touches of both boundaries, and genuinely narrowing range between them, filters out a meaningful share of shapes that only resemble a wedge in hindsight.

Variations Worth Knowing
The wedge as a continuation pattern, rather than a reversal signal, occurs when a rising wedge forms within a broader downtrend (a corrective bounce that narrows before resuming lower) or a falling wedge forms within a broader uptrend (a corrective dip that narrows before resuming higher). These continuation versions are a genuinely different read than the reversal framing this guide has focused on, and context, what the wedge is correcting within, matters as much as the wedge's own shape.
The broadening wedge, where boundaries widen rather than narrow, is a fundamentally different, higher-volatility pattern that doesn't share this guide's measured-move logic or its research-backed caution about target sizing.
The failed wedge reversal, similar to the failed triangle breakout covered elsewhere in this hub, is itself tradeable in the direction opposite the initial break, and connects to this hub's failed breakout, bull trap, and bear trap guide for the broader mechanics of that reversal-of-a-reversal trade.
Tools for Spotting a Wedge as It Narrows
A scanner that flags stocks with narrowing intraday ranges after an extended move, like Trade Ideas, helps surface wedge candidates while there's still time to draw both boundaries and prepare for the honest, research-informed version of this trade rather than reacting to the breakout after the fact. A charting platform with precise trendline tools is essential here, as with triangles, since the entry, stop, and reduced target sizing all depend on the boundaries being drawn accurately. For a broader comparison of charting and scanning tools, see the tools and reviews section.
How This Setup Fits a Complete Trading Plan
Given the documented, researched weakness in both wedge variants relative to their popular reputation, this pattern fits best in a trading plan as a smaller-size, faster-exit setup rather than a core, patient, let-it-run position. That's a genuinely different role than patterns like the cup and handle or head and shoulders occupy in this hub's broader Chart Pattern Playbook, and treating every pattern with the same size and hold-time expectations is a mistake this guide wants to specifically head off.
The 1% risk-per-trade framework still applies as the ceiling, but within that ceiling, a trader has real discretion to size a wedge trade toward the smaller end of their normal range, and to plan for a faster, earlier exit from the outset rather than deciding to take profit early only after the trade is already open and momentum has stalled.
Frequently Asked Questions
If the research shows wedges underperform their reputation, why does this guide cover them at all?
Downward breakouts are still more common on rising wedges, and upward breakouts are still more common on falling wedges, just with smaller average moves and lower reliability than more traditionally strong patterns. A trader who sizes and manages the trade honestly, rather than expecting head-and-shoulders-level conviction, can still trade this pattern productively.
Key Takeaway: Trade wedges with reduced size and faster profit-taking rather than avoiding them entirely, given their real but modest documented edge.
Why did the rising wedge's downward breakout rank so poorly in the underlying research despite being the "textbook" direction?
A high frequency of a particular outcome and a strong average magnitude of that outcome are two different things, and this pattern is a clear case where the frequency is there but the magnitude generally isn't.
Key Takeaway: Don't conflate a pattern's most common outcome with its most profitable one; check both before sizing a trade around either wedge variant.
What's the practical difference in how a trader should manage a rising wedge versus a falling wedge?
A rising wedge's downward breakout, the more common outcome, calls for tight risk and fast, meaningful profit-taking given its documented small average decline. A falling wedge's upward breakout, also the more common outcome for that pattern, allows for slightly more patience, though even that direction underperformed other bullish patterns in the underlying research.
Key Takeaway: Manage both wedge variants more conservatively on target expectations than stronger patterns like the cup and handle, with the rising wedge's downward break requiring the fastest exits of the two.
How can a trader tell a rising wedge apart from a normal, healthy uptrend?
A healthy uptrend typically shows advances and pullbacks of roughly similar or even increasing magnitude over time, reflecting sustained conviction. A rising wedge shows each successive advance getting smaller, even as the trend technically continues to make higher highs and higher lows.
Key Takeaway: Look for shrinking advance size within an ongoing uptrend, not just the presence of higher highs and higher lows, before labeling it a rising wedge.
Should a trader take the less common breakout direction on a wedge if that's the direction with better documented performance?
A reasonable middle ground is trading both directions when they trigger, but sizing and target expectations according to which direction the underlying research favors for that specific wedge type.
Key Takeaway: Trade whichever direction actually triggers, but weight size and target expectations by the documented performance difference between the two possible outcomes.
Does the wedge pattern's poor documented performance apply equally across all stock types?
What does translate is the underlying lesson: don't assume this pattern carries the same reliability as stronger, better-performing formations, regardless of what specific stock it's forming on.
Key Takeaway: Apply the general lesson of reduced target expectations broadly, while recognizing the specific documented numbers come from a general stock sample, not a small-cap or low-float-specific study.
What role does volume play in confirming a wedge breakout versus a triangle breakout?
The distinguishing factor between the two patterns isn't the volume confirmation logic, it's the boundary geometry and, as covered throughout this guide, the wedge's weaker documented average move once that breakout occurs.
Key Takeaway: Apply the same volume-expansion confirmation standard to wedges as to triangles, but temper target expectations specifically for the wedge given its weaker documented performance.
Can a rising wedge appear at the bottom of a downtrend rather than the top of an uptrend?
A corrective bounce within an ongoing decline that narrows before the downtrend resumes is a meaningfully different interpretation than the exhaustion-at-the-top framing this guide has focused on, and the surrounding trend context should always be checked before assuming a rising wedge is signaling a top.
Key Takeaway: Check the broader trend context before interpreting any wedge; the same shape means something different at the top of a rally than in the middle of a decline.
How tight should the stop be on a wedge trade compared to a triangle trade?
A wide stop sized for a large expected move doesn't make sense on a pattern whose own underlying data shows that large move is the exception rather than the rule; the risk taken on should be proportional to the realistic reward the pattern tends to deliver.
Key Takeaway: Size the stop on a wedge trade tighter than on a triangle or head and shoulders trade, reflecting this pattern's smaller documented average move.
Is there a version of this pattern with better documented reliability worth learning instead?
That doesn't mean skipping wedges entirely, since they still offer real, tradeable setups, but a trader building a core pattern-based approach may reasonably lean more heavily on those stronger-performing formations.
Key Takeaway: Treat wedges as a smaller, faster-exit piece of a broader pattern toolkit rather than a core setup, and lean more heavily on this hub's higher-reliability patterns for larger, more patient trades.
Disclaimer
Article Sources
- StockCharts ChartSchool: Chart Patterns - reference library covering classic consolidation pattern structures
- StockCharts ChartSchool: Introduction to Candlesticks - foundational reading on price-bar behavior within a converging structure
- FINRA: Understanding the New Intraday Margin Requirements - current regulatory framework for day-trading accounts
- FINRA Rule 2270: Day-Trading Risk Disclosure Statement - regulatory baseline for day-trading risk disclosure
- CME Group: Futures — Looking Beyond Technical Analysis - exchange-level perspective on the limits of pattern-based analysis
Was this helpful?
Be the first to weigh in

Written by
Kazi Mezanur RahmanFounder, independent researcher, and editor of DayTradingToolkit. A one-person publication focused on risk-first trading education and documented tool research. He trades his own capital as a retail trader and combines personal market experience with systematic primary-source research.
Keep Reading

Strategies
Trading Breakouts From Consolidation: The Volatility Contraction Pattern
The VCP isn't just a volatility squeeze. This guide covers the staged contraction sequence, the pivot point, and why context matters as much as the pattern.
Strategies
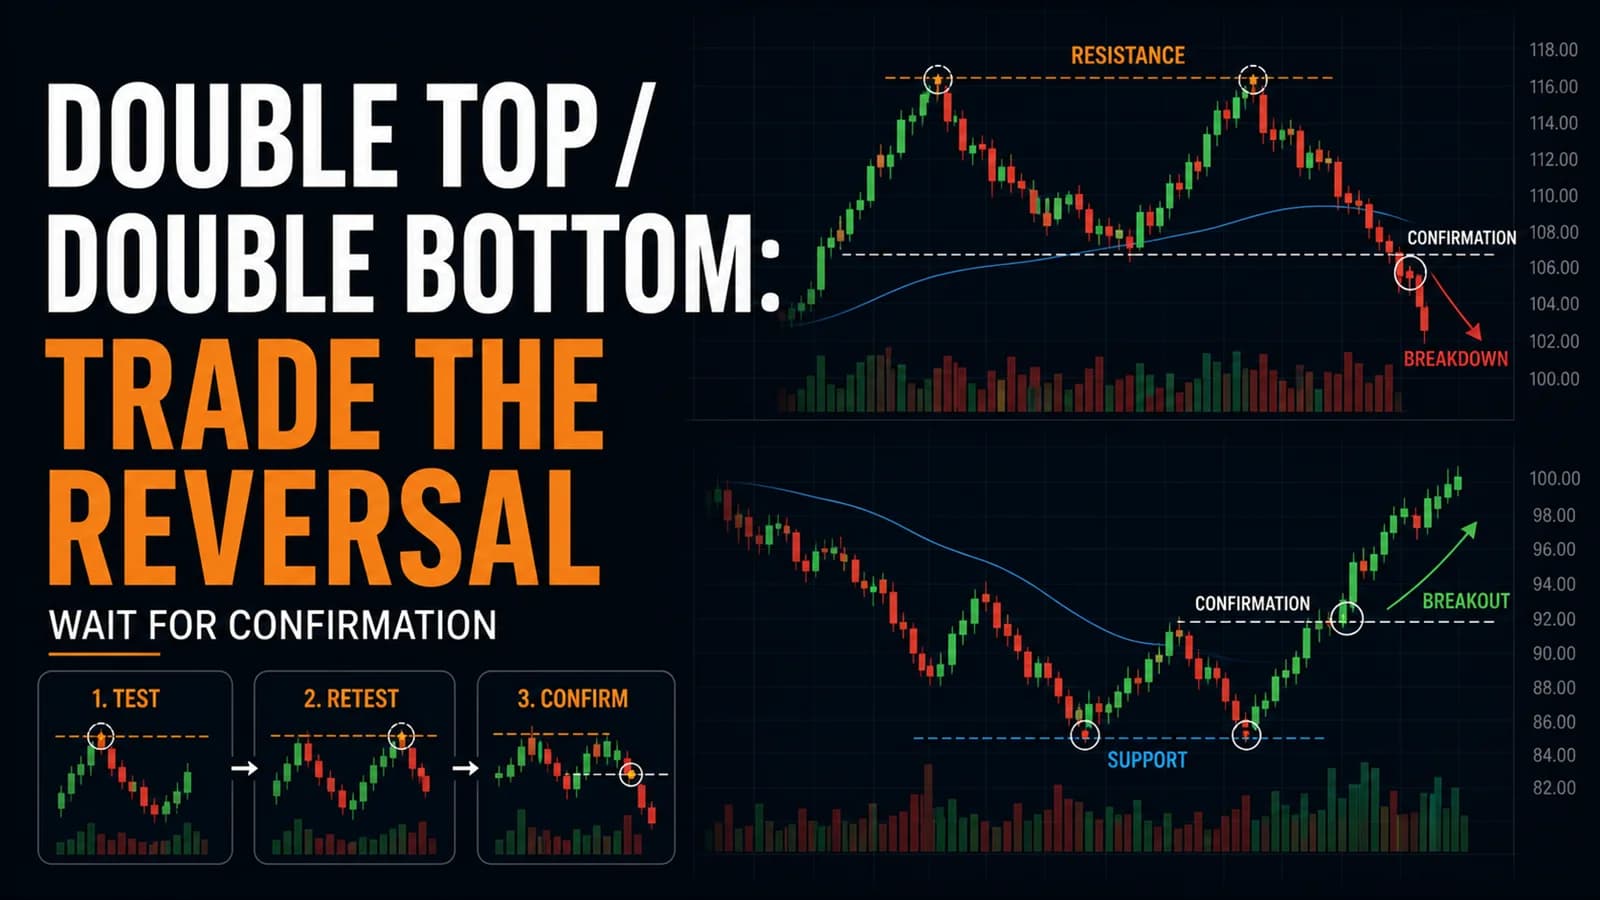
The Double Top / Double Bottom Trading Strategy
Most double tops never confirm. Here's the confirmation line that separates a real reversal from two random peaks, plus the honest failure rate behind each.
Strategies
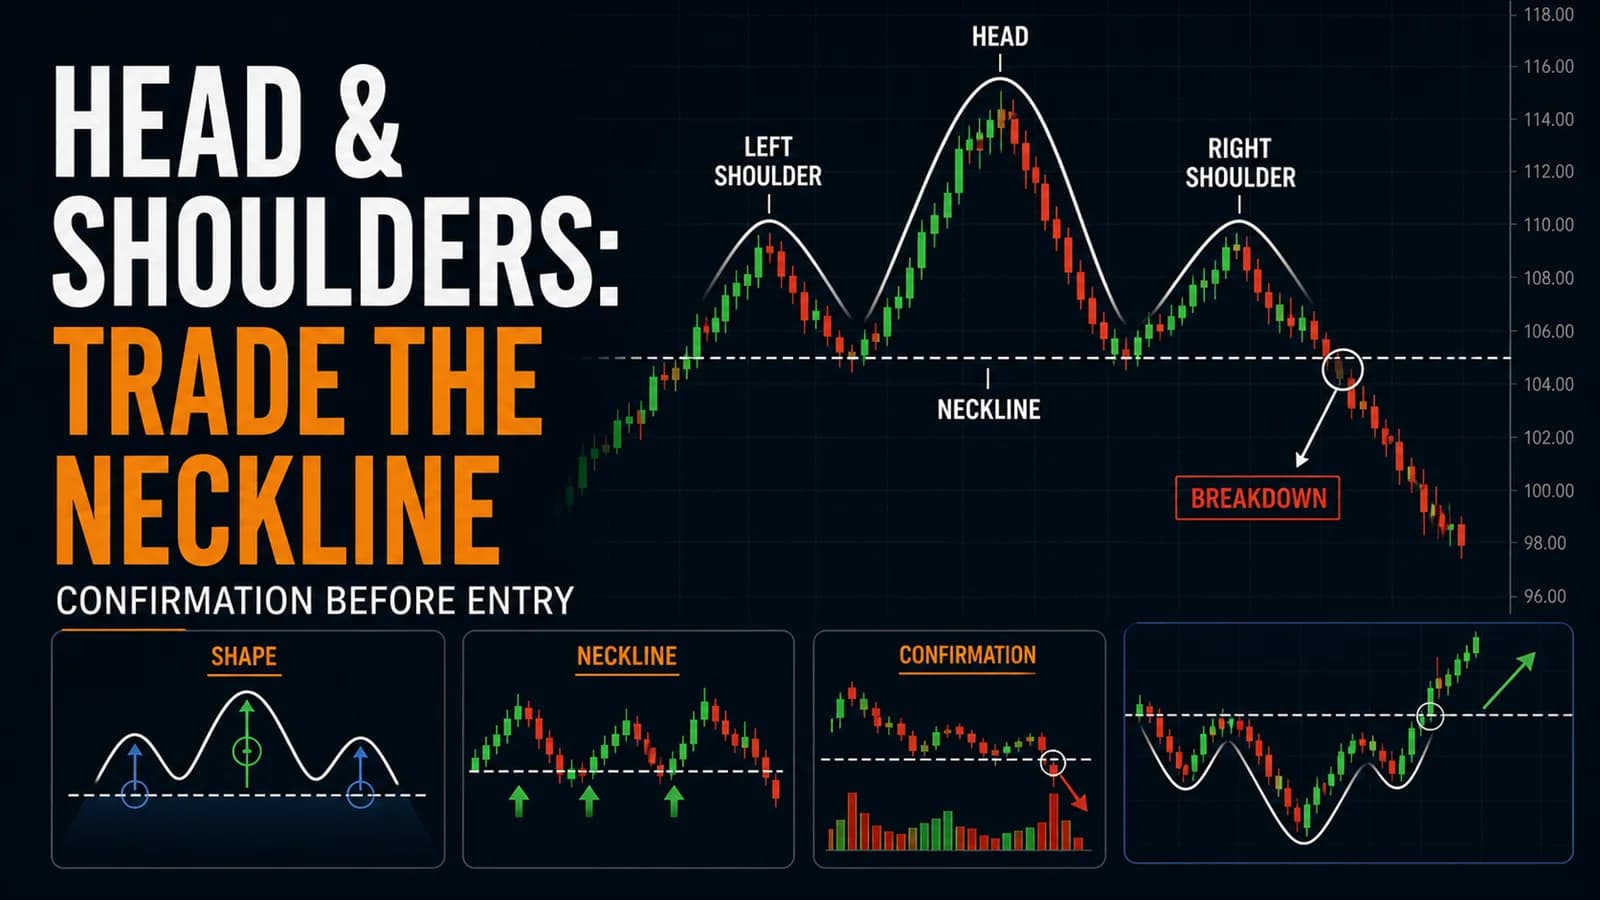
The Head and Shoulders Trading Strategy (And Inverse H&S)
The most famous reversal pattern in trading is also one of the most misdiagnosed. Here's how to actually confirm it before the neckline breaks.
Strategies
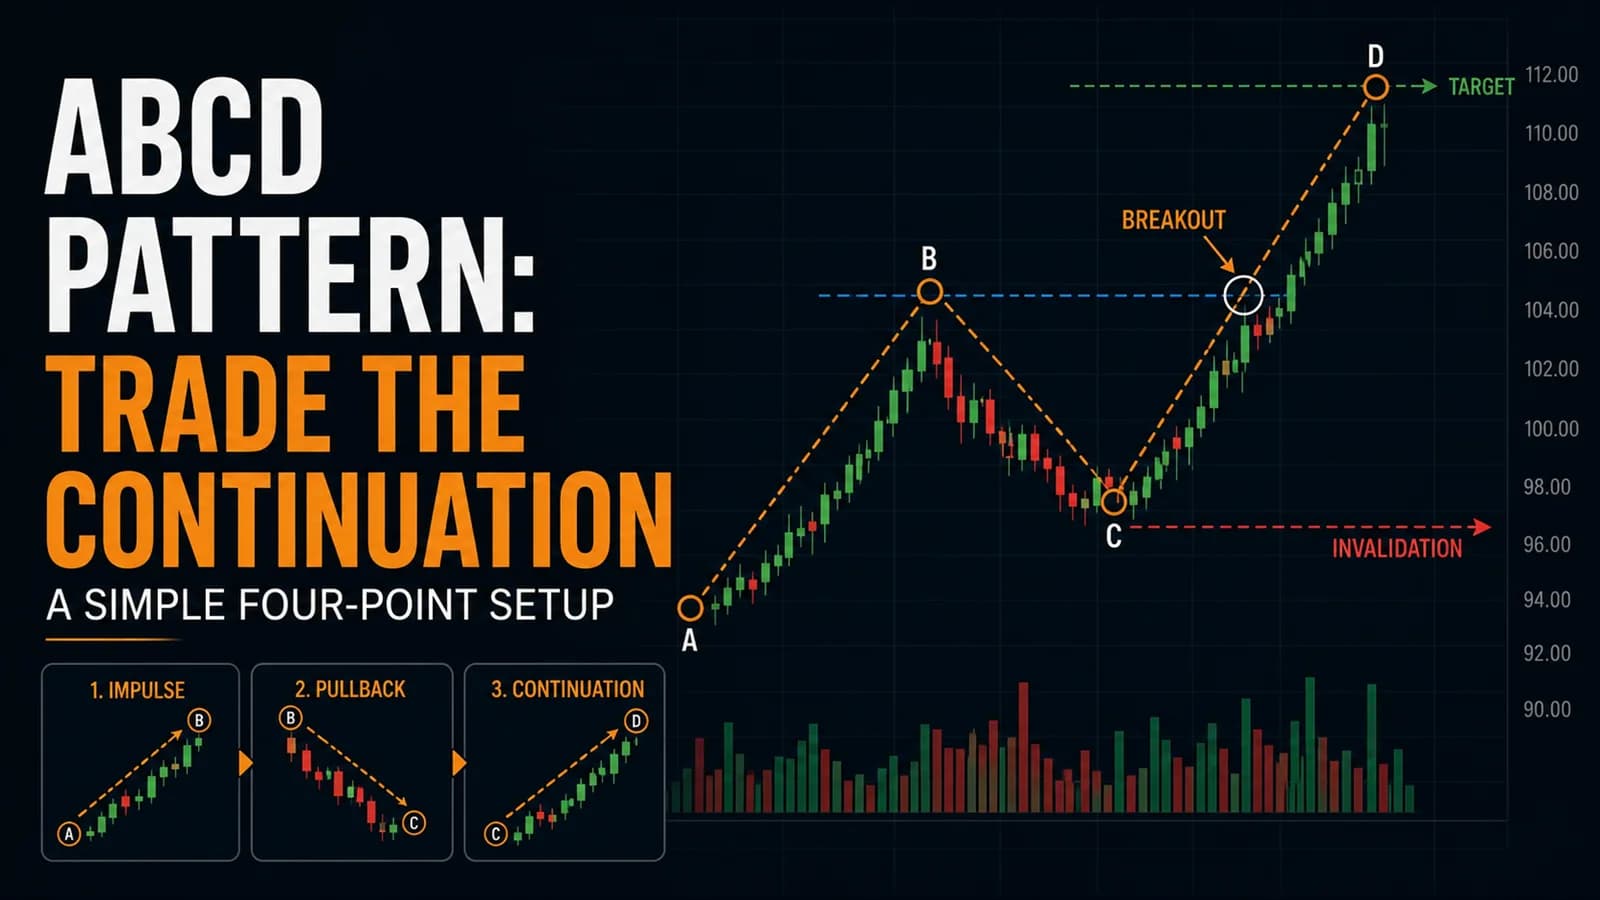
The ABCD Pattern Trading Strategy: A Beginner-Friendly Setup
The ABCD pattern turns a messy pullback into a measured price target. Here's the mechanical version day traders actually use, including where it breaks down.
Comments
No comments yet. Be the first to share your thoughts.