
The Pennant Pattern Trading Strategy

In this article10 sections
A stock rips two dollars in six minutes on a halt-and-resume news catalyst, then pauses in a tiny, tightening triangle for four or five candles before, in theory, continuing the move. That little triangle is a pennant, and it's one of the most visually satisfying patterns a day trader can spot in real time. It's also, according to the large-sample research on it, a pattern that fails to reach its own projected target more often than it succeeds.
That doesn't mean the pennant is a trap. It means this is a pattern where the shape alone is a much weaker signal than most traders assume, and where the specific quality filters covered in this guide matter more than they do for almost any other setup in this hub.
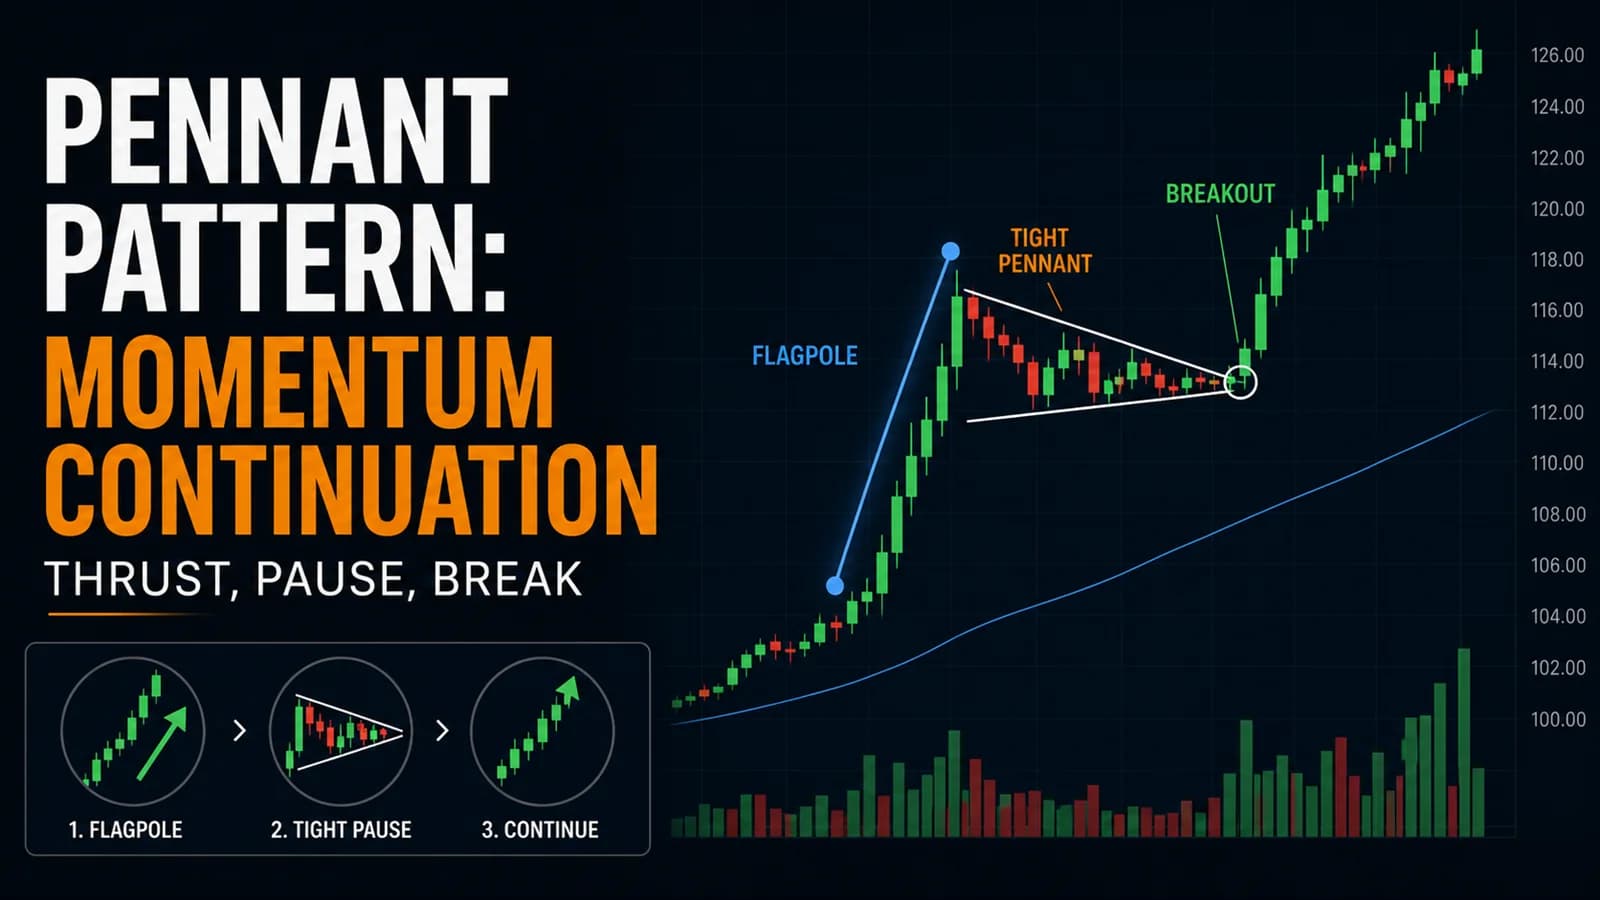
What is a pennant? A pennant is a small, symmetrical, triangle-shaped consolidation that forms after a sharp, near-vertical price move (the "flagpole"), with both converging boundaries narrowing over a short period before, ideally, a continuation breakout in the direction of the original move. It's distinguished from a standard flag by its converging, rather than parallel, boundaries.
Pennant vs. Flag vs. Triangle: Getting the Vocabulary Right
These three terms get used almost interchangeably in casual trading talk, and the mixup causes real confusion about which pattern's statistics actually apply to the setup in front of a trader. This hub's bull flag and bear flag guides cover consolidations with roughly parallel boundaries, a channel drifting against the trend rather than narrowing. A pennant's boundaries converge toward each other instead, giving it a small triangular shape. The triangle pattern guide elsewhere in this hub covers converging patterns too, but triangles typically form without the sharp, near-vertical flagpole that defines a pennant, and they usually take considerably longer to build.
The flagpole is what makes a pennant a pennant. Without a genuinely sharp prior move, a small converging consolidation is really just a miniature symmetrical triangle, and it should be read using that pattern's statistics and rules instead, since the exhaustion-and-continuation story a pennant tells depends entirely on there being a real, forceful move to continue.
Where a Genuine Pennant Actually Forms
Best conditions: A pennant needs a real flagpole, typically a move covering at least 5% to 8% of the stock's price within a short window, several minutes rather than an hour, on clearly elevated volume. Without that sharp initial thrust, there's no genuine "pause after a big move" story for the pennant to tell.
Best time of day: Pennants form fast, often resolving within ten to twenty minutes of the flagpole completing. They're most common and most reliable in the first ninety minutes of the session, when there's enough participation for a real flagpole move to happen in the first place, and enough follow-through interest left for a continuation to actually occur.
Stock type: Overwhelmingly a momentum and small-cap pattern. Low-float stocks moving on a fresh catalyst are the classic pennant setup; large, slow-moving mega-caps rarely produce the sharp flagpole this pattern requires.
Volume signature: Volume should be dramatically elevated on the flagpole, then contract sharply during the pennant's brief consolidation, then expand again on the breakout. This three-phase volume signature, spike, contraction, spike again, is one of the clearest tells separating a genuine pennant from an ordinary pause in a stock that just happened to be moving.
The Setup Specification
- Component
- Market Conditions Required
- Rule
- A genuine flagpole move of at least 5-8% of the stock's price within a short window, on RVOL ≥ 3.0x; volume contracting sharply during the pennant itself
- Component
- Time of Day
- Rule
- Strongest setups form within the first 90 minutes of the session; treat pennants forming after 1:30 PM ET with added caution given thinner follow-through liquidity
- Component
- Stock Selection Criteria
- Rule
- Momentum stock with a defined catalyst; pennant width no more than roughly 5-8 candles on the working timeframe, tight rather than loose
- Component
- Entry Trigger
- Rule
- Candle closes beyond the pennant's boundary in the direction of the flagpole, on volume ≥ 2.0x the average of the prior five bars
- Component
- Stop Loss
- Rule
- Below the pennant's low (bullish) or above the pennant's high (bearish), a deliberately tight stop given this pattern's high documented failure rate
- Component
- Initial Profit Target
- Rule
- Given documented modest average moves, scale half or more of the position at a conservative first target (roughly 0.5x to 1.0x the flagpole's own length projected from the breakout); treat any move beyond that as a bonus
- Component
- Trade Management
- Rule
- Move to breakeven quickly once the breakout clears the pennant's opposite boundary by a small margin; this pattern rewards fast, disciplined exits over patient holding
- Component
- Invalidation Criteria
- Rule
- Price closes back inside the pennant after breakout; the pennant widens rather than continuing to narrow, a sign the consolidation has stopped being a genuine pennant
| Component | Rule |
|---|---|
| Market Conditions Required | A genuine flagpole move of at least 5-8% of the stock's price within a short window, on RVOL ≥ 3.0x; volume contracting sharply during the pennant itself |
| Time of Day | Strongest setups form within the first 90 minutes of the session; treat pennants forming after 1:30 PM ET with added caution given thinner follow-through liquidity |
| Stock Selection Criteria | Momentum stock with a defined catalyst; pennant width no more than roughly 5-8 candles on the working timeframe, tight rather than loose |
| Entry Trigger | Candle closes beyond the pennant's boundary in the direction of the flagpole, on volume ≥ 2.0x the average of the prior five bars |
| Stop Loss | Below the pennant's low (bullish) or above the pennant's high (bearish), a deliberately tight stop given this pattern's high documented failure rate |
| Initial Profit Target | Given documented modest average moves, scale half or more of the position at a conservative first target (roughly 0.5x to 1.0x the flagpole's own length projected from the breakout); treat any move beyond that as a bonus |
| Trade Management | Move to breakeven quickly once the breakout clears the pennant's opposite boundary by a small margin; this pattern rewards fast, disciplined exits over patient holding |
| Invalidation Criteria | Price closes back inside the pennant after breakout; the pennant widens rather than continuing to narrow, a sign the consolidation has stopped being a genuine pennant |
The tight-versus-loose distinction in the Setup Specification isn't cosmetic. A pennant that stays genuinely tight, each successive high and low narrowing meaningfully compared to the last, is a materially different, higher-quality setup than one where the "boundaries" are barely converging at all.

A Walk-Through: A Pennant That Confirms and One Danger Sign It Avoided
Consider a small-cap tech stock, ticker XYZ, trading at $5.40 when a positive contract announcement hits the wire at 10:02 AM ET. XYZ rockets to $6.15 by 10:07 AM, a five-minute, 13.9% flagpole move on RVOL of 6.8x. That kind of sharp, high-volume thrust is exactly the setup a pennant needs.
From 10:07 to 10:14 AM, XYZ consolidates in a narrowing range: a high of $6.15 followed by a pullback to $5.98, then a lower high of $6.08, then a higher low of $6.02, each swing tighter than the last, on volume that's dropped to roughly a quarter of the flagpole's pace. That's a genuinely tight pennant, not a loose, barely-converging one.
At 10:15 AM, a 1-minute candle closes at $6.19, above the pennant's upper boundary, on volume 2.4x the prior five-bar average. A trader entering at $6.19 sets a stop below the pennant's $5.98 low, a $0.21 risk per share, deliberately tight given this pattern's documented tendency to fail. Given the flagpole's $0.75 length, a conservative target of half that distance projected from the breakout points toward roughly $6.57, and the plan calls for scaling out the majority of the position there rather than holding for a larger, statistically less likely move.
XYZ reaches $6.60 by 10:24 AM, and the disciplined exit locks in a solid gain on most of the position before XYZ stalls and drifts back to $6.30 over the next twenty minutes. A trader who held the full position for a larger projected target, treating the pennant with the same patience appropriate for a stronger pattern like a cup and handle, would have watched a chunk of that open gain evaporate.
Contrast that with a hypothetical version of the same setup where, instead of narrowing, the consolidation after the flagpole starts making a slightly lower low than the prior swing, then a slightly higher high than the prior swing, widening instead of converging. That's not a pennant anymore, regardless of how it started; it's a different, less well-defined consolidation, and the Setup Specification's invalidation criteria calls for standing aside rather than forcing the pennant label onto a shape that's stopped behaving like one.
Managing the Trade: Speed Matters More Than Patience Here
Exit fast and take the majority of the position off near the first reasonable target. This is the single most important management adjustment for this specific pattern, directly informed by the failure-rate research covered in the next section. A pennant that's going to work tends to show it quickly; a trader still holding a full position waiting for a bigger move twenty or thirty minutes after the breakout is often holding a trade that's already told them what it's going to do.
A widening consolidation after the flagpole is a clear signal to stand aside, not to keep waiting for the pattern to "become" a pennant. Genuine pennants narrow. A consolidation that starts wide and stays wide, or actually widens, has already failed the pattern's core defining characteristic, regardless of how promising the initial flagpole looked.
Because this pattern is so common on low-float, high-momentum names, this is also exactly the territory where FOMO does the most damage. Chasing a pennant breakout several candles after it's already extended, because the flagpole looked exciting and a trader doesn't want to miss it, is a specific, well-documented way this setup goes wrong. The beginner's guide's coverage of FOMO in trading is directly relevant to this exact pattern more than almost any other in this hub.
Where the Pennant Pattern Fails
This is the pattern in this hub's entire Chart Pattern Playbook with the most sobering documented statistics, and it deserves to be stated clearly rather than softened for the sake of a more exciting article. Independent statistical research into the pennant, based on Thomas Bulkowski's large-sample study of over 1,600 confirmed trades on daily charts, found a break-even failure rate above 50% in both directions, meaning more than half of confirmed pennants failed to produce even a minimal profitable move. That same research found only roughly a third of pennants, in either direction, actually reached their full projected price target, and the researcher's own analysis noted that pennants only behave as a reliable "midway" continuation signal, the textbook use case most traders are taught, in a minority of cases. Average moves following confirmed breakouts were also modest, single-digit percentages in both directions, smaller than several other patterns covered in this hub. This data comes from multi-week daily-chart research, not the compressed intraday version this guide covers, but the direction of the finding, that pennants are considerably less reliable than their popular reputation suggests, is important enough to carry directly into how this pattern should be sized and managed intraday.
That same research did identify quality filters that meaningfully improve the odds: tighter, more compressed pennants outperformed loose, barely-converging ones, and pennants forming below a flat base performed better than those forming in more chaotic surrounding structure. Those findings are exactly why the Setup Specification above insists on genuine tightness and a real, sharp flagpole rather than treating every small triangular pause after a move as an equally valid setup.
The practical failure mode this data points to is a trader treating every brief pause after a sharp move as a high-probability continuation setup, simply because the shape is easy to spot and psychologically satisfying to trade. The honest version of this pattern is closer to a low-frequency, quality-filtered, fast-exit setup than the reliable bread-and-butter continuation trade it's sometimes presented as.
A second failure mode, specific to intraday momentum stocks, is confusing a genuine pennant with a stock simply pausing due to a temporary halt or a wide bid-ask spread on thin liquidity. A pause caused by a trading halt isn't the same phenomenon as a genuine pennant consolidation, and the pattern's statistics don't meaningfully apply to a pause that was mechanically forced rather than organically formed by two-way trading.
Variations Worth Knowing
The pennant below a flat base, forming after a flagpole that itself launched from a period of tight, flat consolidation rather than from an erratic prior structure, was specifically identified in the underlying research as a stronger-performing version. This connects the pennant setup to broader structural context, similar to how this hub's flat top breakout guide treats a flat prior base as a meaningful quality signal in its own right.
The bear pennant, the mirror-image bearish version following a sharp decline rather than a sharp rally, follows the same tight-versus-loose quality logic and the same fast-exit management approach, just inverted.
The failed pennant that resolves opposite the flagpole's direction is a real, if less common, outcome given this pattern's documented weakness, and it can produce a sharp reversal move as traders positioned for the "obvious" continuation are forced to exit. This is closely related to this hub's failed breakout, bull trap, and bear trap guide.
Tools for Catching a Pennant as It Forms
Because pennants form and resolve quickly, often within fifteen or twenty minutes of the flagpole completing, catching one in real time depends heavily on already watching the stock when the flagpole happens. A scanner tuned to flag sudden, high-RVOL price spikes, like Trade Ideas, is close to a requirement for trading this pattern seriously, since it's the tool most likely to put a trader onto the flagpole itself, with enough time left to watch the consolidation for the tightness and volume-contraction signature that separates a real pennant from a weak one. For a broader comparison of scanning tools suited to fast-moving momentum setups like this, see the tools and reviews section.
How This Setup Fits a Complete Trading Plan
Given the documented failure rate covered in this guide, the pennant fits a trading plan best as a small-size, high-frequency, fast-exit setup rather than a core position type. It pairs naturally with this hub's broader momentum day trading strategy coverage, since pennants are fundamentally a momentum-stock phenomenon that depends on the same fast-moving, catalyst-driven conditions.
Given the tight stops this pattern calls for, position size under a standard risk-per-trade framework can technically run larger in share count without increasing dollar risk, but the documented failure rate argues for treating that extra capacity as a reason to take more, smaller, well-filtered setups rather than concentrating size into any single pennant trade.
Frequently Asked Questions
Given the high failure rate documented here, is the pennant worth trading at all?
A genuinely sharp flagpole, a tight rather than loose consolidation, and a flat base underneath the whole structure all meaningfully improve the odds. The underlying research found these filtered versions performed better than the pattern's average, which is exactly why this guide's Setup Specification insists on them rather than treating every small post-move pause as equally tradeable.
Key Takeaway: Apply the tightness and flagpole-strength filters strictly, and treat any pennant that doesn't meet them as a pass, not a smaller version of the same trade.
What makes a pennant "tight" versus "loose" in practical terms?
A loose pennant has boundaries that are technically converging but only marginally, with swings that look almost as wide near the end of the consolidation as they did at the start.
Key Takeaway: Require visibly, not just technically, converging swings before treating a consolidation as a high-quality, tight pennant.
How is a pennant different from a stock just pausing after a big move for no particular structural reason?
It's just choppy, directionless price action following a big move, without the specific geometric compression that defines this pattern. Only the narrowing version, with volume also contracting through the pause, qualifies as an actual pennant under this guide's Setup Specification.
Key Takeaway: Require genuine, visible narrowing and volume contraction, not just any post-move pause, before applying pennant-specific rules to a consolidation.
Why does this guide recommend such fast profit-taking compared to other patterns in this hub?
Only a minority reach their full projected target. Those numbers argue directly for capturing available profit quickly rather than holding for a larger move that the pattern's own documented behavior shows is the less likely outcome.
Key Takeaway: Let the pattern's own documented statistics, not general trading instinct, dictate how patiently to hold a pennant trade.
Does the pennant pattern work the same way on large-cap stocks as on small-cap momentum names?
When a large-cap does show this kind of sharp move, typically on major news, the same pennant logic applies, but traders should expect to see this setup far more often on smaller, faster-moving names.
Key Takeaway: Expect and look for pennants primarily on momentum-driven small and mid-cap stocks rather than large, slower-moving names.
What's the difference between trading a pennant and trading a simple new-high breakout during a strong move?
That pause gives a trader a defined boundary, stop level, and entry trigger that a plain momentum breakout doesn't provide. The two are related but distinct trades with different risk profiles.
Key Takeaway: Treat the pennant as a structured subset of momentum trading with its own defined risk parameters, not as interchangeable with chasing an ongoing move with no pause.
How long should a trader wait for a pennant to resolve before giving up on the setup?
A consolidation that's still going sideways well beyond that window, without narrowing further or breaking either boundary, has likely stopped behaving like a genuine pennant and should be treated as invalidated rather than watched indefinitely.
Key Takeaway: Set a rough time limit, informed by this pattern's typically fast resolution, for abandoning a pennant that isn't confirming or clearly failing within its normal timeframe.
Should a trader use a wider stop on a pennant to avoid getting shaken out by noise?
The tight stop just below (or above) the pennant's actual boundary is a deliberate, research-informed choice, not an oversight to be second-guessed.
Key Takeaway: Keep the stop tight and close to the pennant's actual boundary; widening it to avoid noise increases risk on an already lower-probability setup.
Is a pennant with no clear flagpole still worth trading as a smaller triangle pattern?
Without a genuine sharp flagpole, the specific continuation logic and statistics this guide covers don't apply. The shape alone, without the flagpole, is a different pattern with different documented behavior. See this hub's triangle pattern guide for that framework.
Key Takeaway: Require a genuine, sharp flagpole before applying pennant-specific rules; a similar shape without one is a triangle, not a pennant.
What single filter improves this pattern's odds the most, based on the research cited here?
The underlying research specifically found tighter, more compressed pennants outperforming looser ones, which is a more consistently applicable filter across different stocks and sessions than trying to judge flagpole quality or base structure alone.
Key Takeaway: When only one filter can be applied under time pressure, prioritize a genuinely tight, converging consolidation over a loose one.
Disclaimer
Article Sources
- StockCharts ChartSchool: Chart Patterns - reference library covering classic continuation pattern structures
- StockCharts ChartSchool: Introduction to Candlesticks - foundational reading on price-bar behavior around a sharp move
- FINRA: Understanding the New Intraday Margin Requirements - current regulatory framework for day-trading accounts
- FINRA Rule 2270: Day-Trading Risk Disclosure Statement - regulatory baseline for day-trading risk disclosure
- Investor.gov: Margin Rules for Day Trading - investor-facing overview of day-trading account requirements
Was this helpful?
Be the first to weigh in

Written by
Kazi Mezanur RahmanFounder, independent researcher, and editor of DayTradingToolkit. A one-person publication focused on risk-first trading education and documented tool research. He trades his own capital as a retail trader and combines personal market experience with systematic primary-source research.
Keep Reading
Strategies
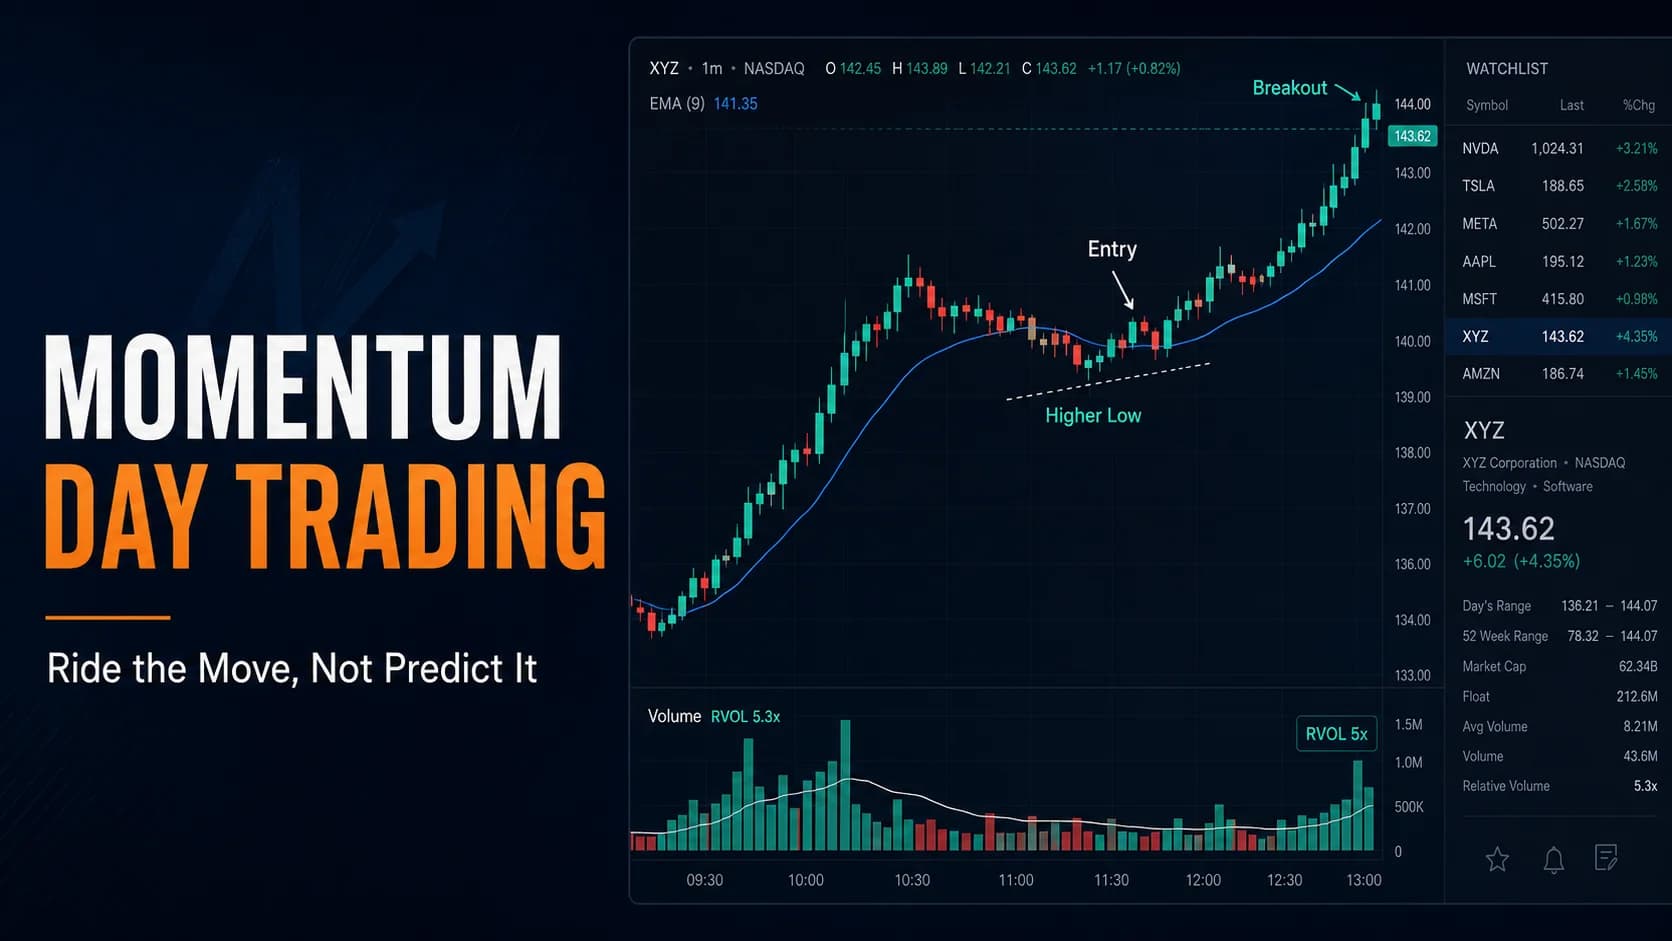
The Momentum Day Trading Strategy: Riding Stocks That Are Moving
Academic momentum research is about months, not minutes. This guide covers what transfers to intraday trading and the mechanical setup for riding a mover.

Strategies
Trading Breakouts From Consolidation: The Volatility Contraction Pattern
The VCP isn't just a volatility squeeze. This guide covers the staged contraction sequence, the pivot point, and why context matters as much as the pattern.
Strategies
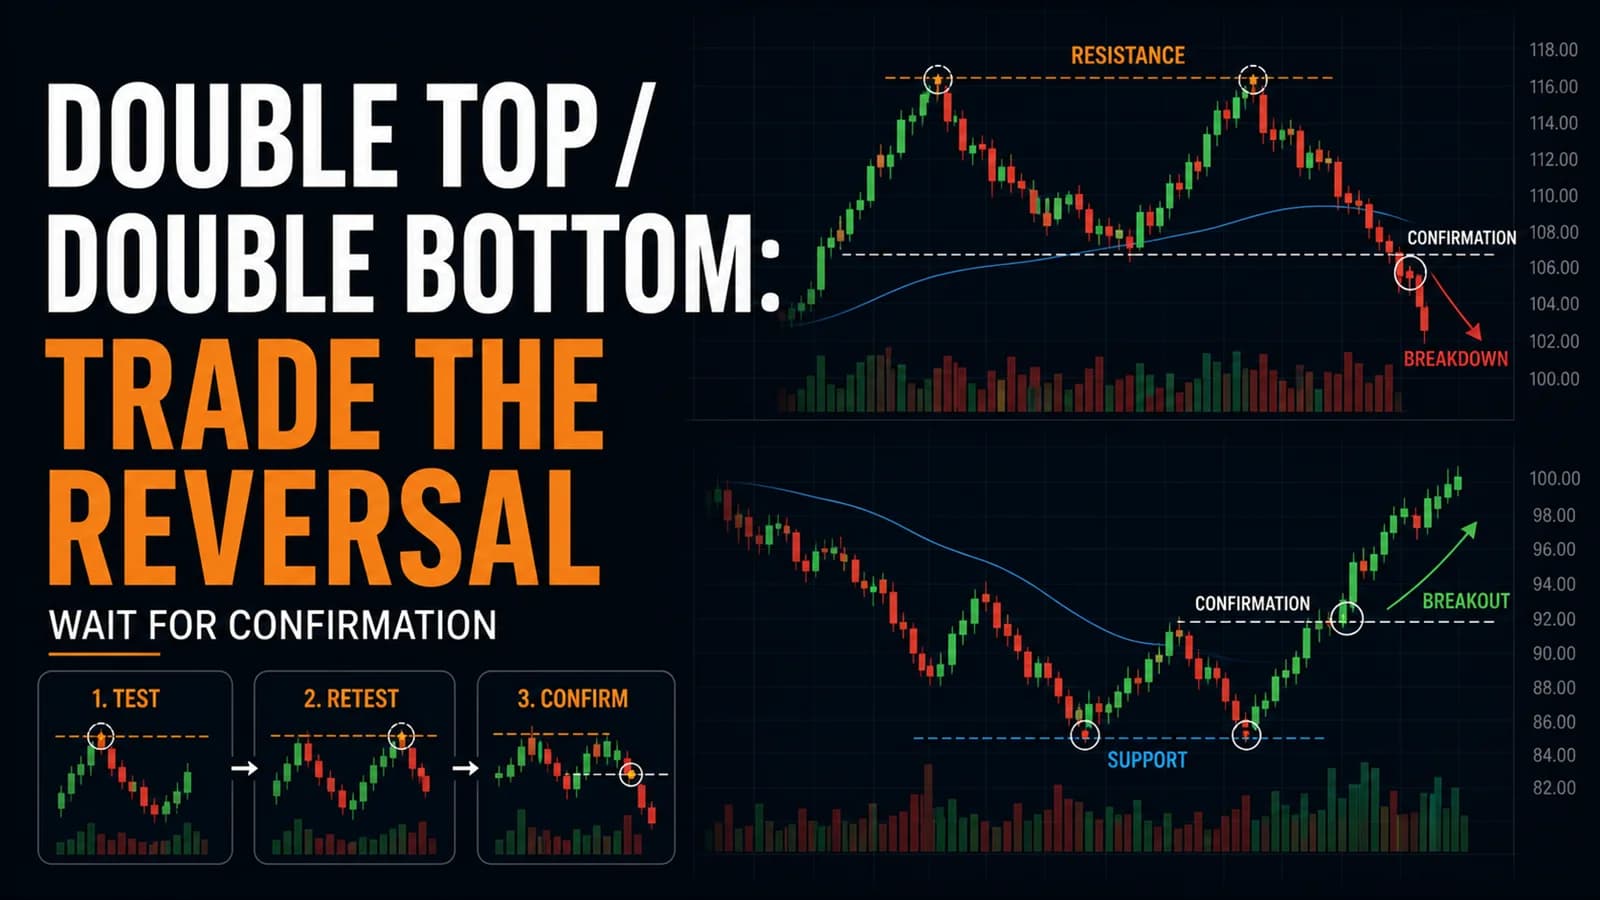
The Double Top / Double Bottom Trading Strategy
Most double tops never confirm. Here's the confirmation line that separates a real reversal from two random peaks, plus the honest failure rate behind each.
Strategies
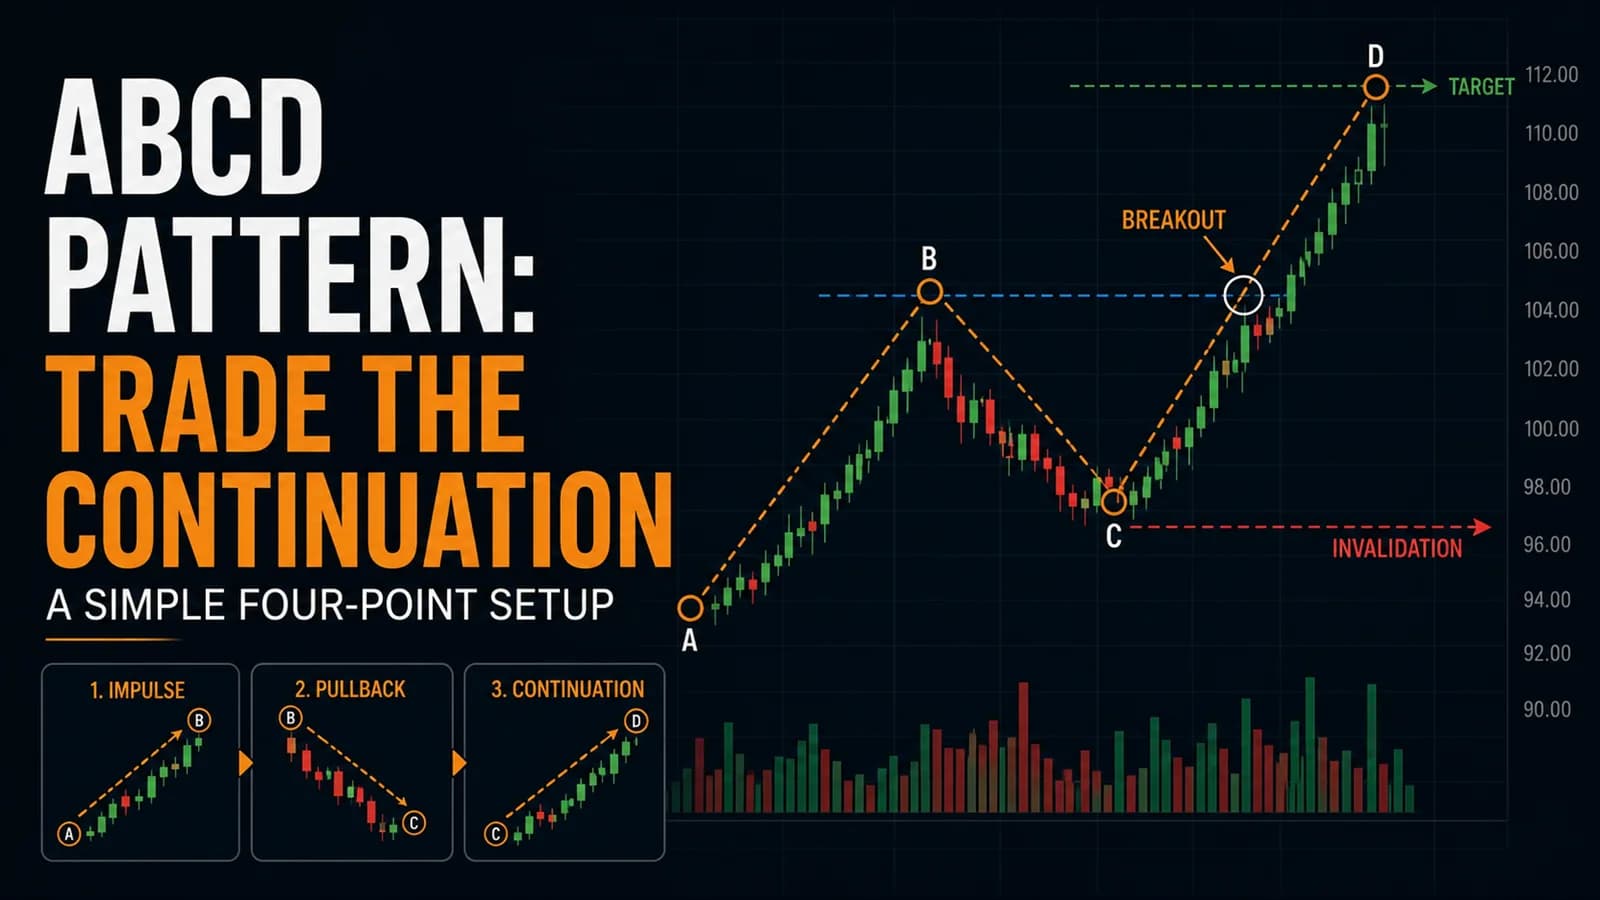
The ABCD Pattern Trading Strategy: A Beginner-Friendly Setup
The ABCD pattern turns a messy pullback into a measured price target. Here's the mechanical version day traders actually use, including where it breaks down.
Comments
No comments yet. Be the first to share your thoughts.