
The Cup and Handle Day Trading Strategy

In this article10 sections
A stock dips 6% off its morning high, spends ninety minutes rounding back up in a smooth, unhurried arc, then stalls just below that morning high and drifts sideways in a tight three-cent range for fifteen minutes. Most traders watching that final drift see a stock that's lost momentum. A trader who recognizes it as a handle sees a stock that's about to be squeezed.
The cup and handle is one of the few chart patterns where the setup's own slowness is the point. It rewards a trader who can watch a rounded, patient recovery without getting bored and chasing something else, then act fast the moment the handle resolves.
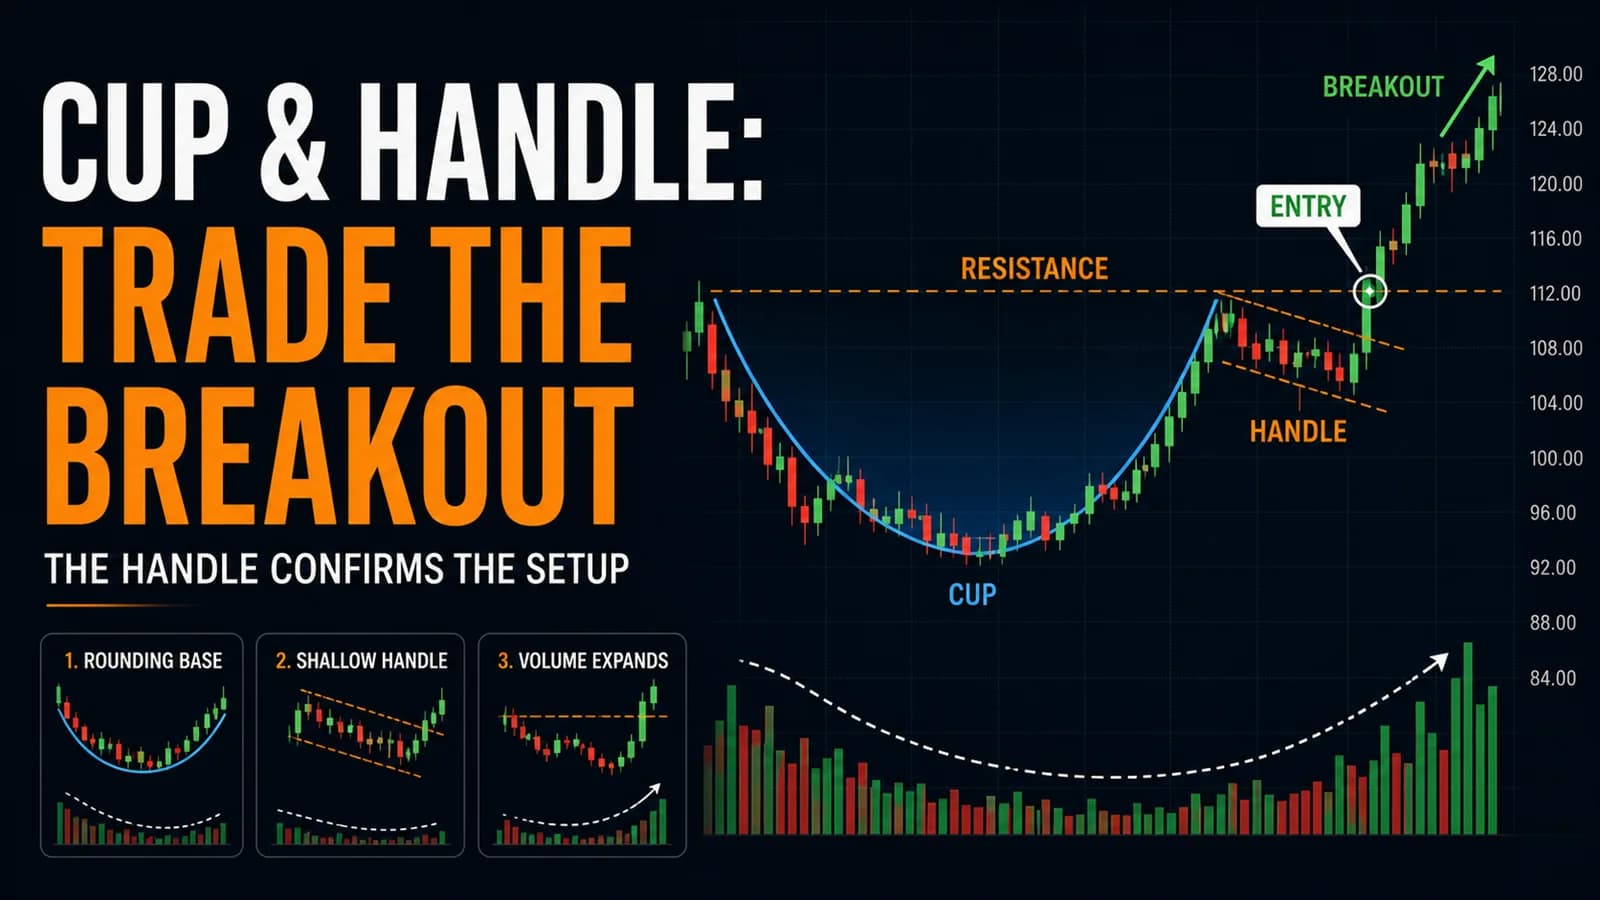
What is the cup and handle pattern? The cup and handle is a bullish continuation pattern made of a U-shaped rounding recovery (the "cup") back toward a prior high, followed by a small, shallow pullback near that high (the "handle") before price breaks out above the cup's rim on rising volume. It signals that early sellers have been absorbed and a fresh leg higher is likely to follow.
The Handle Is What Separates This From an Ordinary Round-Bottom Recovery
A lot of patterns get called "cup and handle" that are really just a stock recovering off a dip, which is a much weaker and far more common shape. The distinction that matters is the handle itself: a real cup and handle needs a second, smaller pause right at the rim, not just a straight-line recovery into new highs.
That handle does real work. It shakes out the traders who bought the cup's recovery too early and are now nervous at breakeven, and it lets a fresh batch of buyers form a tight base exactly at the level that needs to break for the pattern to complete. A rounding recovery with no handle at all is really just this hub's breakout-versus-fakeout territory, a plain resistance test, and it deserves that setup's stricter confirmation rules rather than the cup and handle's measured-move framework.
The other common mix-up is with a standard flat top breakout. A flat top is a horizontal ceiling with rising lows underneath it, tested repeatedly. A cup and handle's "ceiling" isn't tested repeatedly on the way up; it's approached once, in a single rounding arc, and then the handle forms as a single small pause right at that level. The rounding shape of the cup itself is the tell.
Reading the Cup: What a Real Rounding Bottom Looks Like Intraday
On a daily chart, a cup and handle can take weeks to form. Compressed into a single trading session, the entire structure, cup and handle both, typically plays out over one to three hours, which changes what a trader should actually be watching for compared to the swing-trading version of this pattern.
Best conditions: A stock that pulled back from an early session high on a wave of profit-taking, not on genuinely bad news. VIX in a normal-to-elevated range is fine; a genuinely panicked, gap-down broad market tends to prevent the smooth, rounding recovery this pattern depends on, because sellers don't let up long enough for a U-shape to form.
Best time of day: The cup itself typically builds during the 9:45 AM to 11:30 AM window, when there's still enough participation for a rounding recovery to develop with real volume behind it. Handles that form and break out before 1:00 PM ET have historically produced the cleanest follow-through in this guide's review of the setup; a cup that's still rounding out after 2:00 PM often runs out of session time before the handle can even form.
Stock type: Works best on stocks with enough average volume to produce a smooth arc rather than a jagged, erratic one. A low-float name prone to violent, spiky moves rarely produces a clean rounding bottom; it either V-shapes back to the high in a straight line (no real cup) or keeps making disorderly new lows (no recovery at all).
Cup depth: For an intraday version, a cup depth of roughly 3% to 8% of the stock's price is the workable range. Shallower than that and the "cup" is just noise around the highs. Deeper than about 10% to 12% intraday, and the recovery usually needs more time than a single session provides to complete the handle and break out with conviction.
The Setup Specification
- Component
- Market Conditions Required
- Rule
- Broad market not in a sharp intraday decline; VIX in a normal-to-elevated, non-panicked range
- Component
- Time of Day
- Rule
- Cup formation 9:45–11:30 AM ET ideal; avoid initiating new setups after 2:00 PM ET
- Component
- Stock Selection Criteria
- Rule
- Price above $5.00, cup depth 3-8% of price, average volume sufficient for a smooth (not jagged) rounding shape
- Component
- Entry Trigger
- Rule
- 1-minute or 5-minute candle closes above both the handle's high and the cup's rim, on volume ≥ 1.5x the average of the prior ten bars
- Component
- Stop Loss
- Rule
- Below the handle's low; a wider alternative is below the cup's right-side low for traders sizing down accordingly
- Component
- Initial Profit Target
- Rule
- Cup depth (rim minus cup low) added to the breakout price; scale a third to half of the position at the 0.618x extension of that measured move
- Component
- Trade Management
- Rule
- Trail the stop below rising 1-minute or 5-minute swing lows once price clears the initial target zone
- Component
- Invalidation Criteria
- Rule
- Handle retraces more than roughly 50% of the cup's right-side recovery leg, or price closes back below the cup's rim after an initial breakout attempt
| Component | Rule |
|---|---|
| Market Conditions Required | Broad market not in a sharp intraday decline; VIX in a normal-to-elevated, non-panicked range |
| Time of Day | Cup formation 9:45–11:30 AM ET ideal; avoid initiating new setups after 2:00 PM ET |
| Stock Selection Criteria | Price above $5.00, cup depth 3-8% of price, average volume sufficient for a smooth (not jagged) rounding shape |
| Entry Trigger | 1-minute or 5-minute candle closes above both the handle's high and the cup's rim, on volume ≥ 1.5x the average of the prior ten bars |
| Stop Loss | Below the handle's low; a wider alternative is below the cup's right-side low for traders sizing down accordingly |
| Initial Profit Target | Cup depth (rim minus cup low) added to the breakout price; scale a third to half of the position at the 0.618x extension of that measured move |
| Trade Management | Trail the stop below rising 1-minute or 5-minute swing lows once price clears the initial target zone |
| Invalidation Criteria | Handle retraces more than roughly 50% of the cup's right-side recovery leg, or price closes back below the cup's rim after an initial breakout attempt |
The handle's depth is the single most diagnostic number in this whole setup. A handle that retraces less than 30% of the cup's final recovery leg is often too shallow to have shaken out weak hands, and can fail on the first real test of supply at the rim. A handle deeper than 50% starts to look less like a controlled pause and more like the recovery running out of steam, which is exactly the invalidation condition in the table above.

A Walk-Through: The Cup Building, the Handle Forming, the Break
Consider a large-cap consumer stock, ticker XYZ, opening at $84.50. A weaker-than-expected same-store-sales data point from a competitor spooks the sector at 9:38 AM, and XYZ slides to $79.60 by 9:52 AM on RVOL of 2.8x, a decline of about 5.8%.
From there, buyers start stepping back in. Not aggressively, but steadily. By 10:15 AM, XYZ has recovered to $81.40. By 10:45 AM, $83.10. By 11:20 AM, XYZ trades back to $84.35, just eighteen cents under the session's opening level and the effective rim of the cup. That entire arc, roughly ninety minutes of a smooth, unhurried recovery on gradually building volume, is the cup.
From 11:20 AM to 11:38 AM, XYZ stalls. It trades in a tight range between $83.95 and $84.40, unable to punch through the $84.50 rim, but also not giving back much of the recovery. Volume during this eighteen-minute window drops to roughly 40% of the cup's average pace. That's the handle: a retracement of about 27% of the cup's final recovery leg, comfortably inside the workable zone.
At 11:39 AM, a 5-minute candle closes at $84.85, clearing both the handle's $84.40 high and the $84.50 rim, on volume 1.9x the prior ten-bar average. A trader entering at $84.85 sets a stop below the handle's $83.95 low, an $0.90 risk per share, and calculates the target: cup depth of $4.90 ($84.50 minus $79.60) added to the $84.85 breakout price, projecting toward $89.75.
XYZ doesn't reach the full projection that session. It runs to $87.20 by 1:10 PM, comfortably past the 0.618x extension where a third of the position was scaled out, before the broader market cools off into the afternoon and XYZ's trailing stop, sitting below a rising 5-minute swing low near $86.40, gets hit on a pullback. The trade closes with a solid gain on the scaled-out portion and a smaller gain on the remainder, well short of the full cup-depth projection but a clean, rules-based execution of the setup regardless.
Managing the Trade Once the Handle Breaks
The stop stays below the handle, not the whole cup, for the first phase of the trade. Placing the initial stop below the far deeper cup low is technically "safer" from being stopped out, but it also means risking several times more capital than the setup actually requires, since a genuine breakout shouldn't need to give back the entire handle, let alone retest the cup's low.
Volume on the breakout candle needs to expand relative to the handle's volume, not just the cup's average. A breakout on volume that barely exceeds the quiet handle period is a weaker signal than one where volume clearly steps up beyond what the whole pattern has shown so far. This is the clearest tell for separating a genuine institutional-driven breakout from a low-conviction drift above the rim that a single large seller can reverse.
Scaling at the 0.618x extension, not waiting for the full cup-depth target, is the discipline this setup rewards. Because the cup and handle asks a trader to wait through a long, unglamorous formation process, there's a temptation to hold for the entire projected move once the breakout finally happens, as a kind of reward for the patience already spent. That's an emotional reason to hold, not a technical one, and it works against the trader more often than it pays off.
The psychology hub's piece on staying objective while waiting for a setup to complete speaks directly to the patience this pattern demands during the cup's long, quiet formation phase, before the handle even gives a trader something to act on.
Where the Cup and Handle Pattern Fails
This guide's independent research into the cup with handle pattern, based on Thomas Bulkowski's long-running statistical study of the formation across hundreds of confirmed trades on daily charts, found it to be one of the more reliable bullish continuation patterns studied, with a notably low break-even failure rate and roughly three in five confirmed patterns reaching their projected price target. That data comes from multi-week daily-chart formations, not intraday ones, and no equivalent large-sample study exists for the compressed, single-session version day traders actually work with. Treat the swing-trading numbers as directional context for why this pattern has a real, researched edge, not as an exact probability for the intraday version.
Where the intraday version breaks down most often is a handle that never really forms, a rounding recovery that goes straight into new highs without pausing first. That's not a failure of the pattern; it's a different, faster trade (closer to a straightforward breakout) that shouldn't be sized or managed using the cup and handle's measured-move framework, because there was never a real handle-low to set a tight stop against.
A second failure mode is a handle that breaks down instead of up, closing below the handle's low after the pause. This usually means the rounding recovery, however smooth it looked, was still fundamentally profit-taking from the initial decline rather than genuine fresh buying, and the stock simply runs out of buyers exactly at the level that mattered most.
A third, quieter failure mode is trading a cup that's too deep for the remaining session time. A cup that retraces 10% or more of the stock's price often needs more than a few hours to complete a genuine handle and breakout; forcing the pattern into a same-session trade on a cup that large frequently means entering a handle that's really just the recovery stalling out for the day, with no real breakout left in the tank before the close.
Variations Worth Knowing
The failed-cup short, the mirror-image bearish version, forms as an inverted rounding top followed by a small bounce (the "handle," now acting as bearish resistance) before breaking down. It's a less common but real setup on stocks fading off a morning high; this hub's breakdown trading strategy for bear markets covers the broader mechanics of shorting a failing structure like this one.
The tight handle is a higher-conviction version where the handle's range compresses to just a few cents on a mid-priced stock, essentially a mini flag right at the rim. These tend to produce sharper, faster breakouts once they resolve, because the tight range reflects genuine indecision resolving quickly rather than a slow drift.
The multiple-handle version occurs when price tests the rim, pulls back into a handle, fails to break out, forms a second handle, and then finally clears the rim on the second attempt. Each failed attempt that still holds above the cup's low adds conviction to the eventual breakout, though it also means a trader following strict handle-low stops may get stopped out on the first attempt before catching the second.
Tools for Spotting a Cup and Handle Forming Live
The hardest part of trading this pattern isn't the breakout, it's noticing the rounding recovery early enough to be watching when the handle forms. A scanner that flags stocks reclaiming a meaningful percentage of an early-session decline, like Trade Ideas, gives a trader a running list of cup candidates well before the handle even starts to form, rather than discovering the pattern only after the breakout has already happened.
A clean charting platform that lets a trader mark the cup's rim and depth with a simple horizontal line and a measured-move tool also matters here, since the projected target is entirely dependent on measuring the cup's depth accurately. For a broader comparison of scanning and charting tools suited to pattern-based setups like this one, see the tools and reviews section.
How This Setup Fits a Complete Trading Plan
The cup and handle is a patience-first setup, and it fits best in a trading plan that already has room for a smaller number of higher-conviction trades rather than a high-frequency approach. A trader running five or six scalps an hour on other setups will find the one-to-three-hour formation time here awkward to fit into that rhythm; a trader who's comfortable watching fewer names more closely will get more out of it.
Because the stop sits below the handle rather than the deeper cup, position sizing on this setup can typically run larger relative to account risk than a setup with a wider structural stop, provided the 1% risk-per-trade discipline is still respected. The tighter stop is the reward for waiting through the pattern's slower formation process.
Frequently Asked Questions
How is a cup and handle different from a stock just recovering off a dip?
An ordinary recovery goes straight back toward the prior high without pausing, or it pauses in a jagged, erratic way with no clear shape. A real cup and handle needs both the smooth, rounded U-shape of the cup and a second, distinct pause (the handle) right at the rim before the actual breakout. Without that second pause, there's no measured-move stop level to trade against, and the setup should be treated as a plain breakout instead.
Key Takeaway: Require both the rounded cup shape and a visible handle pause before applying this pattern's specific entry and stop rules.
Why does the handle need to retrace less than the cup's full recovery leg?
A handle that retraces more than roughly half of the cup's final recovery leg starts to look less like a controlled pause and more like the recovery running out of steam and rolling back over. Shallow, controlled handles reflect profit-taking from short-term traders while longer-term buyers hold their position; deep handles reflect real doubt creeping back into the stock.
Key Takeaway: Treat a handle retracement beyond 50% of the cup's recovery leg as a warning sign, not just a deeper, still-valid entry opportunity.
What's the minimum cup depth worth trading intraday?
Below roughly 3% of the stock's price, the "cup" often isn't a meaningful decline and recovery at all, just normal noise around the session's opening levels. Without a real decline to recover from, there's no genuine test of whether sellers have been absorbed, which is the entire premise the pattern's reliability rests on.
Key Takeaway: Skip cups shallower than about 3% of the stock's price; there usually isn't enough of a real pullback behind them to matter.
Can a cup and handle form on a stock that's down on the day overall?
A stock can be down 4% on the day while still forming a valid cup and handle off its own intraday low, projecting a recovery that may only bring it back to flat or slightly positive rather than to a fresh high.
Key Takeaway: Judge the cup and handle by its own internal shape and measured-move math, not by whether the stock is green or red on the day overall.
How does volume on the cup's left side compare to the right side in a healthy pattern?
A healthy cup typically shows heavier volume on the initial decline (the left side, as sellers push the stock down) and then gradually building, but not necessarily heavier, volume on the recovery (the right side) as buyers slowly reassert control. A right side with volume that spikes dramatically higher than the left side's decline can be a good sign of strong demand, but a right side with volume that's noticeably weaker than the decline suggests a tepid, low-conviction recovery.
Key Takeaway: Compare left-side and right-side volume as a quality check on the recovery's conviction, not just the breakout candle's volume in isolation.
Is the cup and handle a reliable pattern, or does it just look convincing on a chart?
That research is based on multi-week formations, not the compressed intraday version this guide focuses on, so treat it as evidence the underlying structure has real value, not as a precise probability for a same-session trade.
Key Takeaway: The pattern's strong reputation is backed by real research on its longer-timeframe version; apply that as directional confidence, not as an exact intraday statistic.
What should a trader do if the handle forms but volume never picks up on the breakout attempt?
A breakout that can't attract volume beyond what the quiet handle period showed is more likely to be a single large seller getting absorbed briefly rather than genuine fresh demand entering the stock.
Key Takeaway: Require the breakout candle's volume to clearly exceed the handle's volume, and treat a breakout that fails this test as lower-conviction regardless of the price action alone.
How far below the handle should the stop actually sit?
Directly below the handle's lowest print is the standard, tightest version of this setup's stop; adding a small buffer of a few cents on a low-priced stock, or a fraction of a percent on a higher-priced one, accounts for normal intraday noise without meaningfully widening the risk. Placing the stop far below that, down near the cup's low, defeats the purpose of waiting for a tight handle to form in the first place.
Key Takeaway: Keep the stop close to the handle's actual low, with only a small noise buffer, rather than defaulting to the wider cup-low stop out of caution.
Does this pattern work on ETFs and index products, not just individual stocks?
The rounding recovery reflects a genuine shift in aggregate buying and selling pressure across many underlying names rather than the idiosyncratic behavior of a single stock. A cup and handle on a heavily traded sector ETF following a broad risk-off dip and recovery is a legitimate version of this setup, not an exception to it.
Key Takeaway: Apply the same Setup Specification to liquid ETFs as to individual stocks; the pattern's logic doesn't depend on single-stock idiosyncrasies.
What time-of-day cutoff makes sense for abandoning a cup that hasn't formed a handle yet?
A cup that's still rounding out that late in the session usually doesn't leave enough remaining time for a handle to form and a breakout to develop real follow-through before the close approaches and volume naturally thins out.
Key Takeaway: Stop watching a slow-forming cup for a same-day handle and breakout once the early afternoon arrives, and reassess it as a potential setup for the following session instead.
Disclaimer
Article Sources
- StockCharts ChartSchool: Cup With Handle - reference definition and structure of the cup and handle pattern
- StockCharts ChartSchool: Chart Patterns - broader classic pattern reference library
- FINRA: Understanding the New Intraday Margin Requirements - current regulatory framework for day-trading accounts
- FINRA Rule 2270: Day-Trading Risk Disclosure Statement - regulatory baseline for day-trading risk disclosure
- CME Group: Futures — Looking Beyond Technical Analysis - exchange-level perspective on the limits of pattern-based analysis
Was this helpful?
Be the first to weigh in

Written by
Kazi Mezanur RahmanFounder, independent researcher, and editor of DayTradingToolkit. A one-person publication focused on risk-first trading education and documented tool research. He trades his own capital as a retail trader and combines personal market experience with systematic primary-source research.
Keep Reading
Strategies
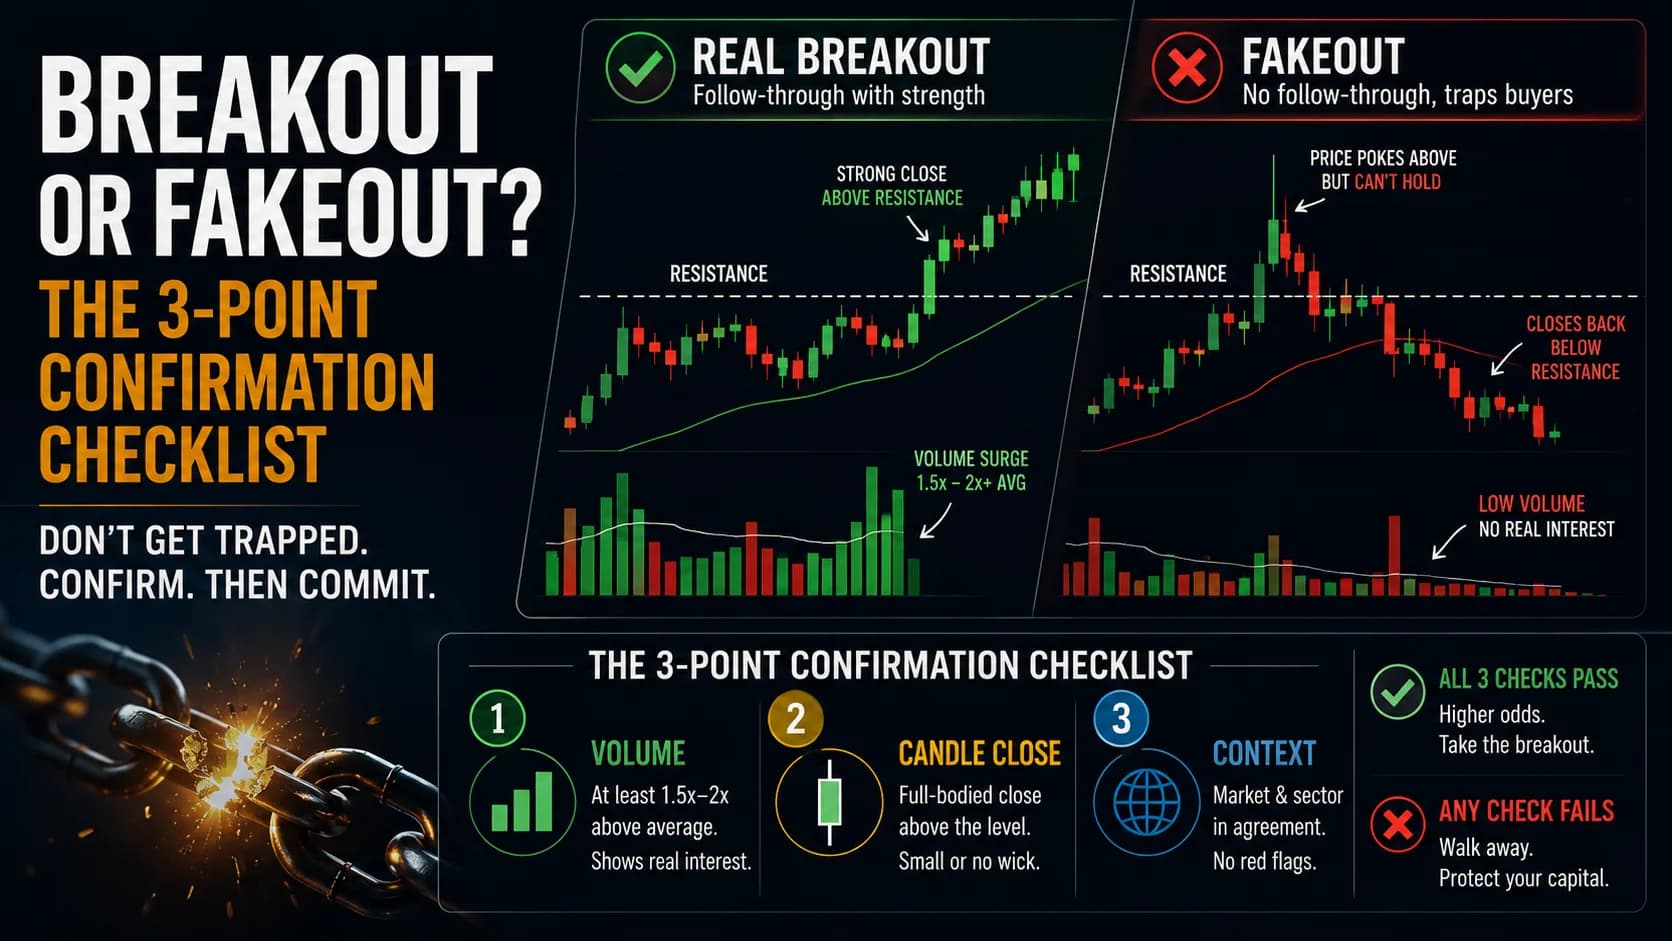
The Breakout vs. Fakeout Strategy: Our 3-Point Checklist
Not every break of resistance is real. This guide covers the volume, candle-close, and context checks that separate a genuine breakout from a costly trap.

Strategies
Trading Breakouts From Consolidation: The Volatility Contraction Pattern
The VCP isn't just a volatility squeeze. This guide covers the staged contraction sequence, the pivot point, and why context matters as much as the pattern.
Strategies
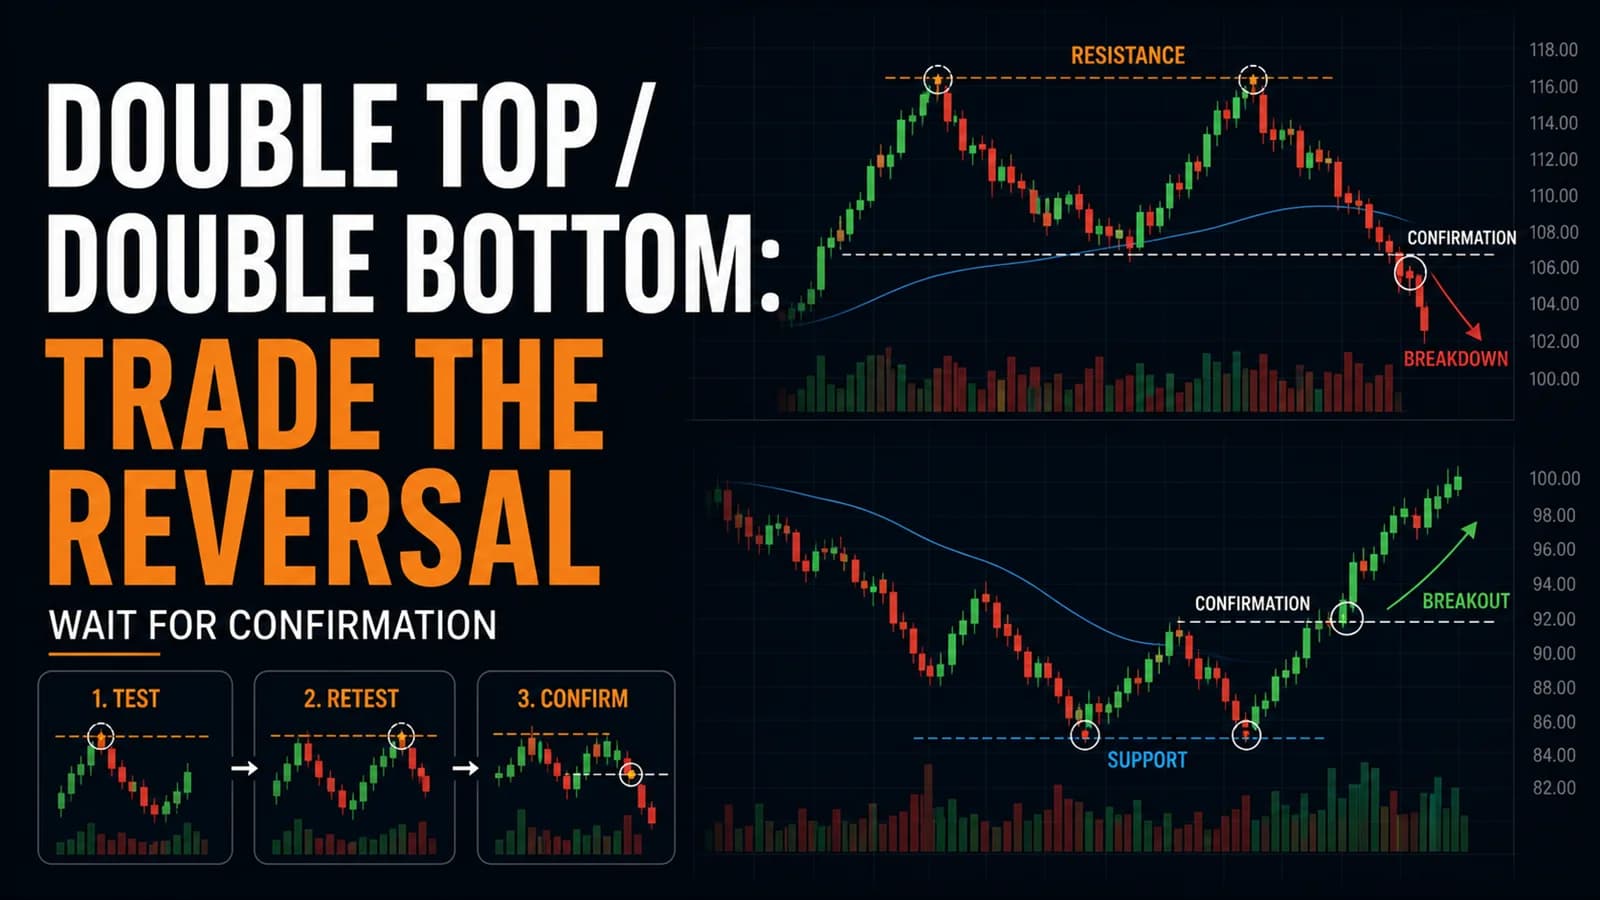
The Double Top / Double Bottom Trading Strategy
Most double tops never confirm. Here's the confirmation line that separates a real reversal from two random peaks, plus the honest failure rate behind each.
Strategies
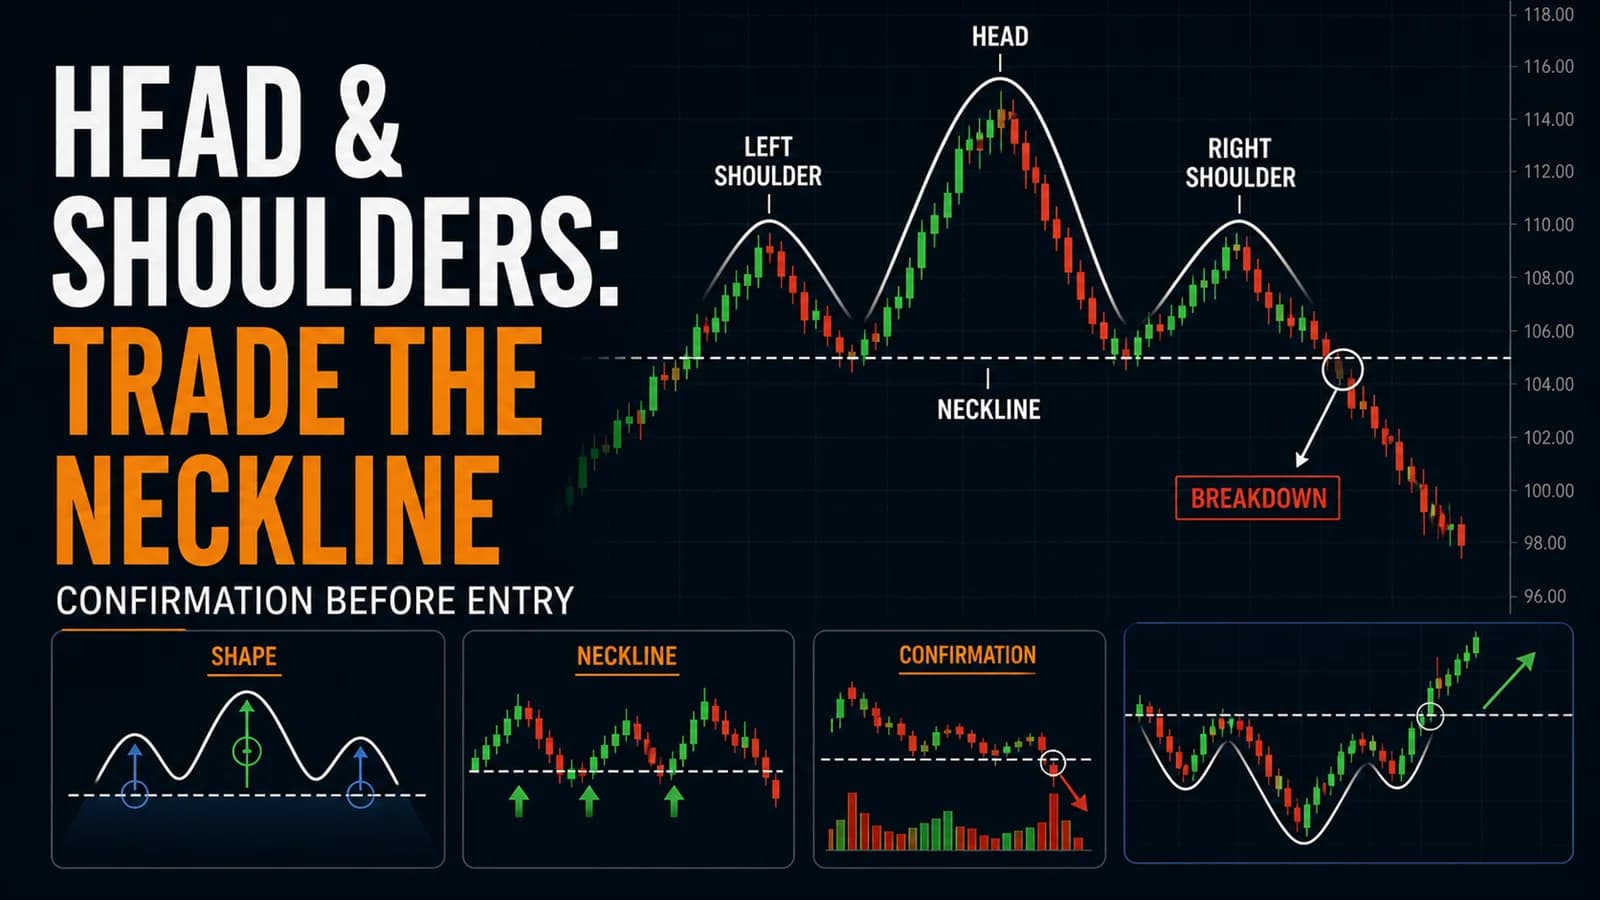
The Head and Shoulders Trading Strategy (And Inverse H&S)
The most famous reversal pattern in trading is also one of the most misdiagnosed. Here's how to actually confirm it before the neckline breaks.
Comments
No comments yet. Be the first to share your thoughts.