

Author Profile
Kazi Mezanur Rahman
Founder, independent researcher, and editor of DayTradingToolkit. A one-person publication focused on risk-first trading education and documented tool research. He trades his own capital as a retail trader and combines personal market experience with systematic primary-source research.
Areas of expertise
465
Published articles
Risk-first
Editorial focus
Independent
Review standard
About the Author
Kazi Mezanur Rahman is the founder, independent researcher, and editor behind DayTradingToolkit, a one-person publication. He built the site to organize practical trading education, primary-source research, calculators, and documented tool reviews in one place.
Kazi trades his own capital as a retail trader. He does not present himself as a professional trader, full-time trader, financial adviser, broker, accountant, or attorney. His experience comes from personal market participation combined with systematic research. The editorial approach is intentionally conservative: explain risks plainly, disclose affiliate relationships, avoid profit promises, clearly distinguish research from first-hand experience, and correct material errors when they are found.
Kazi oversees the site’s education library, research methodology, review structure, and content updates across beginner lessons, strategy explainers, psychology guides, calculators, and software comparisons.
Author Archive
Articles by Kazi Mezanur Rahman
Page 7 of 39. Showing 12 of 465 published guides, reviews, and trading resources.
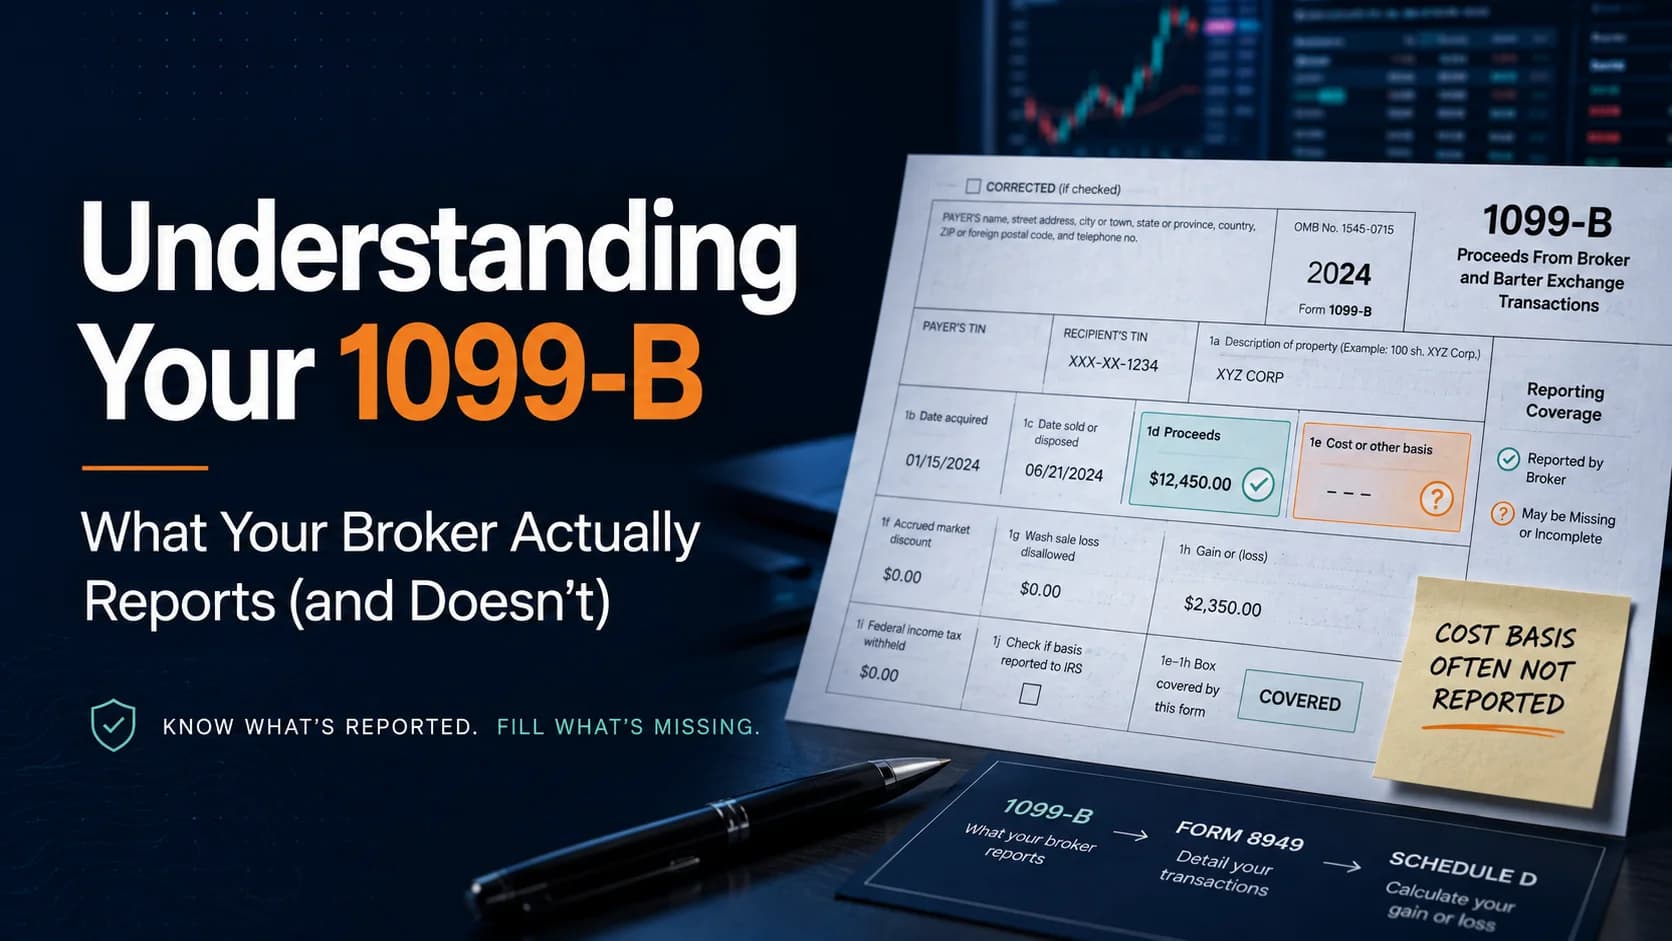
Understanding Your 1099-B: What Your Broker Actually Reports (and Doesn't)
A trader transfers her position to a new broker mid-year, sells the following year, and her 1099-B shows the full sale proceeds with no cost basis. Fourteen months later, a CP2000 notice arrives proposing tax on the entire amount as if she paid nothing for it. Here's how to read your 1099-B correctly before that happens to you.
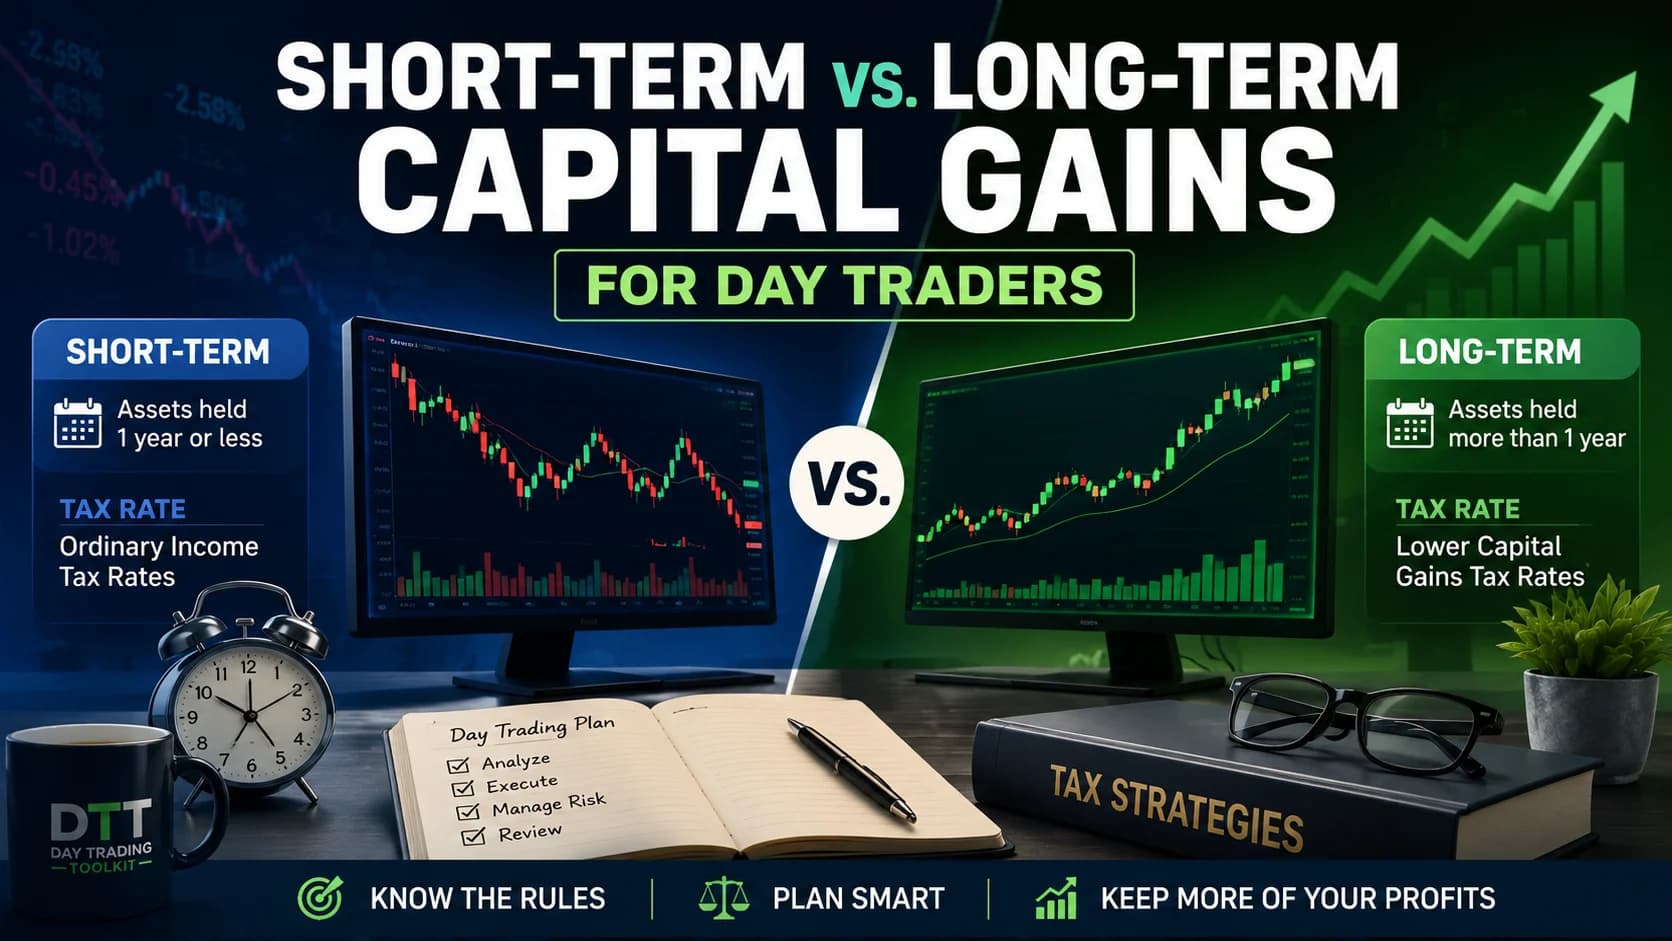
Short-Term vs. Long-Term Capital Gains for Day Traders
Two traders can make an identical $10,000 profit and owe a meaningfully different tax bill, purely from how many days they held the position. Almost every day trade lands on the expensive side of that split. Here's the holding-period rule, the full 2026 bracket numbers, the netting process, and the self-employment tax myth that sends traders toward the wrong strategy.

Anthropic's IPO: How Day Traders Should Prepare
Anthropic filed confidentially for an IPO at a $965 billion valuation. Here's the Nasdaq-100 fast entry rule, the lockup calendar, and the options timeline day traders should map out before it lists.
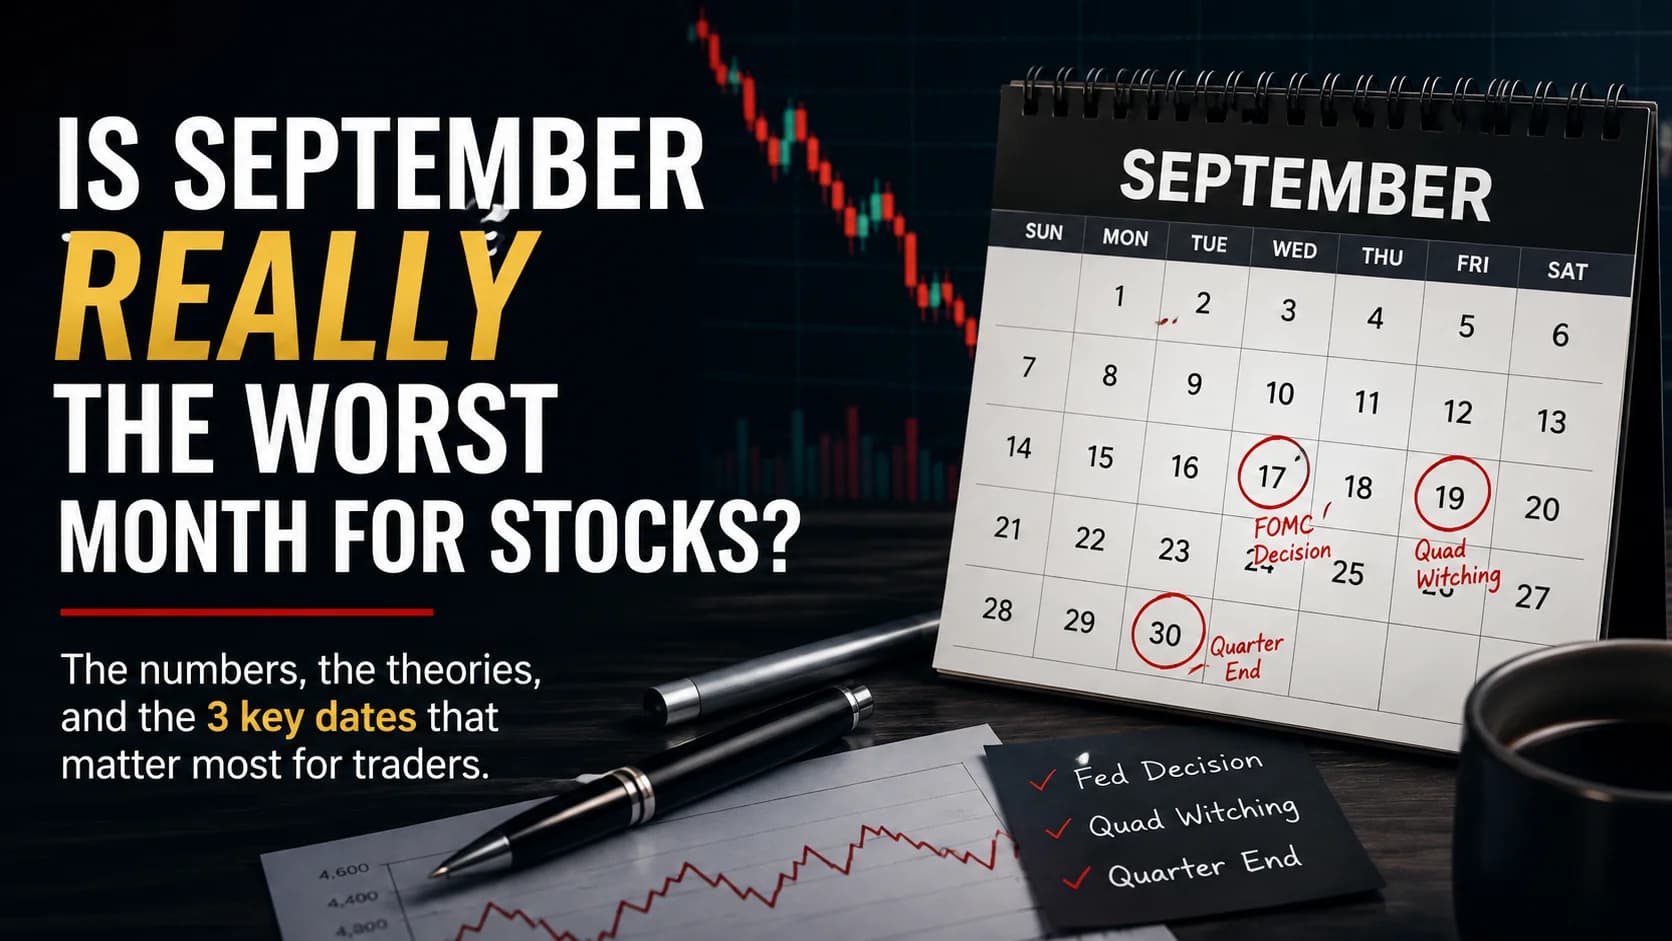
Is September Really the Worst Month for Stocks?
September has the market's worst average return, but the real story for traders this year is a Fed dot-plot meeting, quad witching, and a quarterly index rebalance all landing in the same five-day window.
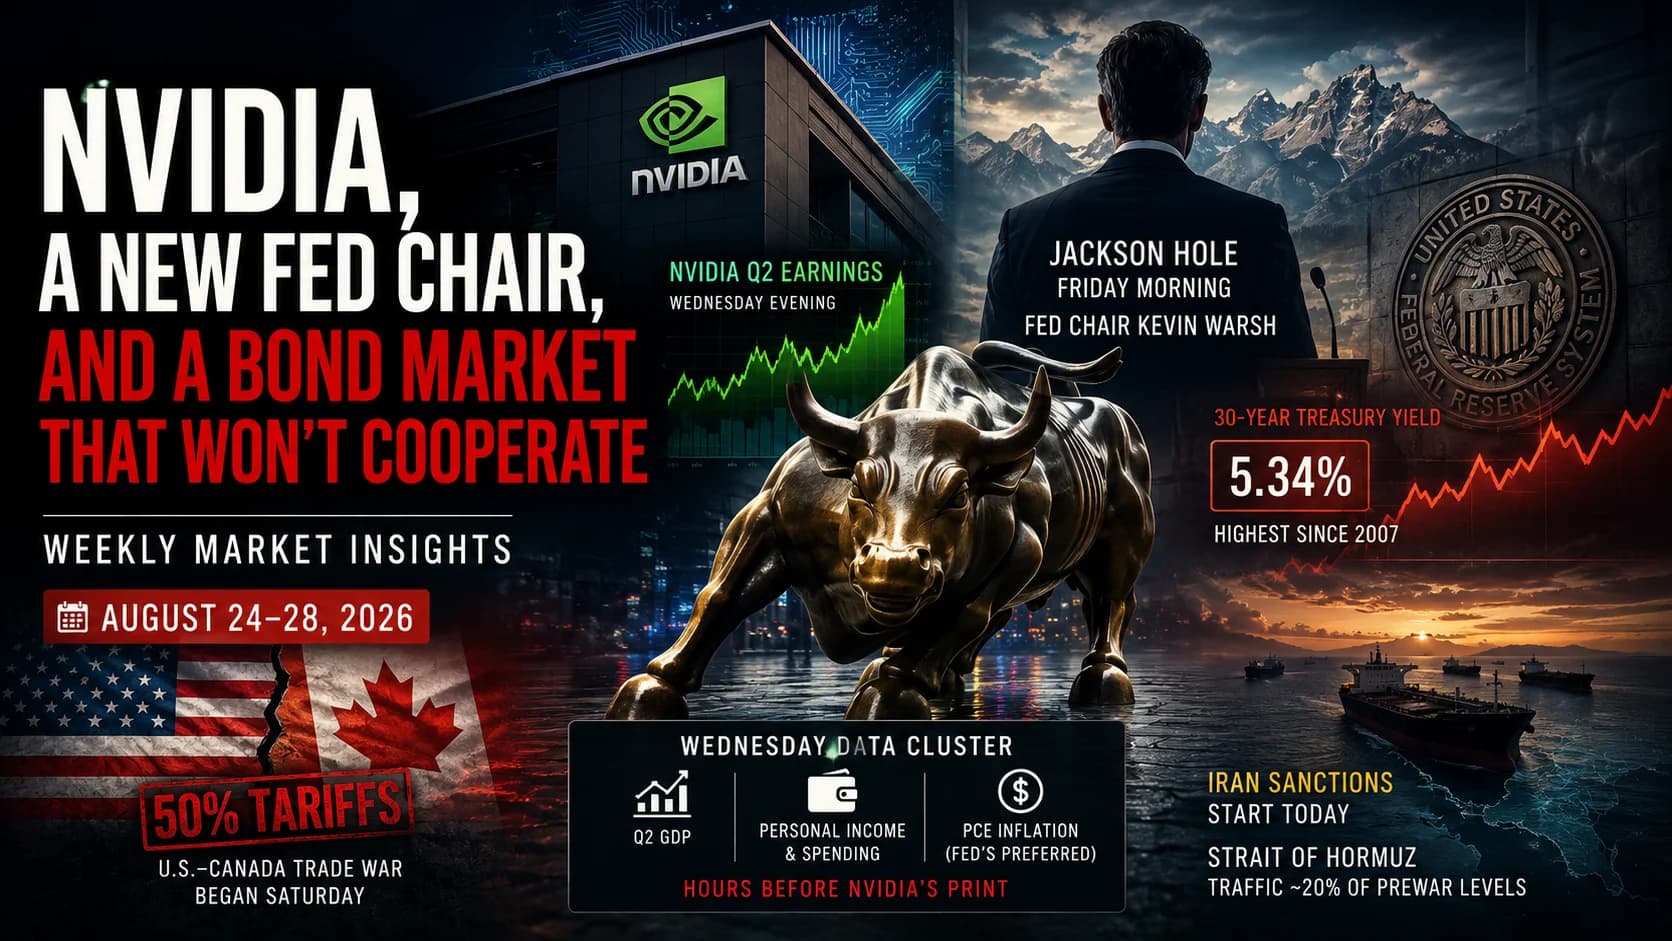
Nvidia, a New Fed Chair, and a Bond Market That Won't Cooperate: Weekly Market Insights, August 24-28
Warsh's first Jackson Hole speech, Nvidia's earnings, and fresh Iran and Canada shocks collide this week. The full Aug 24-28 catalyst map, stock watchlist, and scenario tree for traders.
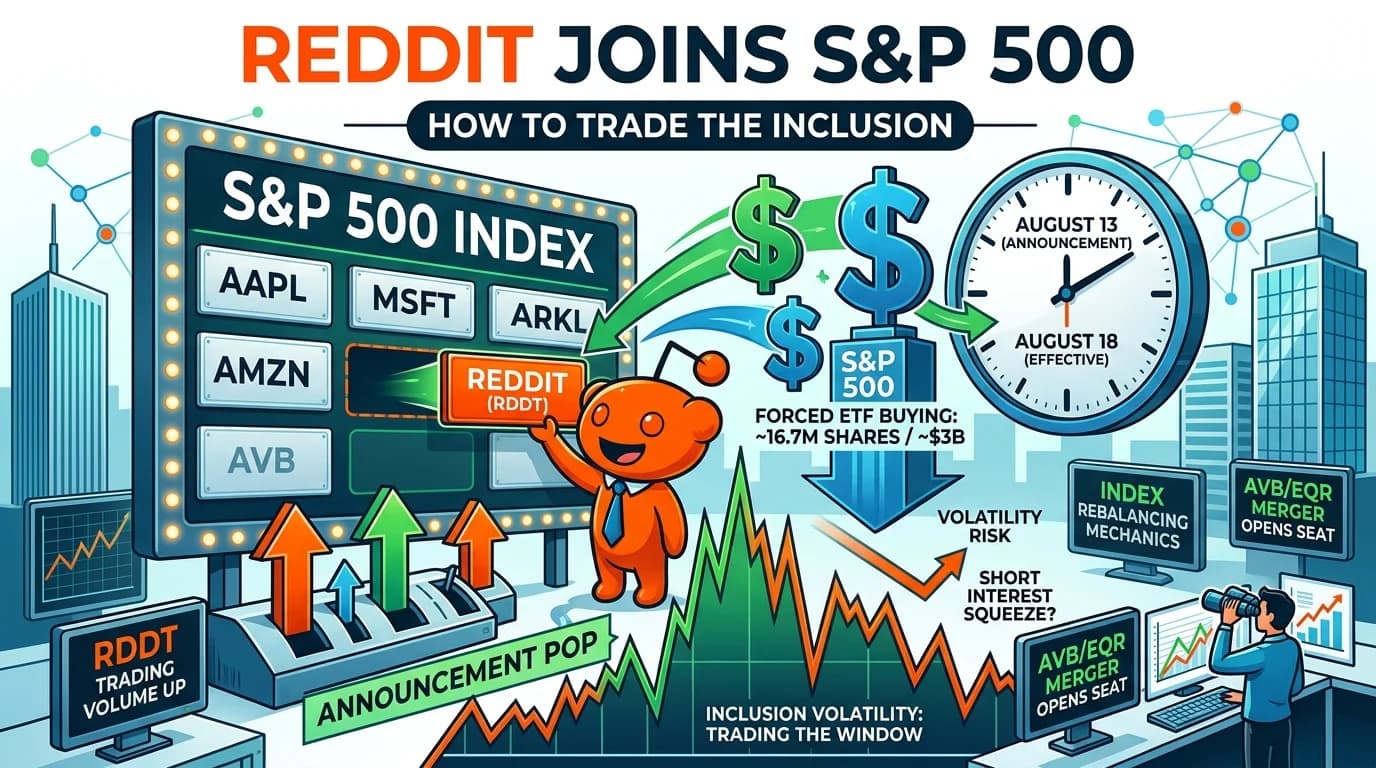
Reddit Joins the S&P 500: How to Trade the Inclusion
Reddit joined the S&P 500 on August 18, 2026, after AvalonBay's merger opened a seat. Here's the forced-buying math, what actually happened to RDDT across four sessions, and what history says about chasing an index addition.

How Stocks Actually Qualify for the S&P 500
The S&P 500 isn't a list of the 500 biggest US companies. It's a curated index with a two-part GAAP earnings test, a moving market-cap threshold, and a discretionary committee. Here's the real eligibility bar, using Reddit's own numbers as the case study.
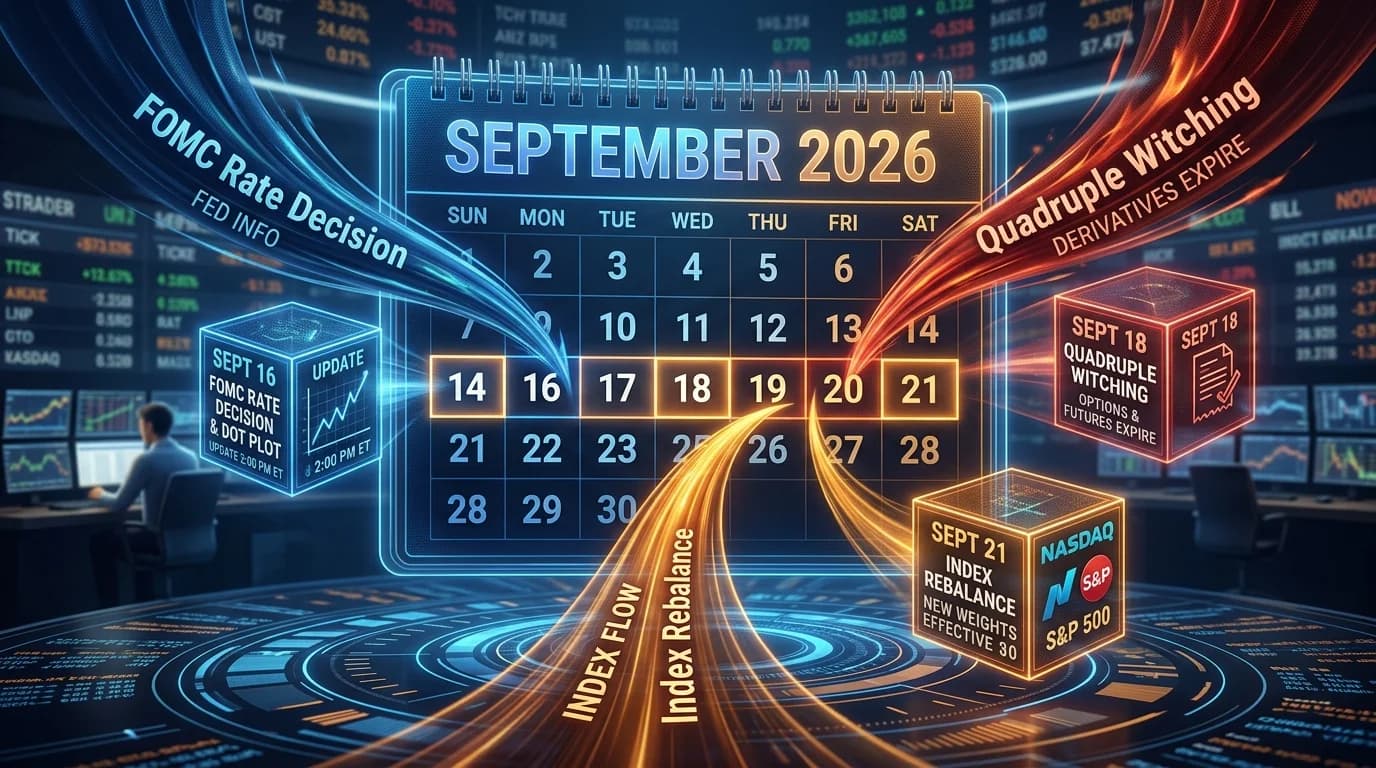
September's Trading Calendar: FOMC, Quad Witching, and the Rebalance All Land in One Week
Three major structural events land in the same five trading days this September: the FOMC's dot-plot meeting, quadruple witching, and the Nasdaq-100/S&P 500 quarterly rebalance. Here's how they interact and how to prepare.
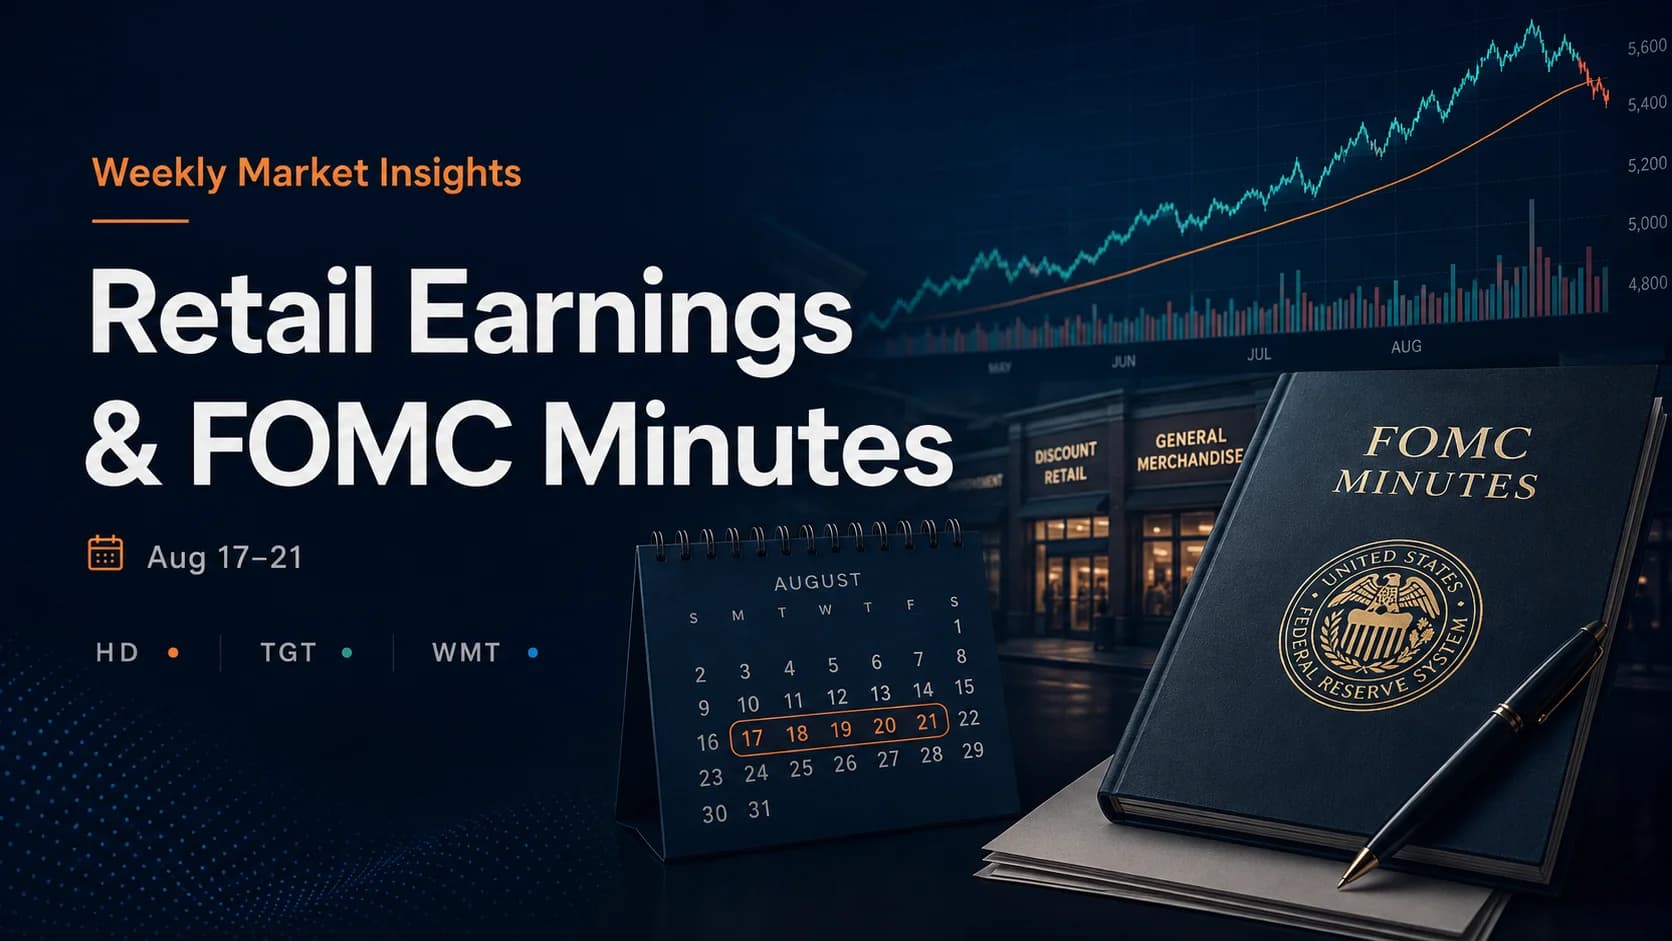
Calm Markets, Cracking Consumer: Weekly Market Insights, August 17-21
Records sit atop a divided Fed (9-3, most split since 2016), rising oil, and cracking consumer data. This week's five retail earnings, FOMC minutes, and an active Hormuz standoff will test whether the calm is justified.
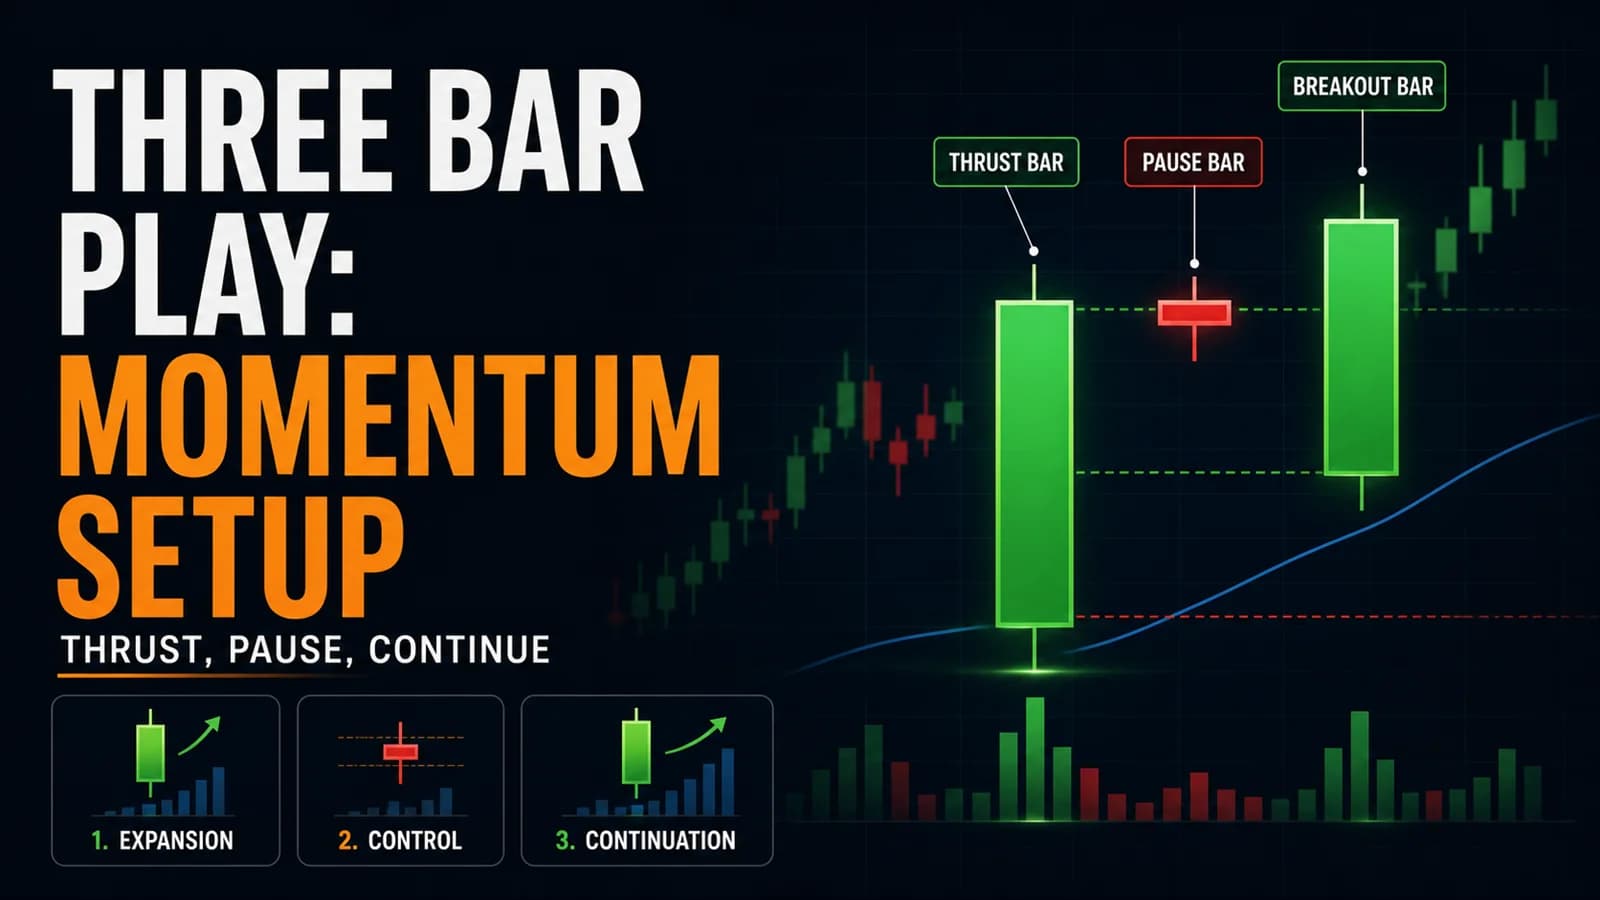
The Three Bar Play Strategy
A guide to trading the three bar play, the price-action continuation setup popularized by Linda Raschke and Laurence Connors.
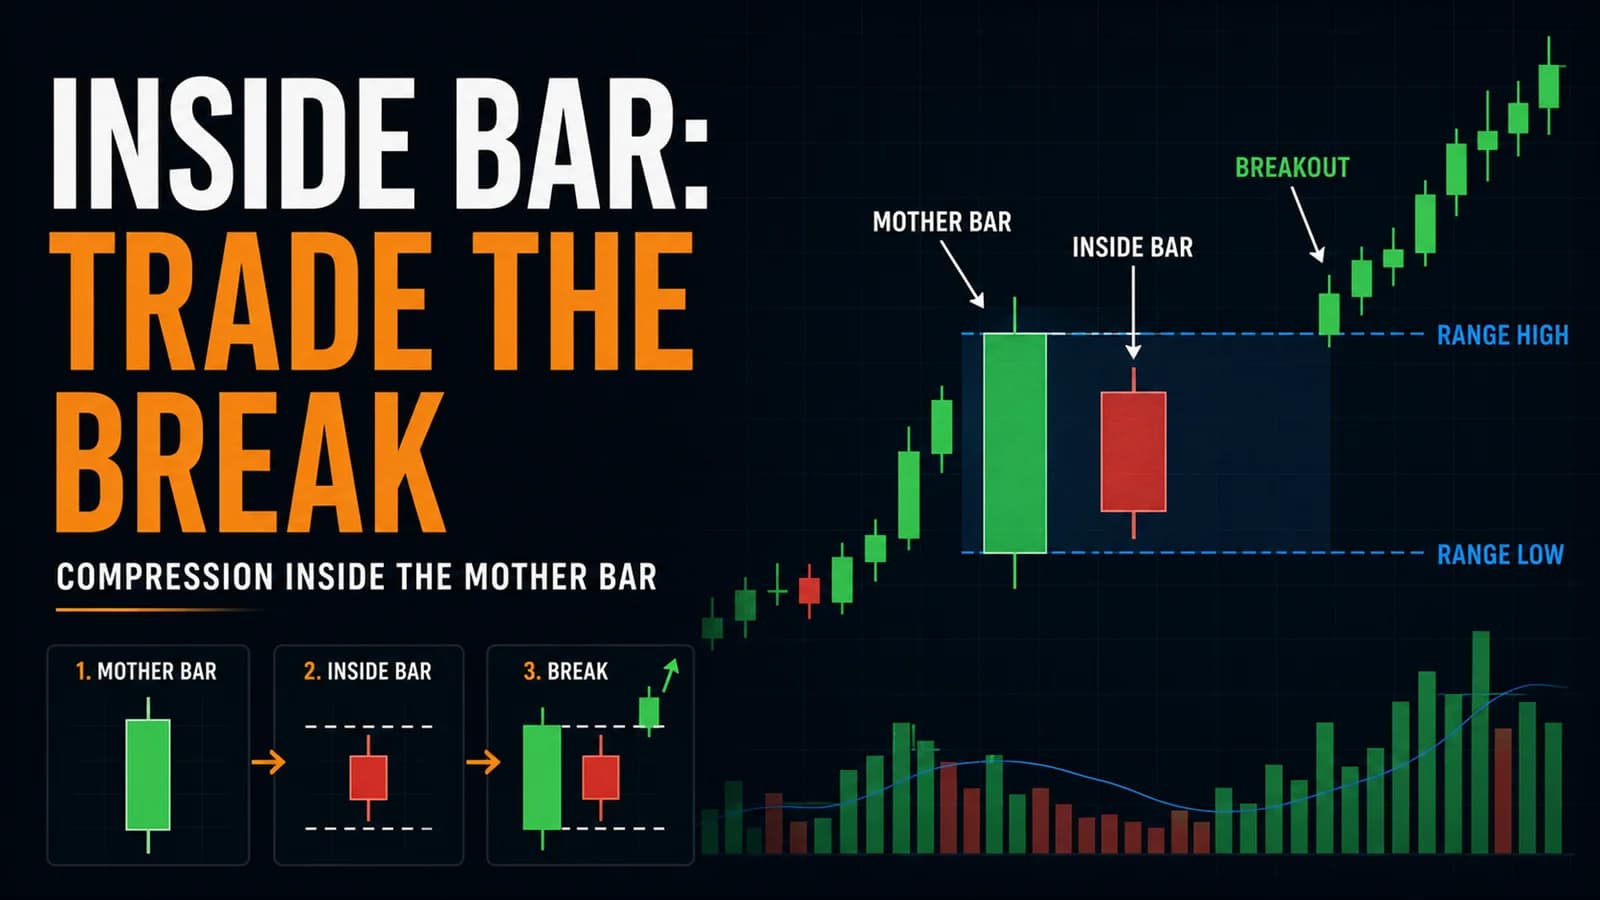
The Inside Bar Trading Strategy
A practical guide to trading inside bars intraday, covering mother bar quality, the Setup Spec, trade management, and honest failure cases.
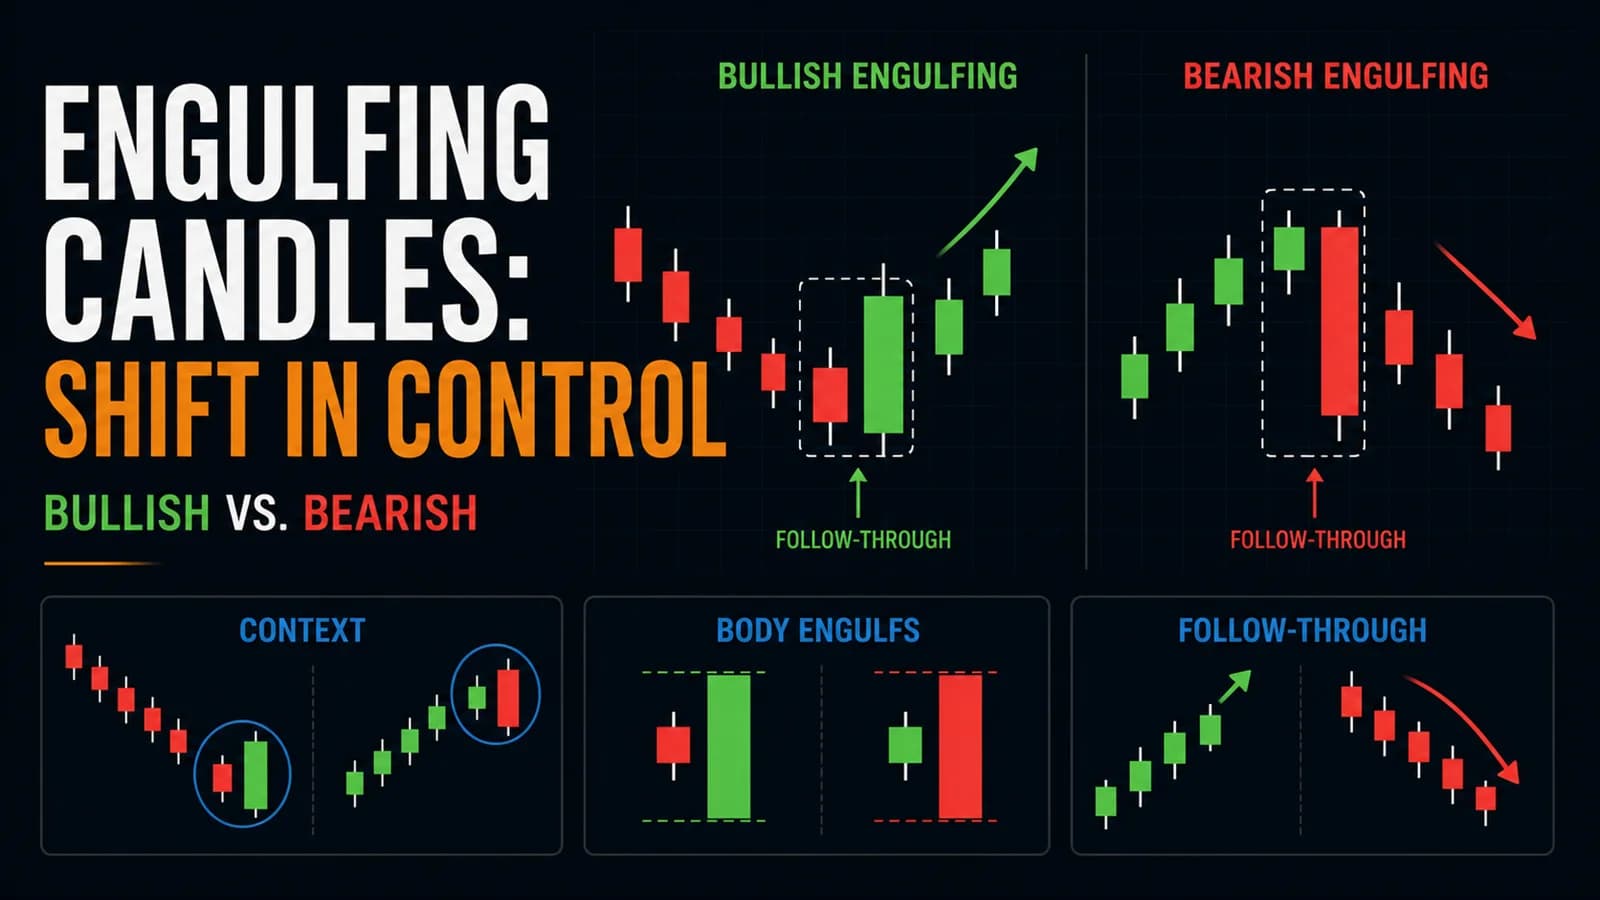
The Engulfing Candle Trading Strategy
Bullish and bearish engulfing candles aren't equally reliable, and neither works quite the way most trading courses teach. Here's the research-backed version.