
The Inside Bar Trading Strategy

In this article9 sections
A candle that goes nowhere might be the most useful bar on your chart. When one bar's entire range fits inside the previous bar's high and low, the market isn't asleep. It's coiling, and coiled things tend to spring. Traders who learn to read that coil, rather than ignore it as a dull bar, get an early read on which way the next move is likely to break.
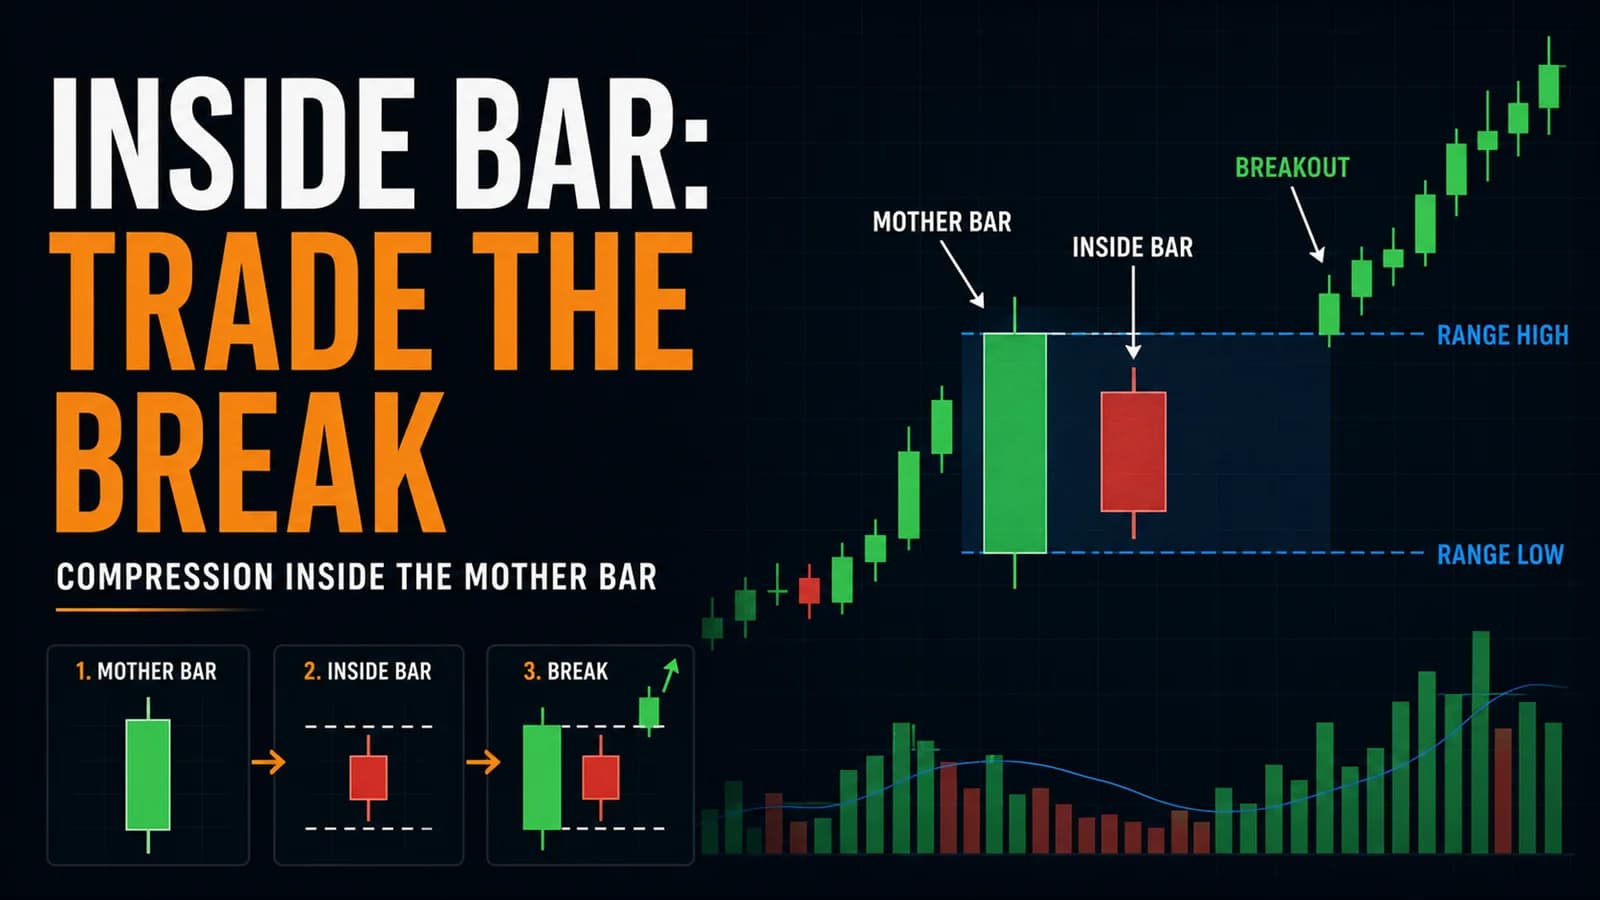
What is an Inside Bar? An inside bar is a price bar whose high and low sit completely within the high and low of the bar immediately before it, known as the mother bar. The pattern signals a pause in directional momentum as buyers and sellers reach a temporary standoff, and traders treat the eventual break of the mother bar's range as the signal that the standoff has resolved.
Inside Bar vs. This Site's Inside Day Setup
It's worth clearing up a naming collision before going further. DayTradingToolkit already covers the Inside Day Breakout Strategy, which applies this same contraction logic on the daily chart as a multi-day swing setup: one full trading session prints inside the prior session's range, and the trade plan works across days.
This article is a different application of the identical logic, compressed into a single trading session. Here, the "bar" is a 1-minute, 5-minute, or 15-minute candle, the "mother bar" forms and resolves within minutes or hours rather than days, and the trade is opened and typically closed before the closing bell. The underlying mechanic (contraction, then a directional break) is the same. The timeframe, holding period, and risk profile are not. If your plan is to hold overnight, use the daily version. If you're managing risk and flat by the close, this is the version built for that.
What Makes an Inside Bar Worth Trading
Not every inside bar deserves a trade. Most are noise. The ones worth acting on share a few traits.
Mother bar quality matters more than the inside bar itself. A mother bar formed on a strong directional impulse, a wide-range candle on above-average volume, sets up a more meaningful contraction than a mother bar that was already narrow and directionless. A tight coil after a big move reads as genuine hesitation. A tight coil after another tight bar just reads as a dead market.
Location relative to a prior level changes the read. An inside bar that forms right at a well-tested support or resistance level, at the top of an opening range, or at a prior day's high or low carries more weight than one that forms in the middle of open air. The level gives the eventual breakout a reason to matter to other traders watching the same chart.
Volume should contract during the inside bar and expand on the break. Declining volume while the range compresses supports the idea that participants are stepping back rather than fighting for control. A volume spike on the breakout bar itself, ideally above the recent average, adds confidence that real participation is behind the move rather than a single order pushing price through a quiet range.
Context from the broader trend still applies. An inside bar that forms as a brief pause within an established trend, sometimes called a flag-like pause, tends to resolve in the direction of that trend more often than an inside bar that forms with no clear trend behind it. Trading inside bars in isolation, without reference to the larger structure on a higher timeframe chart, is one of the more common ways this setup underperforms.
Inside Bar Setup Spec
- Component
- Market Conditions Required
- Specification
- A clear mother bar (wide range, above-average volume) followed by one or more bars fully contained within it; ideally forming near a recognizable level or within an existing trend
- Component
- Time of Day
- Specification
- Strongest after the first 30-60 minutes once the opening range has established a reference high and low; avoid the low-volume midday stretch unless the inside bar sits at a major level
- Component
- Stock Selection Criteria
- Specification
- Liquid names with enough range to make the mother bar meaningful; thin, low-volume tickers produce inside bars that are just noise
- Component
- Entry Trigger
- Specification
- A stop order placed just beyond the mother bar's high (for a long) or low (for a short), triggered only when price closes back outside the inside bar's own range on the breakout candle
- Component
- Stop Loss
- Specification
- Just beyond the opposite side of the mother bar, giving the trade room to fail cleanly without moving the stop-loss point every time a new inside bar forms
- Component
- Initial Profit Target
- Specification
- A distance equal to the mother bar's range, projected from the breakout point, as a baseline measured move
- Component
- Trade Management
- Specification
- Move the stop to breakeven once price clears roughly one mother-bar range in the trade's favor, then trail behind subsequent swing points
- Component
- Invalidation Criteria
- Specification
- Price closes back inside the mother bar's range after triggering the breakout, or a third or fourth consecutive inside bar forms without any range expansion, signaling the coil has gone stale
| Component | Specification |
|---|---|
| Market Conditions Required | A clear mother bar (wide range, above-average volume) followed by one or more bars fully contained within it; ideally forming near a recognizable level or within an existing trend |
| Time of Day | Strongest after the first 30-60 minutes once the opening range has established a reference high and low; avoid the low-volume midday stretch unless the inside bar sits at a major level |
| Stock Selection Criteria | Liquid names with enough range to make the mother bar meaningful; thin, low-volume tickers produce inside bars that are just noise |
| Entry Trigger | A stop order placed just beyond the mother bar's high (for a long) or low (for a short), triggered only when price closes back outside the inside bar's own range on the breakout candle |
| Stop Loss | Just beyond the opposite side of the mother bar, giving the trade room to fail cleanly without moving the stop-loss point every time a new inside bar forms |
| Initial Profit Target | A distance equal to the mother bar's range, projected from the breakout point, as a baseline measured move |
| Trade Management | Move the stop to breakeven once price clears roughly one mother-bar range in the trade's favor, then trail behind subsequent swing points |
| Invalidation Criteria | Price closes back inside the mother bar's range after triggering the breakout, or a third or fourth consecutive inside bar forms without any range expansion, signaling the coil has gone stale |
Trading the Break: A Step-by-Step Walkthrough
Picture ticker XYZ pushing higher off the open on rising volume, printing a wide green candle that adds a full percentage point in fifteen minutes. That's the mother bar. Momentum stalls, and the next three 5-minute candles each print smaller ranges, all fully contained within that first wide bar. Volume tapers with each one.
A trader watching this doesn't guess at direction. They mark the mother bar's high and low and wait. A buy-stop order sits just above the mother bar's high; a corresponding stop-loss sits just below the mother bar's low. Neither order requires staring at the screen tick by tick.
When XYZ finally prints a candle that closes above the mother bar's high on renewed volume, the long triggers. The stop-loss stays where it was originally set, below the mother bar's low, defining the full risk on the trade before it ever opened. The initial target sits one mother-bar range above the entry, the baseline measured move from the Setup Spec.
If instead XYZ had rolled over and closed below the mother bar's low, the same structure would have triggered a short with the stop placed above the mother bar's high. The setup doesn't predict which way the coil breaks. It defines the trade for either outcome in advance, which is the actual value of trading a defined range rather than guessing at a reversal.
Managing the Trade Once Price Moves
Once price clears the initial target zone, the mechanical choice is between banking the full measured move or trailing for more. A common approach: take partial profit at the one-range target, then trail the stop behind the most recent short-term swing low (for a long) or swing high (for a short) on the remaining size. This lets a strong breakout run while locking in something on the portion that behaves as the Setup Spec predicted.
Watch the first pullback after the breakout closely. A shallow, orderly pullback that holds above the old mother-bar high (now acting as support) supports staying in the trade. A sharp reversal that erases most of the breakout candle's range, especially on rising volume, is an early warning that the move may have been a trap rather than a genuine expansion. There's no shame in exiting early on that kind of reversal; the alternative is giving back the gain plus the original risk.
Where the Inside Bar Fails
Honest accounting matters more than hype here. Inside bars fail in a few predictable ways.
The most common failure is the false breakout: price triggers the entry, moves a few ticks in the expected direction, then reverses hard back through the mother bar's opposite boundary. This happens most often when the mother bar itself was mediocre (narrow range, unremarkable volume) or when the inside bar formed in the middle of a range with no nearby level to give the breakout meaning. A contraction pattern without a genuine coil behind it just produces two false signals instead of one.
A second failure mode shows up in choppy, low-volume conditions, particularly the midday session, where price can print inside bar after inside bar without ever committing to a direction. Each one looks tradeable in isolation. Strung together, they're a market that's simply quiet, not one that's building energy for a breakout. The Invalidation Criteria in the Setup Spec exists specifically to catch this: three or four inside bars in a row with no range expansion is a signal to stop watching, not to keep waiting for the fifth one to be the winner.
A third failure comes from ignoring the broader trend. An inside bar that breaks against a strong prevailing trend on a higher timeframe has less follow-through, on average, than one that breaks in the trend's direction. Traders who treat every inside bar as a standalone signal, without checking what the 15-minute or hourly chart is doing, give up an edge that costs nothing to check.

Variations: Multiple Inside Bars and the Inside-Outside Combo
Multiple inside bars (the coil). Sometimes two or three bars in a row each print inside the one before, forming a tightening coil rather than a single inside bar. When each successive bar narrows the range further, the eventual breakout, whichever direction it goes, tends to carry more force simply because the compression has run longer. The trade mechanics don't change: the outermost boundary (the original mother bar's high and low) still defines entry and stop.
The inside-outside combination. An inside bar is sometimes followed immediately by an outside bar, a candle whose range exceeds the mother bar's high and low on both sides. This combination often marks a sharper resolution than a standard inside bar breakout, since the outside bar itself represents an expansion in both directions before settling on one. Some traders treat the outside bar's own close as an added confirmation layer on top of the original inside bar trigger.
Inside bar at the open. An inside bar that forms using the very first candle of the session as the mother bar behaves differently than one appearing later. Early-session ranges are still being established, so a first-bar inside pattern often reflects indecision about the day's direction rather than a genuine pause after a real move. It's not invalid, but it deserves more caution than a mid-morning inside bar following a clean trending impulse.
Tools That Help You Spot and Confirm Inside Bars
Spotting inside bars manually across a watchlist is slow and error-prone, particularly on lower timeframes where dozens can form in a single session across dozens of tickers. A scanner that can flag narrow-range and contained-range candles in real time turns this from a guessing game into a systematic watchlist. Trade Ideas is one option built for this kind of real-time pattern and volume scanning, letting a trader set contraction and volume-decline criteria rather than scrolling charts one at a time looking for the setup by eye.
Beyond scanning, any standard charting platform with volume overlays and the ability to mark horizontal levels is sufficient to trade this setup manually. The pattern doesn't require specialized indicators. It requires clean price and volume data and the discipline to only act on mother bars that meet the quality bar described above.
Where the Inside Bar Fits in a Trading Plan
The inside bar works best as a supporting tool inside a broader plan rather than a strategy practiced in isolation. It pairs naturally with support and resistance trading, since inside bars that form at known levels carry more information than ones that don't. It also pairs well with opening range strategies, where an inside bar forming just outside the established opening range can mark the moment consolidation gives way to the next leg.
Position sizing should reflect that a meaningful share of inside bar breakouts fail or reverse quickly. Because the stop-loss sits at a known, fixed distance (the far side of the mother bar), calculating position size from that distance and a fixed percentage of account risk keeps any single false breakout from being a costly mistake. This setup rewards patience in bar selection more than it rewards trading every contraction that appears on the screen.
What is an inside bar in trading?
The pattern reflects a temporary standoff between buyers and sellers after the mother bar's move. Traders use a break of the mother bar's high or low as the signal that the standoff has resolved, entering in the direction of that break with a stop on the opposite side of the mother bar.
Key Takeaway: An inside bar is defined entirely by its relationship to the prior candle, not by its own shape.
How is an inside bar different from an inside day?
Both rely on identical logic, a contained range following a wider one, but the holding period, risk exposure, and appropriate stop distance differ substantially between the two. DayTradingToolkit covers the daily-chart version separately in the Inside Day Breakout Strategy.
Key Takeaway: Match the version of the pattern to your actual holding period; don't apply daily-chart risk assumptions to a 5-minute setup or vice versa.
What's the difference between an inside bar and a narrow-range bar (NR7)?
A bar can be an inside bar without being unusually narrow in absolute terms, and a narrow-range bar can occur without being fully contained inside the prior candle. In practice, the two concepts frequently overlap, and traders who track both often get a stronger signal when a bar qualifies as both.
Key Takeaway: The two patterns measure contraction from different reference points, and a setup that satisfies both carries more weight than either alone.
Do inside bars work better in trending or ranging markets?
A pause within a trend has a directional bias already working in its favor, so the breakout is more likely to extend that existing move. An inside bar that forms with no clear trend on the higher timeframe has no such tailwind, and the breakout direction becomes closer to a coin flip.
Key Takeaway: Check the higher timeframe trend before trading an inside bar; it materially changes the odds.
What time frame is best for trading inside bars intraday?
Very short timeframes, like 1-minute charts, produce far more inside bars, but a much higher share of them are noise rather than genuine contraction. Longer intraday timeframes, like 30-minute or hourly charts, produce fewer but generally higher-quality signals, at the cost of needing more of the session to play out before the setup resolves.
Key Takeaway: Start with a 5-minute or 15-minute chart and adjust based on how many quality mother bars a given ticker actually produces.
How do you set a stop loss on an inside bar trade?
For a long entry triggered above the mother bar's high, the stop sits below the mother bar's low. For a short entry triggered below the mother bar's low, the stop sits above the mother bar's high. This keeps the stop distance tied to the actual structure of the setup instead of a fixed dollar or percentage amount that ignores what the chart is showing.
Key Takeaway: Let the mother bar's own range set the stop distance, then size the position to match your account risk tolerance.
Can an inside bar break out in the wrong direction and reverse?
A false breakout typically shows price triggering the entry, moving a small distance, and then reversing back through the opposite boundary of the mother bar on increased volume. This is exactly what the fixed stop-loss on the far side of the mother bar is designed to contain.
Key Takeaway: Treat the stop-loss as a real expectation, not a formality; false breakouts happen often enough that risk control has to be non-negotiable.
What is a "mother bar" and why does its size matter?
A wide, high-volume mother bar reflects a real directional push that then paused, which makes the eventual contraction more meaningful. A narrow, low-volume mother bar was already quiet before the "inside" bar formed, which means the pattern is really just two quiet bars in a row rather than genuine consolidation after momentum.
Key Takeaway: Judge the mother bar on its own merits before assuming the inside bar that follows it is worth trading.
Should you trade every inside bar you see?
Selectivity is the actual skill here. A trader who waits for an inside bar with a strong mother bar, a meaningful nearby level, and volume contraction into the pattern will see far fewer setups per day than one who trades any bar that happens to fit inside the previous one, but the setups that pass the filter behave more consistently.
Key Takeaway: Fewer, higher-quality inside bar trades tend to outperform trading every contraction that appears on the chart.
How do inside bars fit into a larger day trading strategy?
Used this way, the inside bar answers a narrower question than "should I trade this stock today." It answers "has the pause at this specific level or within this specific trend resolved yet," which is a more precise trigger than watching price action without a defined reference range.
Key Takeaway: Pair the inside bar with a level or a trend you'd already be watching, and let it serve as the timing trigger rather than the whole thesis.
Disclaimer
Article Sources
- StockCharts ChartSchool: Introduction to Candlesticks - foundational reference on candle structure and range-based patterns
- StockCharts ChartSchool: Chart Patterns - overview of consolidation and continuation pattern behavior
- CME Group: Technical Analysis - educational material on range contraction and breakout concepts
- FINRA: Day Trading Margin Requirements - current intraday margin and risk rules relevant to active trading
Was this helpful?
Be the first to weigh in

Written by
Kazi Mezanur RahmanFounder, independent researcher, and editor of DayTradingToolkit. A one-person publication focused on risk-first trading education and documented tool research. He trades his own capital as a retail trader and combines personal market experience with systematic primary-source research.
Keep Reading
Strategies
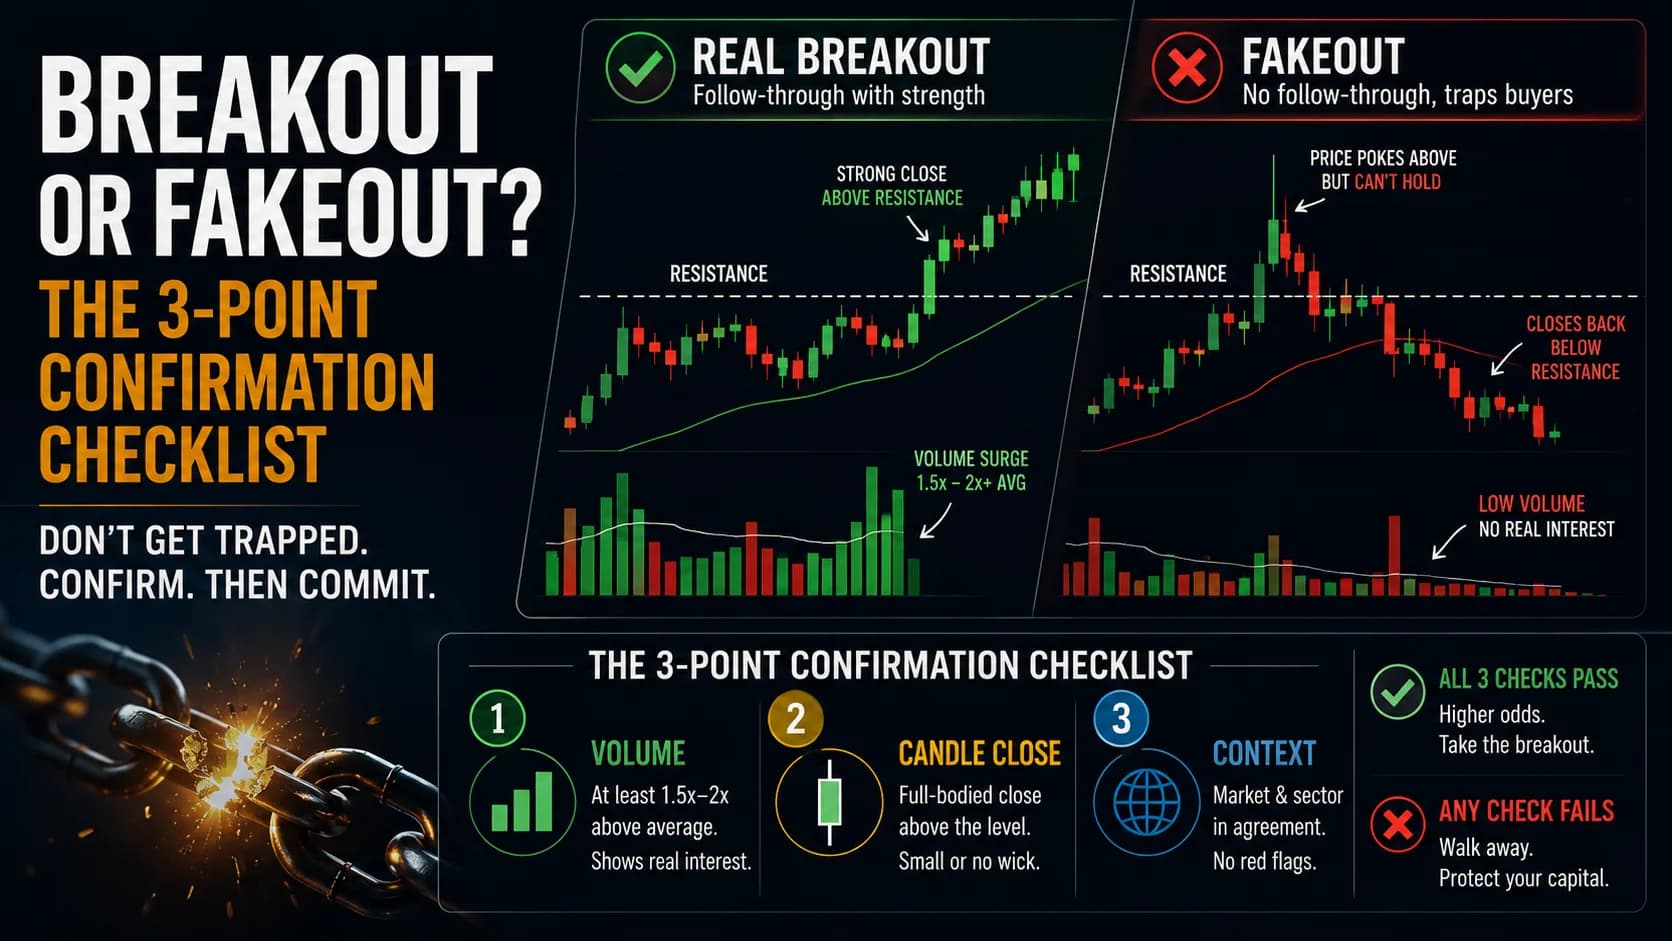
The Breakout vs. Fakeout Strategy: Our 3-Point Checklist
Not every break of resistance is real. This guide covers the volume, candle-close, and context checks that separate a genuine breakout from a costly trap.

Strategies
Trading the Breakout of Prior-Day High/Low Levels
PDH and PDL need no formula, just yesterday's range. This guide covers the breakout, the liquidity-sweep fade, and why stops cluster right at these levels.

Strategies
Trading Breakouts From Consolidation: The Volatility Contraction Pattern
The VCP isn't just a volatility squeeze. This guide covers the staged contraction sequence, the pivot point, and why context matters as much as the pattern.
Strategies
The 1-Minute Scalp Strategy for Active Day Traders
On a 1-minute chart, some of what looks like real price action is just mechanical noise. This guide covers the setup, and how to tell the difference well.
Comments
No comments yet. Be the first to share your thoughts.