
The Engulfing Candle Trading Strategy

In this article11 sections
A stock has been sliding for twenty minutes when a single candle prints that fully swallows the previous one: a lower open, a higher close, a body that engulfs the prior candle's entire range. It looks like a decisive turn, the kind of candle that gets pointed to as proof a reversal just happened. The underlying research on this exact pattern says something more specific and more useful: it depends heavily on where that candle forms, and the bullish and bearish versions aren't nearly as similar in reliability as they're usually taught to be.
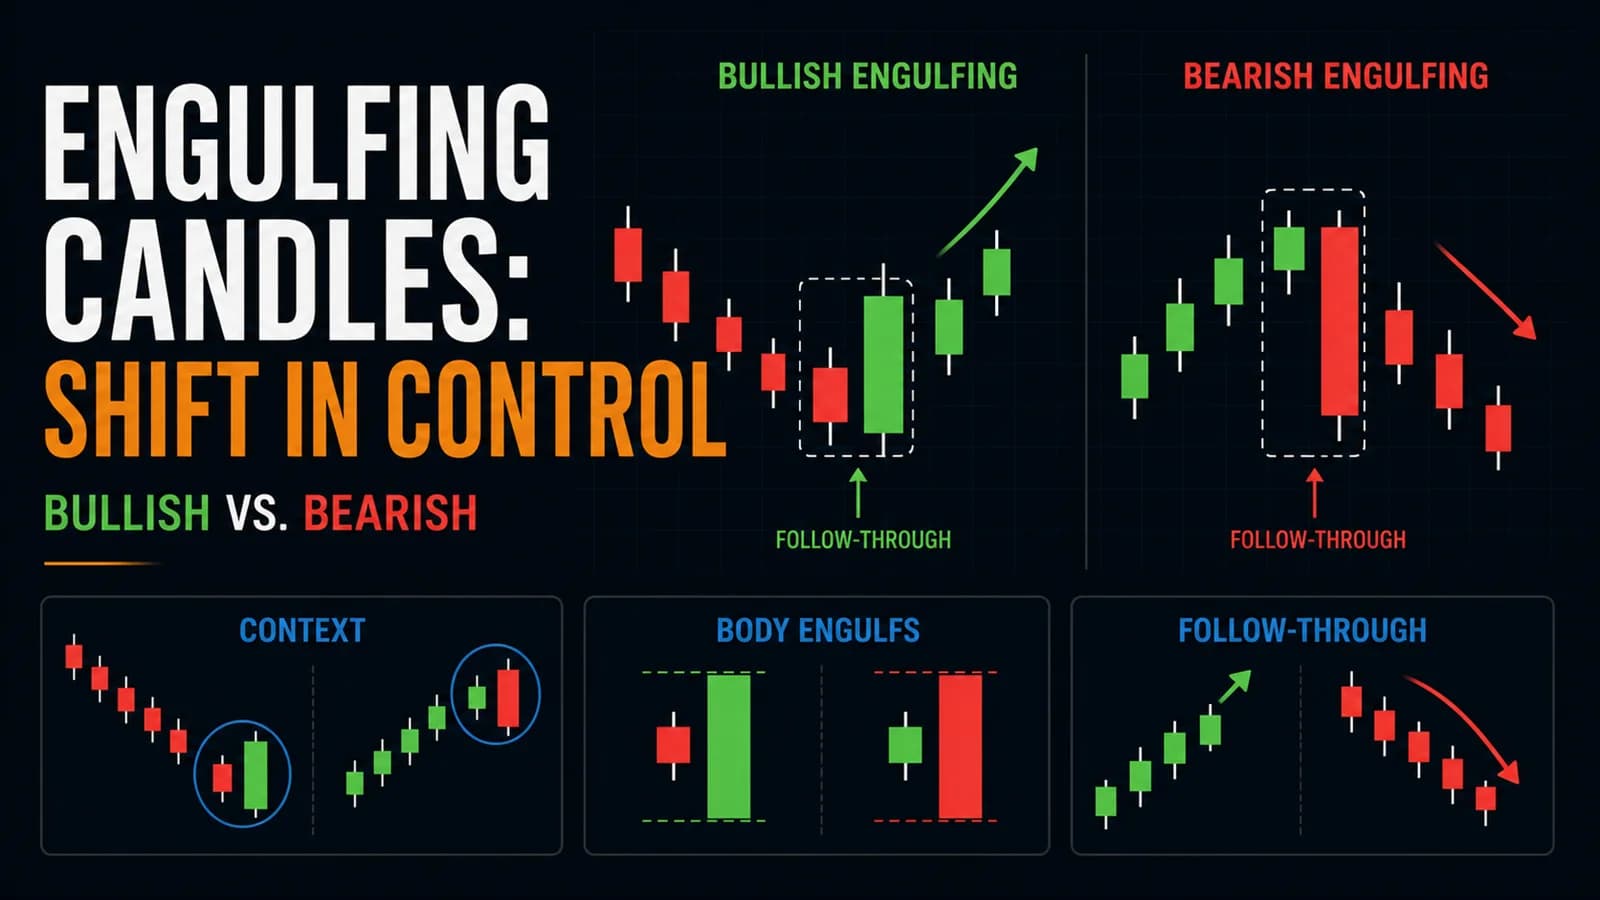
What is an engulfing candle pattern? An engulfing pattern is a two-candle formation where the second candle's body fully covers, or "engulfs," the first candle's body in the opposite direction. A bullish engulfing pattern has a down candle followed by a larger up candle whose body covers the down candle entirely, signaling a shift from selling to buying pressure. A bearish engulfing pattern is the mirror image: an up candle followed by a larger down candle, signaling a shift from buying to selling pressure.
Why Bullish and Bearish Engulfing Aren't Mirror-Image Equals
Most trading education treats bullish and bearish engulfing patterns as symmetric opposites: same rules, same reliability, just flipped direction. The underlying statistical research doesn't support that symmetry. Independent research into both versions, covered in full later in this guide, found meaningfully different reversal reliability between the two, with the bearish version confirming its expected direction considerably more often than the bullish version does.
That asymmetry matters for how much conviction a trader should assign to each version before layering on other confirmation. It also connects to a broader theme across this hub's candlestick coverage: patterns that look like mirror images on a chart don't always behave like mirror images once tested against real outcomes.
Reading Where an Engulfing Candle Forms, Not Just What It Looks Like
Best conditions: The single biggest factor in this pattern's real-world performance, according to the research covered below, is whether it forms as a genuine trend reversal at an extreme or as a pullback resolution within an already-established trend. A bullish engulfing candle forming after a shallow pullback within an ongoing uptrend has a meaningfully different, generally better, track record than the same shape forming at the bottom of a sustained decline, where it's being asked to call a full trend reversal on its own.
Best time of day: Like other candlestick patterns in this hub, engulfing candles forming during the higher-volume first two hours of the session carry more weight than ones forming during the thinner midday stretch, where a single large order can produce an engulfing shape without reflecting genuine broad participation.
Stock type: Works on any liquid name. The size of the engulfing candle relative to the stock's typical range matters more than its size in absolute dollar terms; a modest-looking engulfing candle on a normally quiet stock can represent a bigger shift in sentiment than a large-looking one on a stock that always has wide daily swings.
Volume signature: An engulfing candle on volume that clearly exceeds the engulfed candle's volume is a stronger signal than one where the two candles show similar or declining volume. The engulfing candle needs to represent a genuine surge in participation to credibly claim it overwhelmed the prior candle's sentiment, not just a slightly larger price move on comparable volume.
The Setup Specification: Bullish Engulfing
- Component
- Market Conditions Required
- Rule
- Strongest as a pullback-resolution signal within an established uptrend; weaker as a standalone reversal call at the bottom of an extended decline
- Component
- Time of Day
- Rule
- Highest-conviction setups form 9:30-11:30 AM ET
- Component
- Stock Selection Criteria
- Rule
- Engulfing candle's body fully covers the prior candle's body; volume on the engulfing candle clearly exceeds the prior candle's volume
- Component
- Entry Trigger
- Rule
- Close of the engulfing candle itself, or the following candle's close above the engulfing candle's high for a more conservative version
- Component
- Stop Loss
- Rule
- Below the engulfing candle's low
- Component
- Initial Profit Target
- Rule
- Given documented weak average post-breakout performance in downtrend-reversal contexts, scale aggressively at a conservative first target; hold longer only when the pattern forms as a pullback resolution within a confirmed uptrend
- Component
- Trade Management
- Rule
- Move to breakeven quickly; trail below rising swing lows only once clear follow-through has developed
- Component
- Invalidation Criteria
- Rule
- Price closes back below the engulfing candle's low shortly after entry
| Component | Rule |
|---|---|
| Market Conditions Required | Strongest as a pullback-resolution signal within an established uptrend; weaker as a standalone reversal call at the bottom of an extended decline |
| Time of Day | Highest-conviction setups form 9:30-11:30 AM ET |
| Stock Selection Criteria | Engulfing candle's body fully covers the prior candle's body; volume on the engulfing candle clearly exceeds the prior candle's volume |
| Entry Trigger | Close of the engulfing candle itself, or the following candle's close above the engulfing candle's high for a more conservative version |
| Stop Loss | Below the engulfing candle's low |
| Initial Profit Target | Given documented weak average post-breakout performance in downtrend-reversal contexts, scale aggressively at a conservative first target; hold longer only when the pattern forms as a pullback resolution within a confirmed uptrend |
| Trade Management | Move to breakeven quickly; trail below rising swing lows only once clear follow-through has developed |
| Invalidation Criteria | Price closes back below the engulfing candle's low shortly after entry |
The Setup Specification: Bearish Engulfing
- Component
- Market Conditions Required
- Rule
- Works as both a pullback-resolution signal within a downtrend and, with somewhat more caution, as a standalone top-reversal signal, given its stronger documented reversal reliability
- Component
- Time of Day
- Rule
- Highest-conviction setups form 9:30-11:30 AM ET
- Component
- Stock Selection Criteria
- Rule
- Engulfing candle's body fully covers the prior candle's body; volume on the engulfing candle clearly exceeds the prior candle's volume
- Component
- Entry Trigger
- Rule
- Close of the engulfing candle itself, or the following candle's close below the engulfing candle's low for a more conservative version
- Component
- Stop Loss
- Rule
- Above the engulfing candle's high
- Component
- Initial Profit Target
- Rule
- Given documented short-lived follow-through even after a reliable reversal call, scale aggressively rather than holding for a large sustained decline
- Component
- Trade Management
- Rule
- Move to breakeven quickly; trail above falling swing highs only once clear follow-through has developed
- Component
- Invalidation Criteria
- Rule
- Price closes back above the engulfing candle's high shortly after entry
| Component | Rule |
|---|---|
| Market Conditions Required | Works as both a pullback-resolution signal within a downtrend and, with somewhat more caution, as a standalone top-reversal signal, given its stronger documented reversal reliability |
| Time of Day | Highest-conviction setups form 9:30-11:30 AM ET |
| Stock Selection Criteria | Engulfing candle's body fully covers the prior candle's body; volume on the engulfing candle clearly exceeds the prior candle's volume |
| Entry Trigger | Close of the engulfing candle itself, or the following candle's close below the engulfing candle's low for a more conservative version |
| Stop Loss | Above the engulfing candle's high |
| Initial Profit Target | Given documented short-lived follow-through even after a reliable reversal call, scale aggressively rather than holding for a large sustained decline |
| Trade Management | Move to breakeven quickly; trail above falling swing highs only once clear follow-through has developed |
| Invalidation Criteria | Price closes back above the engulfing candle's high shortly after entry |
Both tables share the same underlying caution around holding time, and that's deliberate. The research behind this pattern, covered in detail below, points to a specific and useful lesson: engulfing candles are better at calling direction than at sustaining a large move, which should shape how a trader manages the trade from the moment it's entered.

A Walk-Through: A Bullish Engulfing Candle Used the Way the Research Actually Supports
Consider a large-cap industrial stock, ticker XYZ, in a clear intraday uptrend since the open, having run from $61.20 to $64.80 by 10:15 AM ET. Starting at 10:16 AM, XYZ pulls back on light, orderly selling, a normal pullback within the broader trend rather than a reversal, declining to $63.40 by 10:31 AM.
At 10:32 AM, a down candle prints, closing at $63.15. At 10:37 AM, the next 5-minute candle opens near $63.10, dips slightly, then rallies to close at $63.85, a body that fully engulfs the prior candle's $63.15 to $63.45 range, on volume 1.8x the prior candle's pace. Because this engulfing candle is resolving a shallow pullback within an already-established uptrend, rather than trying to call a reversal at the bottom of a decline, it fits the higher-conviction context the research supports.
A trader entering at the $63.85 close sets a stop below the engulfing candle's $63.05 low, an $0.80 risk per share. Given the broader uptrend context, this trader holds for a more meaningful continuation rather than the aggressive, fast scale-out this guide recommends for a standalone reversal call, and XYZ resumes its climb, reaching $65.60 by 12:10 PM. The pullback-resolution context, not the engulfing shape alone, is what justified the more patient hold here.
Managing the Trade: Reading Context Before Deciding How Patient to Be
Distinguish a pullback-resolution engulfing candle from a standalone reversal-calling one before deciding how aggressively to scale out. This is the single most important management decision this pattern asks a trader to make, and it's a judgment call about the surrounding trend structure, not something the candle's shape alone can answer.
Treat the bearish engulfing's stronger reversal reliability as license for a more confident entry, not necessarily a more patient hold. The research covered below found the bearish version reverses direction reliably but that the resulting move is often short-lived. A trader can enter with more confidence in the direction while still managing the exit with the same urgency this guide recommends for the weaker bullish version.
Require genuinely superior volume on the engulfing candle, not just a marginally larger one. A candle that engulfs the prior one's body by a small margin, on volume that's only slightly higher, is a weaker version of this setup than one with decisive volume expansion behind it.
Where the Engulfing Candle Pattern Fails
This is a pattern where the underlying research reveals a genuinely important asymmetry that most trading education glosses over. Independent statistical research into the bullish engulfing candle, based on Thomas Bulkowski's large-sample study of confirmed candlestick patterns, found it acts as a bullish reversal a modest majority of the time, but ranked its overall post-breakout performance in the weaker tier of all candlestick patterns studied, with the researcher's own analysis describing the follow-through as notably poor. That same research specifically recommended trading bullish engulfing candles during upward primary trends with downward retracements, in other words, as a pullback-resolution signal, rather than during downward trends where the initial reversal tends to prove temporary before the original decline reasserts itself. This is exactly why the Setup Specification above treats trend context as the central variable for this version of the pattern.
The bearish engulfing candle told a more favorable but still nuanced story in that same body of research. It confirmed its expected bearish reversal considerably more often than the bullish version confirmed its own, a real and meaningful edge in calling direction correctly. But that same research found the resulting downward trend was frequently short-lived, and that performance following upward breakouts (a bearish engulfing pattern that fails and reverses back up) ranked among the weakest of any candlestick pattern studied. Both findings come from daily-chart research, not the compressed intraday version this guide covers, but the core lesson translates directly: the bearish engulfing candle is a better direction-caller than the bullish version, and both versions reward fast, disciplined profit-taking over patient holding.
A second failure mode, layered on top of the trend-context issue, is treating every two-candle engulfing shape as equally strong regardless of the size difference between the two candles. A candle that just barely engulfs the prior one's body is a materially weaker signal than one that engulfs it by a wide margin, even though both technically qualify as the pattern.
A third failure mode is ignoring volume entirely and trading the shape on price alone. Given how central genuine participation is to this pattern's underlying logic, a large-looking engulfing candle on unremarkable volume is a weaker, more suspect version of the setup than the price action alone might suggest.
Variations Worth Knowing
The engulfing candle at a key level, forming at a prior swing point, VWAP, or round number, carries more weight than the same shape forming in an unremarkable part of the range, echoing the same level-dependent logic covered in this hub's pin bar reversal guide.
The three-candle engulfing sequence, where a small-bodied candle sits between the engulfed candle and the engulfing candle, is sometimes read as a stronger version showing a more gradual sentiment shift rather than an abrupt one. It's a less common variant intraday but worth recognizing when it appears.
The failed engulfing pattern, where price closes back beyond the engulfing candle's extreme shortly after the signal, often produces a fast move in the original trend's direction as traders who acted on the reversal are forced to exit, connecting to this hub's failed breakout, bull trap, and bear trap guide.
Tools for Reading Engulfing Candles in Context
Because this pattern's real edge depends so heavily on the surrounding trend structure rather than the candle shape alone, a charting platform that makes trend and pullback context easy to see at a glance matters more here than a scanner tuned purely to candle shape. A platform that can also flag genuine volume surges, like the scanning capability built into Trade Ideas, helps separate a real, volume-backed engulfing candle from a superficially similar but weaker one. For a broader comparison of charting and scanning tools, see the tools and reviews section.
How This Setup Fits a Complete Trading Plan
Given the research showing bullish engulfing candles perform best as pullback-resolution signals, this pattern fits naturally alongside this hub's broader trend continuation and pullback trading coverage, rather than standing alone as a bottom-calling reversal tool. The bearish version has somewhat more standing on its own as a reversal signal, but still benefits from the same fast, disciplined exit discipline this guide recommends throughout.
Given the documented short-lived follow-through on both versions, position sizing should generally favor smaller, quicker trades over large, patient ones, within the standard risk-per-trade framework, reserving larger, more patient size for setups with stronger documented sustained performance, like the cup and handle covered elsewhere in this hub.
Frequently Asked Questions
Why does this guide recommend treating bullish and bearish engulfing candles differently?
Most trading education treats them as symmetric opposites, but the documented statistics don't support that symmetry.
Key Takeaway: Apply more caution and require stronger trend context for bullish engulfing setups than for bearish ones, given the documented reliability gap between them.
Is a bullish engulfing candle at the bottom of a downtrend still worth trading?
Research on this pattern specifically found weaker follow-through when it's used to call a reversal at the bottom of a decline, compared to using it as confirmation that an uptrend's pullback has ended.
Key Takeaway: Size and hold a bottom-calling bullish engulfing trade more conservatively than a pullback-resolution version of the same pattern.
How much bigger does the engulfing candle need to be than the candle it's engulfing?
A candle that just barely engulfs the prior body is a weaker signal than one that overwhelms it decisively.
Key Takeaway: Weight engulfing candles by how decisively they cover the prior body, not just whether they technically qualify.
Does the engulfing pattern need confirmation from a third candle, or is the engulfing candle itself the trigger?
The more conservative version reduces false signals at the cost of a slightly worse average entry price.
Key Takeaway: Choose between the aggressive (engulfing-candle-close) and conservative (next-candle-confirmation) entry based on how much false-signal risk a trader is willing to accept for a better price.
Why does the underlying research describe the bearish engulfing pattern's follow-through as short-lived even though its reversal call is reliable?
The pattern gets the initial direction right more often than most candlestick patterns, but the resulting decline frequently loses momentum quickly rather than continuing into a large, sustained trend.
Key Takeaway: Trust a confirmed bearish engulfing candle for direction, but manage the exit with urgency rather than expecting a large, sustained decline.
How does an engulfing pattern differ from a pin bar?
This hub covers the pin bar reversal strategy separately, since the single-candle and two-candle versions carry different statistical profiles and different confirmation logic.
Key Takeaway: Distinguish engulfing patterns from pin bars by candle count and structure, since their documented reliability and appropriate trade management differ.
Should a trader avoid trading bullish engulfing candles entirely given the weaker documented performance?
Used in that specific context, the research supports a real, usable edge; used indiscriminately as a bottom-calling signal, the same shape performs considerably worse.
Key Takeaway: Reserve bullish engulfing trades primarily for pullback-resolution contexts within a confirmed uptrend, and apply extra caution to standalone reversal calls.
What role does the broader market play in trading this pattern?
A bullish engulfing candle in a single stock while the broader market is also rallying has more supporting context than the same shape appearing while the index is falling sharply.
Key Takeaway: Weight this pattern's conviction by whether the broader market trend supports or fights the direction it's signaling, the same principle applied throughout this hub's reversal and candlestick coverage.
What's the biggest risk of trading this pattern without checking volume?
Since this pattern's underlying logic depends on a real shift in buying or selling pressure, a large-looking engulfing candle on unremarkable volume is a weaker, more suspect version of the setup than the price shape alone suggests.
Key Takeaway: Always check that volume on the engulfing candle clearly exceeds the engulfed candle's volume before trusting the signal at full size.
Disclaimer
Article Sources
- StockCharts ChartSchool: Candlestick Pattern Dictionary - reference definitions for two-candle reversal patterns
- StockCharts ChartSchool: Candlestick Bearish Reversal Patterns - reference coverage of bearish candlestick formations
- FINRA: Understanding the New Intraday Margin Requirements - current regulatory framework for day-trading accounts
- FINRA Rule 2270: Day-Trading Risk Disclosure Statement - regulatory baseline for day-trading risk disclosure
- CME Group: Futures — Looking Beyond Technical Analysis - exchange-level perspective on the limits of pattern-based analysis
Was this helpful?
Be the first to weigh in

Written by
Kazi Mezanur RahmanFounder, independent researcher, and editor of DayTradingToolkit. A one-person publication focused on risk-first trading education and documented tool research. He trades his own capital as a retail trader and combines personal market experience with systematic primary-source research.
Keep Reading
Strategies
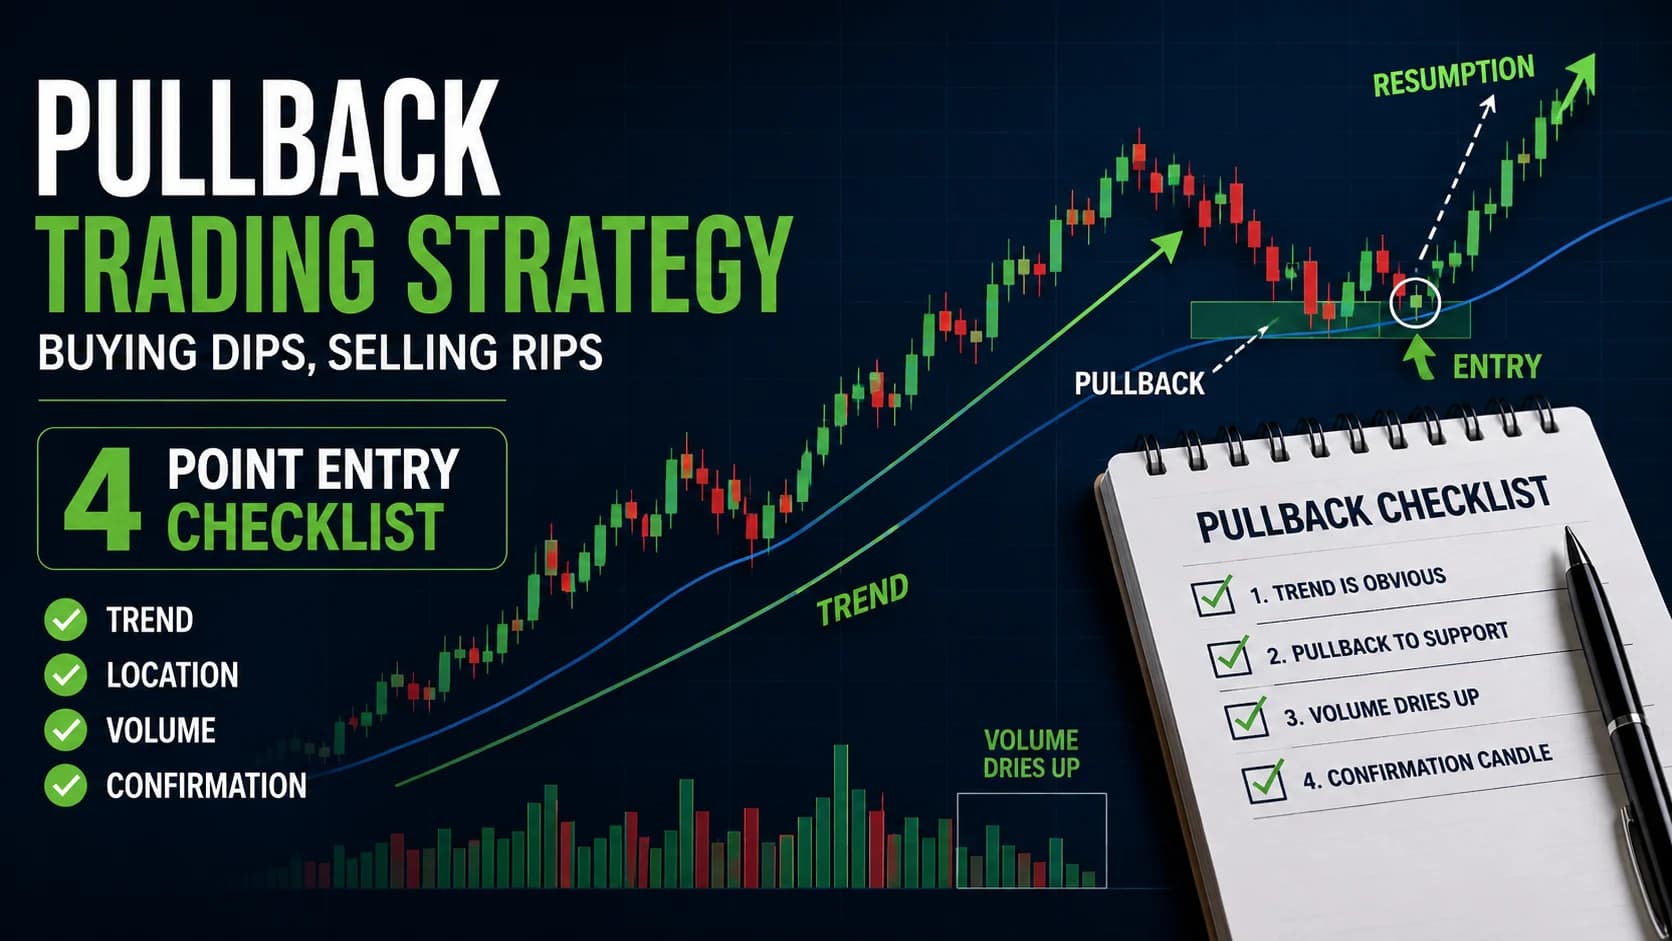
The Pullback Trading Strategy: A Pro Guide to Buying Dips & Selling Rips
A 4-point mechanical checklist for the pullback trading strategy: trend, location, volume, and confirmation — with exact entry, stop, and target rules for buying dips and selling rips.
Strategies
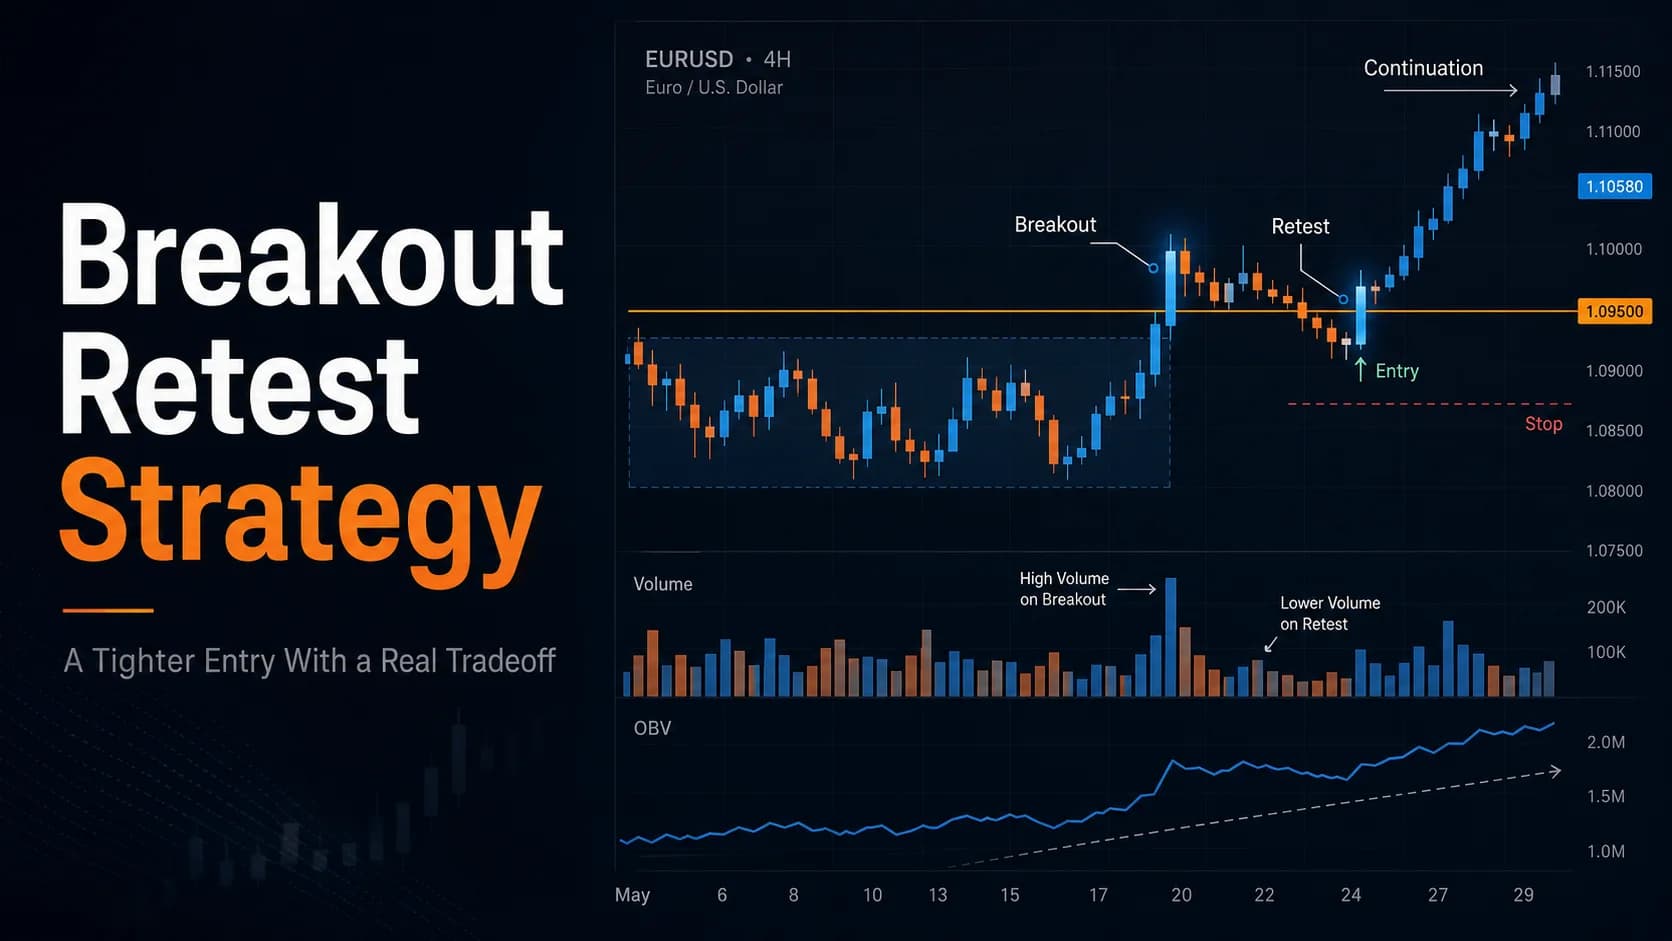
The Retest Strategy: How to Trade the Pullback After a Breakout
Retests offer a better entry price, but the data shows breakouts that never look back tend to perform better. This guide covers trading the retest honestly.
Strategies
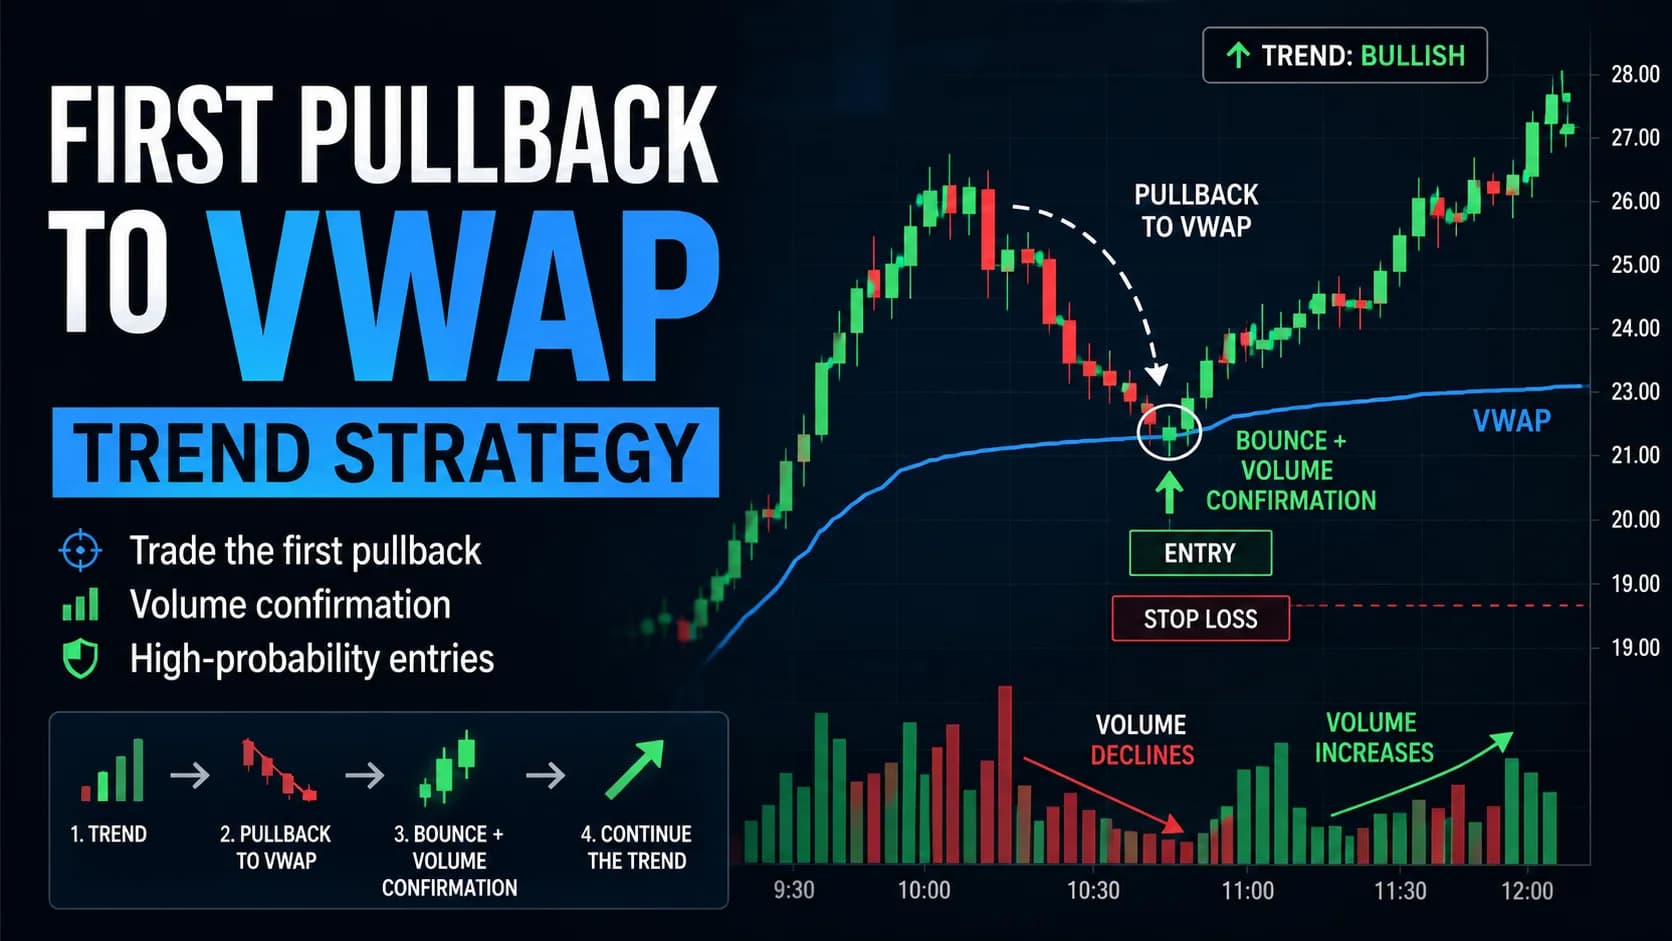
Trading the First Pullback to VWAP in a Trending Stock
A mechanical checklist for trading the first pullback to VWAP in a trending, catalyst-driven stock — volume confirmation, exact entry and stop rules, and an honest look at when this popular setup fails.
Strategies
Buying the Dips & Selling the Rips: Mastering Pullback Trading in Trends
Master pullback trading with our framework for identifying high-probability dips in uptrends and rips in downtrends. Entry methods, volume diagnostics, and failure modes.
Comments
No comments yet. Be the first to share your thoughts.