
The Pin Bar Reversal Strategy for Intraday Traders

In this article10 sections
A stock spikes down to $22.10, gets rejected almost immediately, and closes the 5-minute candle back up at $22.68, leaving a long lower wick and a tiny body near the top of the range. It's a striking shape on the chart, the kind of candle that gets circled in every beginner's trading course as an obvious buy signal. The candle-by-candle research on this exact shape tells a more measured story: real, but smaller and less dramatic than the picture suggests.
That gap between how a pin bar looks and how it actually performs is the entire subject of this guide.
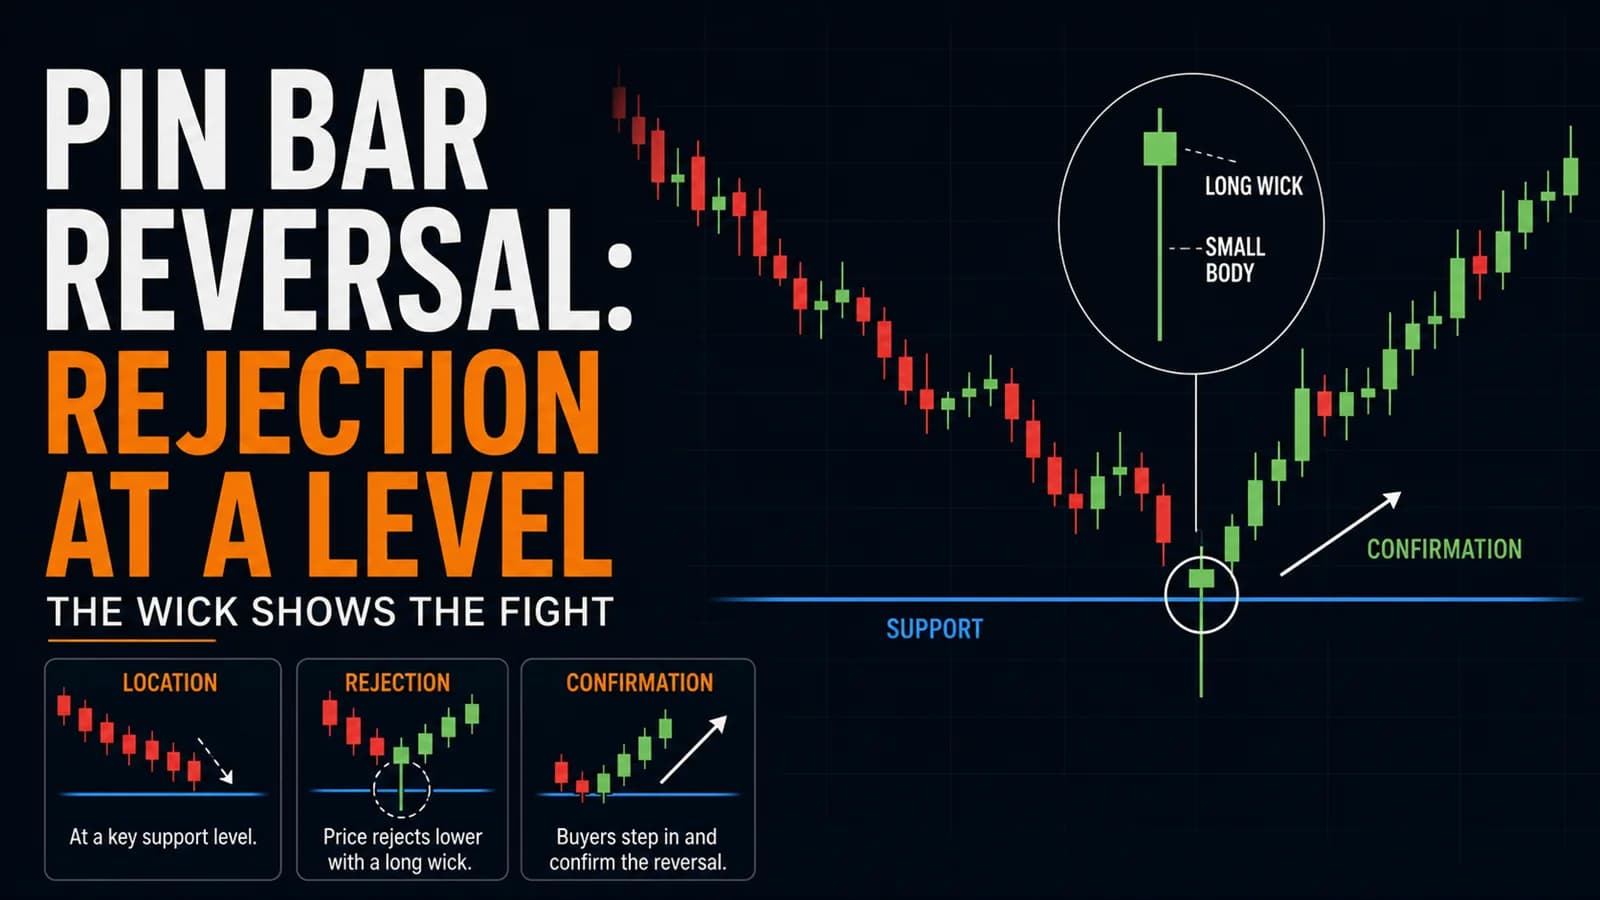
What is a pin bar? A pin bar is a single candle with a small body and a long wick (or "tail") extending from one side, showing that price pushed sharply in one direction before being rejected and closing back near the opposite end of the range. A bullish pin bar (also called a hammer) has a long lower wick and signals rejection of lower prices. A bearish pin bar (also called a shooting star) has a long upper wick and signals rejection of higher prices.
Pin Bar, Hammer, Shooting Star: One Shape, Three Names
Traders coming from different corners of the trading world use different vocabulary for the same candle shape, and the overlap causes real confusion. "Pin bar" is the term popularized by price-action and forex trading education. "Hammer" and "shooting star" are the older, more formal candlestick terms from Japanese charting technique, with hammer referring specifically to the bullish version at the bottom of a decline and shooting star to the bearish version at the top of a rally. This guide uses all three terms because a trader will encounter each of them, but they describe the same underlying shape and the same underlying statistics.
What separates a real pin bar from an ordinary candle with a slightly longer wick than usual is proportion. The wick should be at least twice the length of the body, and ideally more, with the body sitting at one end of the candle's total range rather than in the middle. A candle with a modest wick and a modest body isn't a pin bar; it's just a normal candle, and treating it as a reversal signal overstates what the shape is actually communicating.
For the broader skill of reading individual candles before layering pattern logic on top, the beginner's guide's candlestick reading primer is the right starting point if that foundation isn't already solid.
When a Pin Bar Actually Means Something
Best conditions: A pin bar forming at a meaningful level, a prior swing low or high, a VWAP test, a round number, carries more weight than the same shape forming in the middle of an empty range with no context. The wick's rejection is more credible when it's rejecting a level other traders are also watching.
Best time of day: Pin bars that form during the first two hours of the session, when volume and participation are highest, tend to reflect more genuine two-way conviction than ones forming during the lower-volume midday stretch, where a single large order can produce a long wick without representing real broad-based rejection.
Stock type: Works on any liquid name, but the wick's significance scales with the stock's typical range. A one-dollar wick on a $150 stock with a typical two-dollar daily range is unremarkable; the same one-dollar wick on a $12 stock with a typical fifty-cent range is a genuinely large rejection relative to how that stock normally trades.
Volume signature: A pin bar on volume that's clearly elevated relative to the surrounding candles suggests real participants were fighting over that price, which is exactly what produced the rejection. A pin bar on unremarkable, average volume is a weaker version of the signal, since there's less evidence that the wick reflects genuine two-sided conviction rather than a single thin print.
The Setup Specification
- Component
- Market Conditions Required
- Rule
- A pin bar forming at a meaningful level (prior swing high/low, VWAP, round number), not in an empty part of the range
- Component
- Time of Day
- Rule
- Highest-conviction setups form 9:30-11:30 AM ET; midday pin bars (12-2 PM ET) require extra confirmation given thinner volume
- Component
- Stock Selection Criteria
- Rule
- Wick length at least 2x the body, ideally more; wick represents a meaningful percentage of the stock's typical intraday range
- Component
- Entry Trigger
- Rule
- Candle following the pin bar closes beyond the pin bar's body in the direction of the rejection (above the body for a bullish pin bar, below for bearish), on volume at or above the prior five-bar average
- Component
- Stop Loss
- Rule
- Beyond the pin bar's wick extreme (below the low for a bullish pin bar, above the high for a bearish one)
- Component
- Initial Profit Target
- Rule
- Conservative: the height of the pin bar itself projected from the entry, given documented modest average moves; scale half or more at that level
- Component
- Trade Management
- Rule
- Move to breakeven once the confirmation candle's high (bullish) or low (bearish) is cleared by a small margin
- Component
- Invalidation Criteria
- Rule
- Price closes back beyond the wick extreme before the confirmation candle triggers; the following candle shows no real follow-through in the rejection's direction
| Component | Rule |
|---|---|
| Market Conditions Required | A pin bar forming at a meaningful level (prior swing high/low, VWAP, round number), not in an empty part of the range |
| Time of Day | Highest-conviction setups form 9:30-11:30 AM ET; midday pin bars (12-2 PM ET) require extra confirmation given thinner volume |
| Stock Selection Criteria | Wick length at least 2x the body, ideally more; wick represents a meaningful percentage of the stock's typical intraday range |
| Entry Trigger | Candle following the pin bar closes beyond the pin bar's body in the direction of the rejection (above the body for a bullish pin bar, below for bearish), on volume at or above the prior five-bar average |
| Stop Loss | Beyond the pin bar's wick extreme (below the low for a bullish pin bar, above the high for a bearish one) |
| Initial Profit Target | Conservative: the height of the pin bar itself projected from the entry, given documented modest average moves; scale half or more at that level |
| Trade Management | Move to breakeven once the confirmation candle's high (bullish) or low (bearish) is cleared by a small margin |
| Invalidation Criteria | Price closes back beyond the wick extreme before the confirmation candle triggers; the following candle shows no real follow-through in the rejection's direction |
The confirmation candle requirement in the Entry Trigger row matters more than it might first appear. Buying or selling the instant a pin bar's wick prints, without waiting for the next candle to actually confirm the rejection held, means trading a shape that hasn't been tested yet. The wick shows what happened; the confirmation candle shows whether it mattered.

A Walk-Through: A Pin Bar That Confirms and Delivers a Realistic, Modest Move
Consider a mid-cap retail stock, ticker XYZ, drifting lower through the morning after a soft same-store-sales print from a competitor. By 10:40 AM ET, XYZ has fallen to a session low near $28.90, roughly matching a swing low from two sessions prior that several traders are likely watching.
At 10:42 AM, a 5-minute candle spikes down to $28.62, thirty-two cents below that prior swing low, before buyers step in hard and push the close back up to $29.15, near the top of the candle's range. The body is small, roughly thirteen cents, against a wick of over fifty cents, well beyond the 2x minimum. Volume on this candle runs 2.1x the prior five-bar average, evidence of real two-sided activity rather than a thin, low-conviction print.
The next 5-minute candle closes at $29.34, above the pin bar's $29.15 body high, confirming the rejection. A trader entering at $29.34 sets a stop below the pin bar's $28.62 wick low, a $0.72 risk per share, and sets a conservative first target using the pin bar's own $0.53 height ($29.15 minus $28.62) projected from entry, pointing toward roughly $29.87.
XYZ reaches $29.80 by 11:35 AM, close to the conservative target, where a trader following the plan scales out the bulk of the position. Consistent with the honest research on this pattern covered below, the move stays modest. XYZ stalls in the $29.70 to $29.90 zone for the next hour rather than continuing into a larger, more dramatic reversal. A trader who held the full position expecting a much bigger move, treating the pin bar with the same conviction as a confirmed head and shoulders bottom, would have given back a meaningful share of the gain waiting for a continuation that the pattern's own documented behavior shows is the less likely outcome.
Managing the Trade: Sizing Expectations to What This Signal Actually Delivers
Take the conservative target seriously rather than treating it as a floor to hold past. The research on this exact pattern, detailed in the next section, shows a real, if unremarkable, edge, and the biggest risk to a trader using this setup well is expecting hammer-level or shooting-star-level moves to behave like a stronger, multi-candle reversal pattern.
Require the confirmation candle, every time, even when the wick looks dramatic. A spectacular-looking wick with no real follow-through the next candle is a weaker trade than a modest-looking wick that gets immediate, decisive confirmation. The shape alone, however visually striking, hasn't been tested by the market yet until the next candle prints.
Move to breakeven quickly once confirmation is in hand. Given this pattern's documented tendency to produce smaller moves than its dramatic appearance suggests, protecting the trade early rather than giving it wide room to "prove itself" is the more consistent approach.
Where the Pin Bar Pattern Fails
This is a pattern where the underlying research draws a real distinction between how reliably the shape signals direction and how much that direction actually moves, and both halves matter. Independent statistical research into the hammer, the bullish version of this shape, based on Thomas Bulkowski's large-sample study of confirmed candlestick patterns, found it acts as a genuine bullish reversal signal a modest but real majority of the time, and that a conservative height-based price target, similar to the one used in this guide's Setup Specification, gets reached at a notably high rate. Despite that, the same research ranked the hammer's overall performance in the middle-to-lower tier of all candlestick patterns studied, because the actual size of the moves it produces tends to be small. The shooting star, the bearish version, performed even closer to a coin flip in that same research, with the researcher's own assessment describing it as a pattern that "looks better than it performs."
Both findings come from daily-chart research, not the compressed intraday version this guide covers, but the core lesson translates directly: a pin bar is a real, usable signal for direction, and a genuinely weak signal for magnitude. Sizing a trade's target expectations around a large reversal, the kind a confirmed head and shoulders or double bottom might deliver, misapplies this pattern's actual documented character.
A second failure mode is trading pin bars that form with no meaningful level behind them. A long wick in the middle of an empty range, with no prior swing point, VWAP test, or round number nearby, is a materially weaker version of this setup, since there's no broader structural reason for the rejection beyond the candle's own shape.
A third failure mode is skipping the confirmation candle in fast-moving, high-momentum stocks where the temptation to enter immediately on the wick itself is strongest. Ironically, this is exactly the stock type where confirmation matters most, since a single large, aggressive order can produce a dramatic-looking wick on a low-float name without representing genuine broad rejection.
Variations Worth Knowing
The inside pin bar, where the pin bar's entire range sits inside the prior candle's range, combines this pattern with the inside bar setup covered elsewhere in this hub, and tends to reflect a tighter, more coiled rejection than a pin bar with a wider range relative to its neighbors.
The multiple pin bar cluster, where two or three pin bars form in close succession at a similar level, is generally read as a stronger signal than a single isolated pin bar, since it reflects repeated, sustained rejection of the same price rather than a one-time event.
The failed pin bar, where the confirmation candle never comes and price instead closes beyond the wick extreme, often produces a fast continuation in the direction the wick rejected, as traders who bought or sold the shape itself are forced to reverse. This connects to this hub's failed breakout, bull trap, and bear trap guide for the mechanics of trading that reversal-of-a-reversal.
Tools for Spotting Pin Bars at the Levels That Matter
Because a pin bar's significance depends heavily on the level it forms at, a scanner or charting platform that highlights key intraday levels, prior swing points, VWAP, round numbers, alongside real-time price action makes this pattern considerably easier to trade well than scanning candle shapes in isolation. Trade Ideas can be configured to alert on stocks testing significant intraday levels with unusual volume, which is close to the exact combination this guide's Setup Specification calls for. For a broader look at charting tools suited to level-based, price-action trading like this, see the tools and reviews section.
How This Setup Fits a Complete Trading Plan
The pin bar works best as a confirmation tool layered onto a level a trader has already identified through other means, rather than as a primary scanning criterion on its own. It pairs naturally with this hub's coverage of prior-day high and low breakouts and VWAP-based setups, since both give a trader the meaningful levels this pattern's reliability depends on.
Given the modest average moves documented above, position sizing on a pin bar trade should generally sit toward the smaller end of a trader's normal range within the standard risk-per-trade framework, reserving larger size for setups with stronger documented magnitude, like the cup and handle or inverse head and shoulders covered elsewhere in this hub's Chart Pattern Playbook.
Frequently Asked Questions
How long does the wick need to be relative to the body to count as a real pin bar?
A candle with a modest wick and a modest body isn't a pin bar; treating it as one overstates the strength of the rejection actually shown.
Key Takeaway: Apply the 2x wick-to-body minimum strictly, and don't round a borderline candle up to pin bar status just because it has some kind of tail.
Why does this guide insist on a confirmation candle instead of entering on the pin bar itself?
A spectacular-looking wick that gets no follow-through the next candle is a weaker signal than it appears, and entering before that confirmation means trading an unproven shape.
Key Takeaway: Always wait for the confirmation candle, even when the pin bar's wick looks dramatic enough to act on immediately.
Is a pin bar more reliable at predicting direction or predicting the size of the move?
Independent research on the hammer found a real, if modest, edge for calling the reversal correctly and a strong rate of hitting a conservative height-based target, but ranked the pattern's overall performance in the lower tier of candlestick patterns because the actual moves it produces tend to be small.
Key Takeaway: Trust a confirmed pin bar for direction, but size the target conservatively rather than expecting a large move.
Does a pin bar need to form at a specific level to be worth trading?
A pin bar rejecting a prior swing point, VWAP, or round number carries more weight than the same shape forming in an empty part of the range with no other traders likely watching that specific price.
Key Takeaway: Prioritize pin bars forming at genuine, watched levels over ones forming in the middle of an otherwise unremarkable range.
How is a pin bar different from an engulfing candle pattern?
This hub covers the engulfing candle pattern separately, since the two-candle structure carries different statistical behavior and a different confirmation logic than a single pin bar.
Key Takeaway: Distinguish pin bars from engulfing patterns by candle count, one candle showing internal rejection versus two candles showing a directional overtake, since their documented reliability differs.
Why did the shooting star perform close to a coin flip in the underlying research despite being a well-known bearish signal?
That's exactly the gap this guide is built around: a shape can look convincing and still underperform its reputation once tested against a large sample of real outcomes.
Key Takeaway: Treat the shooting star with extra caution relative to the hammer, and lean more heavily on level context and volume confirmation before trading it.
Can a pin bar be traded without waiting for a broader trend context first?
A bullish pin bar forming after a sustained decline that shows other signs of exhaustion is a stronger setup than the same shape appearing randomly during an otherwise unremarkable uptrend.
Key Takeaway: Weight a pin bar's conviction by whether the broader trend context supports a genuine reversal, not just by the candle's shape in isolation.
What's the most common beginner mistake trading this pattern?
Because the shape is visually dramatic, it's easy to overestimate its documented reliability and magnitude relative to patterns like the head and shoulders or double bottom, which carry meaningfully different, generally stronger, researched statistics.
Key Takeaway: Calibrate size and target expectations to this pattern's actual documented modesty, not to how dramatic the wick looks on the chart.
Does volume on the pin bar candle itself matter, or only on the confirmation candle?
Volume on the pin bar itself is evidence the rejection reflects genuine two-sided conviction rather than a thin, low-participation print. Volume on the confirmation candle is evidence the rejection is actually translating into follow-through, which is the more direct signal for the entry decision itself.
Key Takeaway: Check volume on both the pin bar and its confirmation candle, using the first to judge the rejection's credibility and the second to judge whether it's translating into a real move.
Is the pin bar pattern more useful on higher timeframes like the 15-minute or hourly chart intraday?
A 1-minute pin bar can form from a single large, brief order; a 15-minute pin bar reflects a longer stretch of real two-sided trading, which tends to make the rejection more credible.
Key Takeaway: Favor pin bars on 5-minute or longer charts for higher-conviction setups, and treat 1-minute versions as lower-confidence unless paired with strong level and volume context.
Disclaimer
Article Sources
- StockCharts ChartSchool: Candlestick Pattern Dictionary - reference definitions for single-candle reversal patterns
- StockCharts ChartSchool: Introduction to Candlesticks - foundational reading on candle anatomy and interpretation
- FINRA: Understanding the New Intraday Margin Requirements - current regulatory framework for day-trading accounts
- FINRA Rule 2270: Day-Trading Risk Disclosure Statement - regulatory baseline for day-trading risk disclosure
- Investor.gov: Margin Rules for Day Trading - investor-facing overview of day-trading account requirements
Was this helpful?
Be the first to weigh in

Written by
Kazi Mezanur RahmanFounder, independent researcher, and editor of DayTradingToolkit. A one-person publication focused on risk-first trading education and documented tool research. He trades his own capital as a retail trader and combines personal market experience with systematic primary-source research.
Keep Reading

Strategies
Trading the Breakout of Prior-Day High/Low Levels
PDH and PDL need no formula, just yesterday's range. This guide covers the breakout, the liquidity-sweep fade, and why stops cluster right at these levels.
Strategies
Trading the First Pullback to VWAP in a Trending Stock
A mechanical checklist for trading the first pullback to VWAP in a trending, catalyst-driven stock — volume confirmation, exact entry and stop rules, and an honest look at when this popular setup fails.

Beginner’s Guide
Reading the Story of Price: An Introduction to Candlestick Charts
Learn how to read candlestick charts step by step. Understand candle anatomy, body size, wick meaning, and the 5 single-candle types every beginner must know.
Strategies
The Gap and Go Strategy: Trading the Open of Strong Gappers
Research shows most gaps reverse during the day, not continue. This guide covers how to spot the ones that genuinely keep going, and how to trade them.
Comments
No comments yet. Be the first to share your thoughts.