

Author Profile
Kazi Mezanur Rahman
Founder, independent researcher, and editor of DayTradingToolkit. A one-person publication focused on risk-first trading education and documented tool research. He trades his own capital as a retail trader and combines personal market experience with systematic primary-source research.
Areas of expertise
465
Published articles
Risk-first
Editorial focus
Independent
Review standard
About the Author
Kazi Mezanur Rahman is the founder, independent researcher, and editor behind DayTradingToolkit, a one-person publication. He built the site to organize practical trading education, primary-source research, calculators, and documented tool reviews in one place.
Kazi trades his own capital as a retail trader. He does not present himself as a professional trader, full-time trader, financial adviser, broker, accountant, or attorney. His experience comes from personal market participation combined with systematic research. The editorial approach is intentionally conservative: explain risks plainly, disclose affiliate relationships, avoid profit promises, clearly distinguish research from first-hand experience, and correct material errors when they are found.
Kazi oversees the site’s education library, research methodology, review structure, and content updates across beginner lessons, strategy explainers, psychology guides, calculators, and software comparisons.
Author Archive
Articles by Kazi Mezanur Rahman
Page 5 of 39. Showing 12 of 465 published guides, reviews, and trading resources.

TrendSpider vs. TradingView: Automation or Manual Charting?
TrendSpider automates the technical analysis TradingView expects you to do by hand. Here's what that actually buys you, what it costs, and which platform fits which trader.
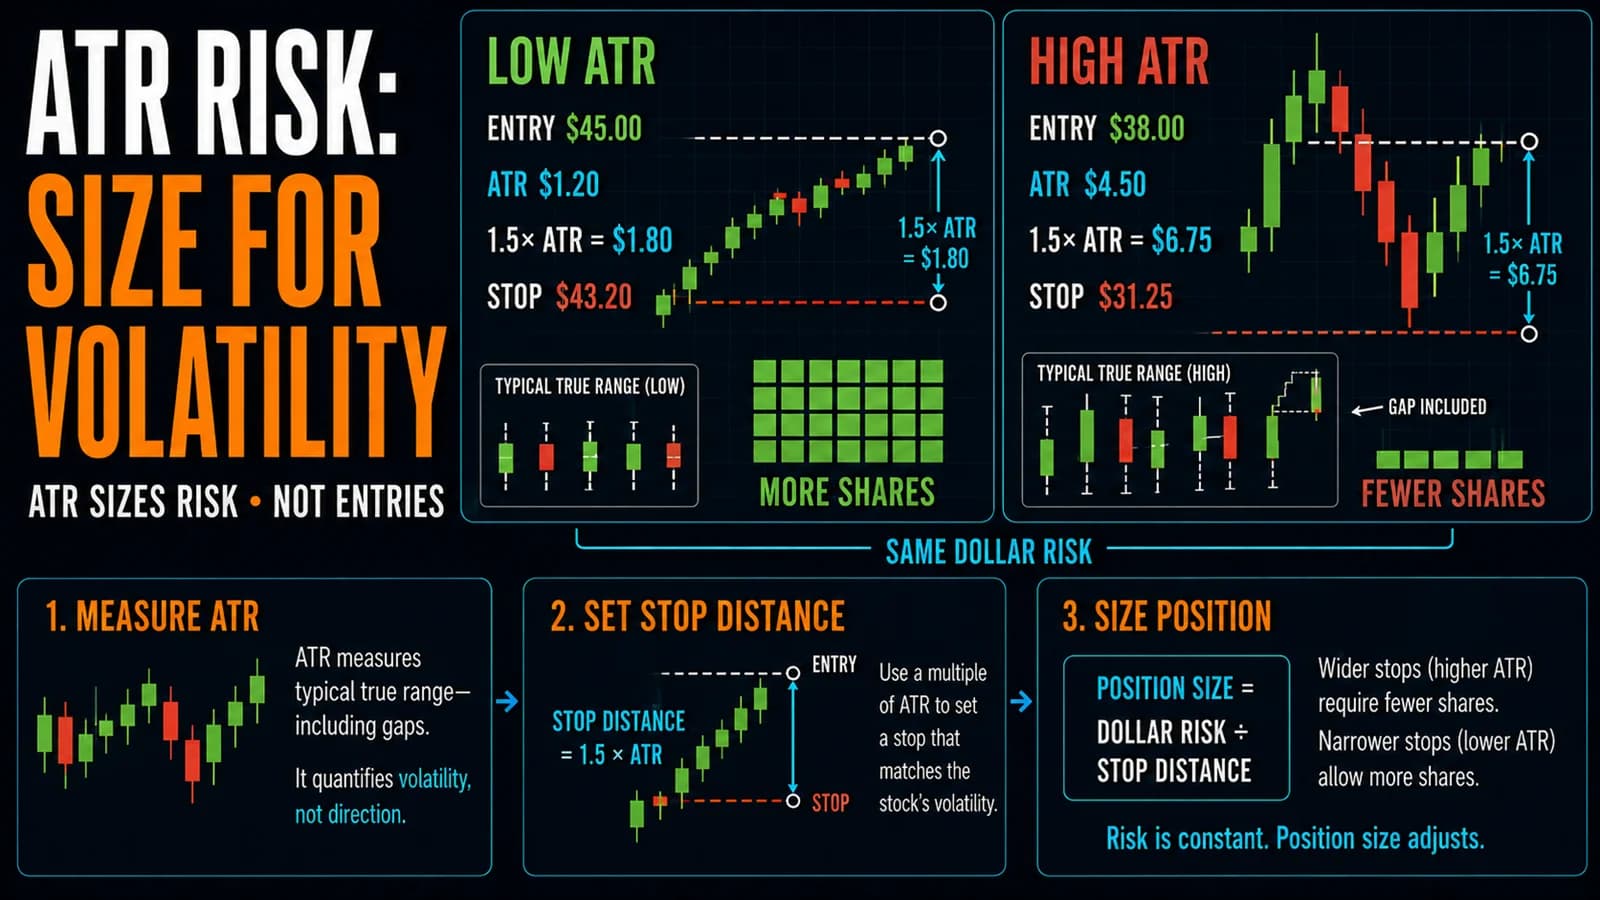
Trading With ATR: A Volatility-Adjusted Day Trading Strategy
Use ATR correctly to size stops, targets, and positions for each stock's real volatility, avoiding the common mistake of fixed dollar stops.
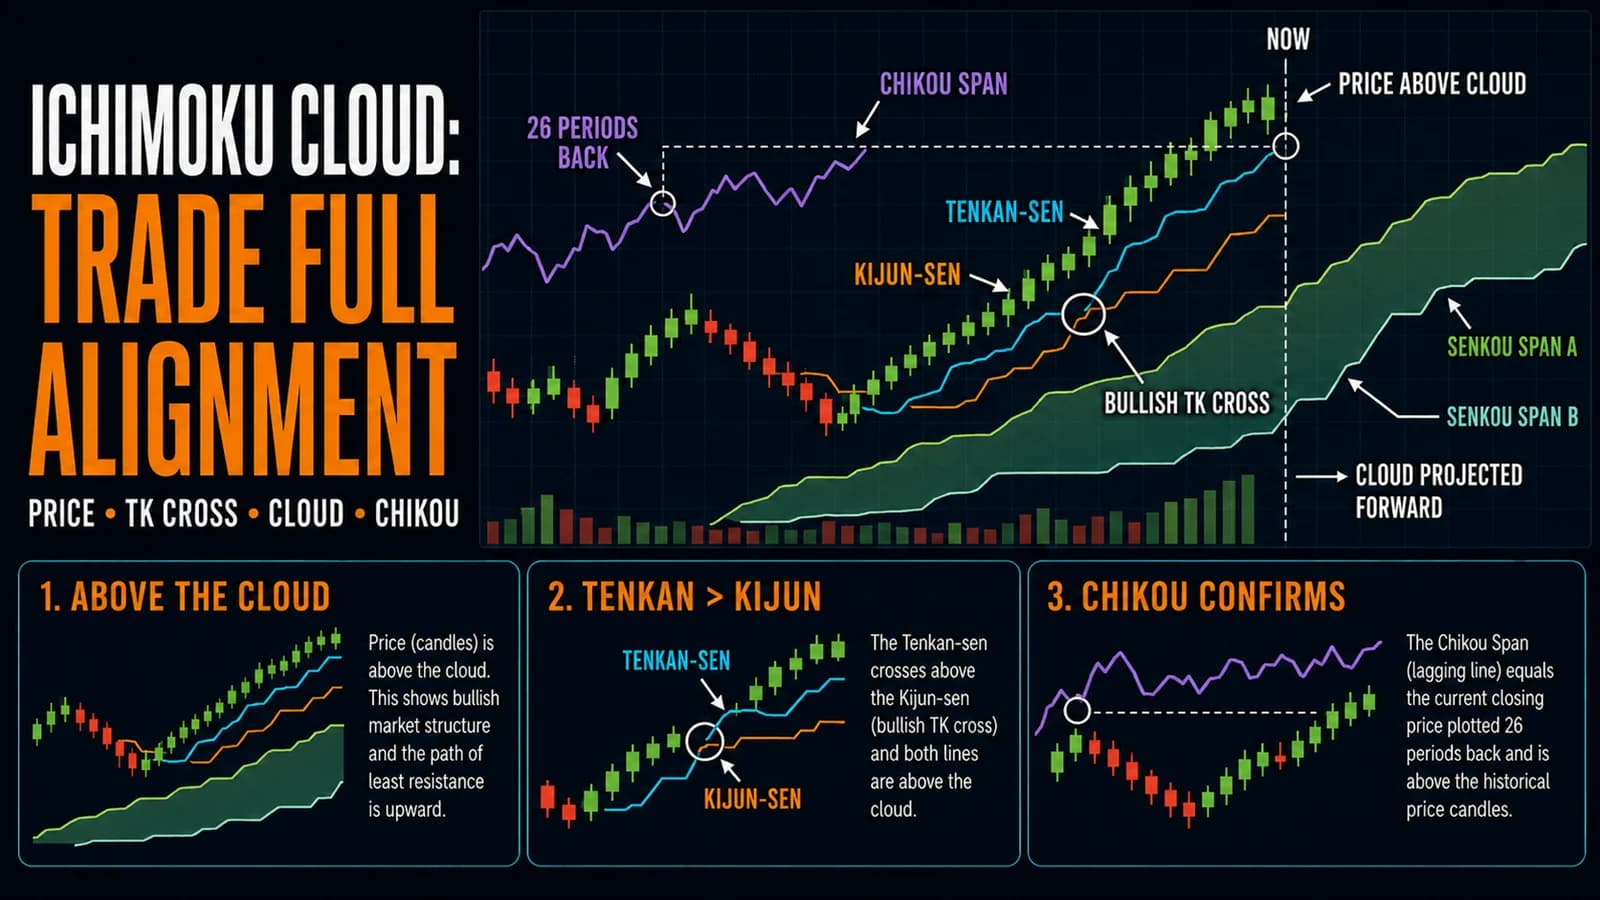
The Ichimoku Cloud Day Trading Strategy
Understand and trade Ichimoku Cloud: the five components explained, why full system alignment matters, and common mistakes to avoid.
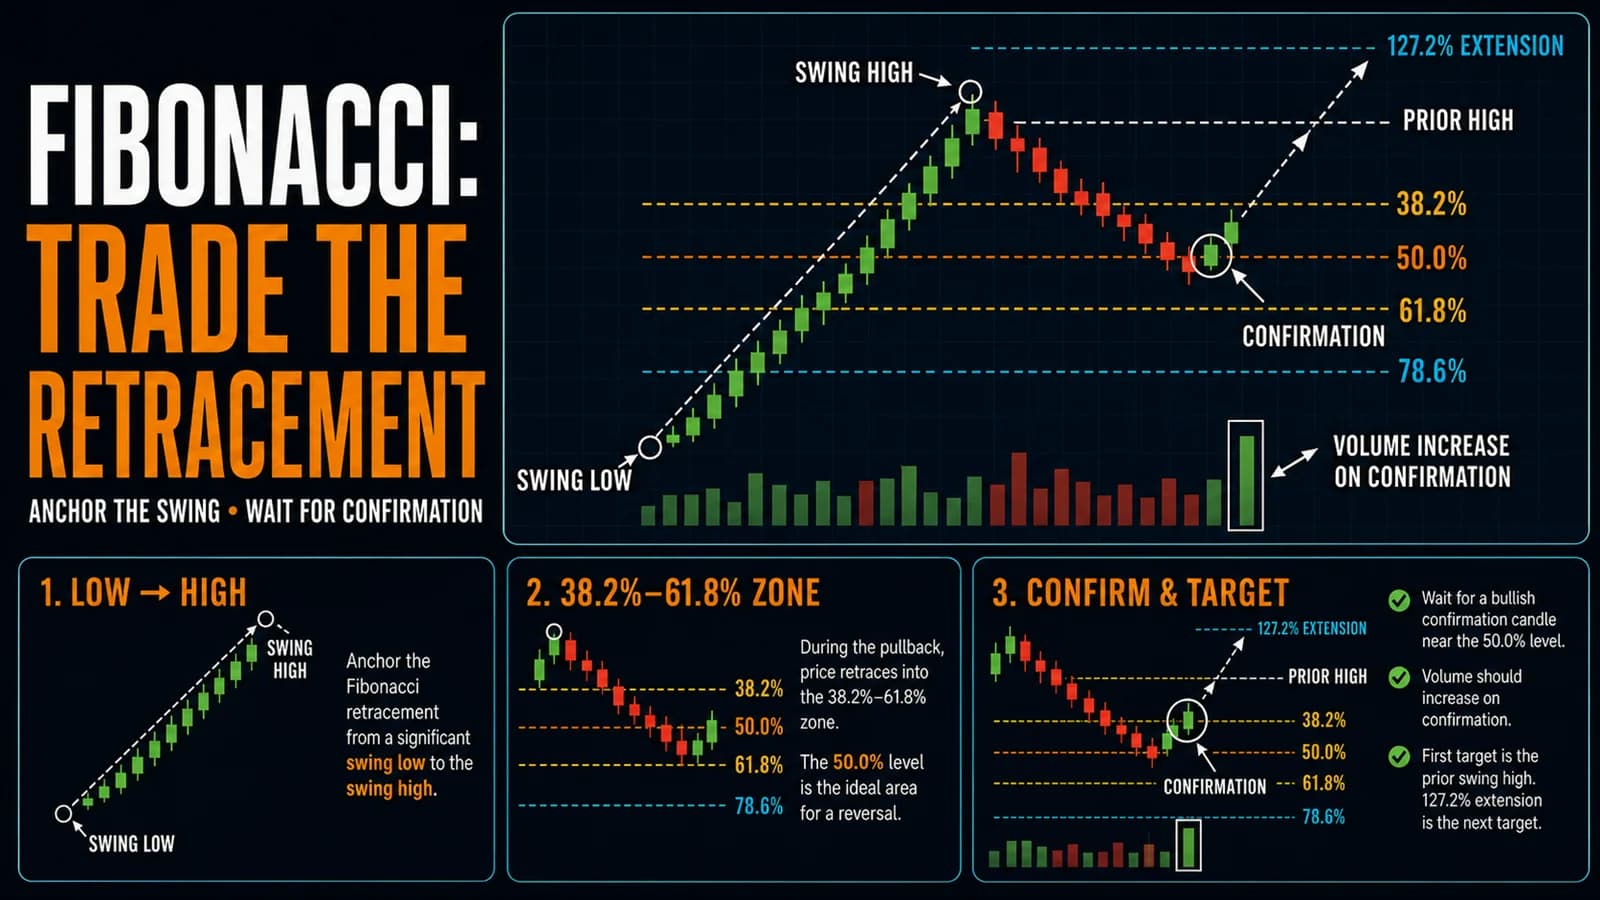
The Fibonacci Retracement Day Trading Strategy
Trade Fibonacci retracements with real confirmation: how to draw them correctly, why 61.8% matters most, and how to avoid trading isolated touches.
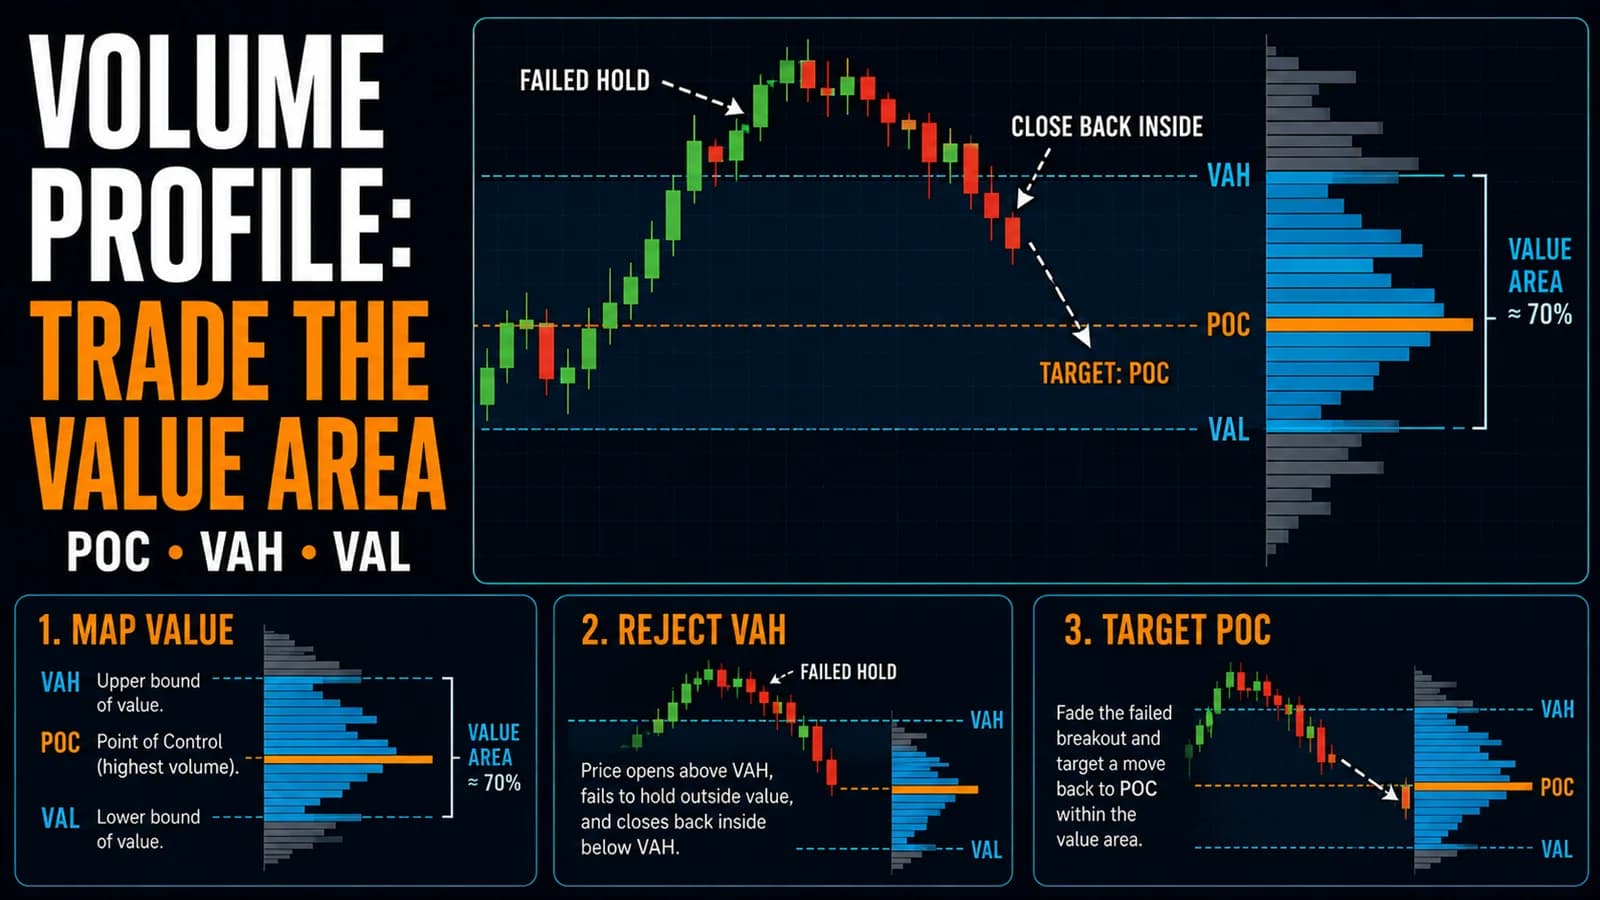
The Volume Profile Day Trading Strategy: POC, VAH, and VAL
Trade Volume Profile with confidence: how to read POC, VAH, and VAL, when to fade the value area, and how to spot a genuine breakout.
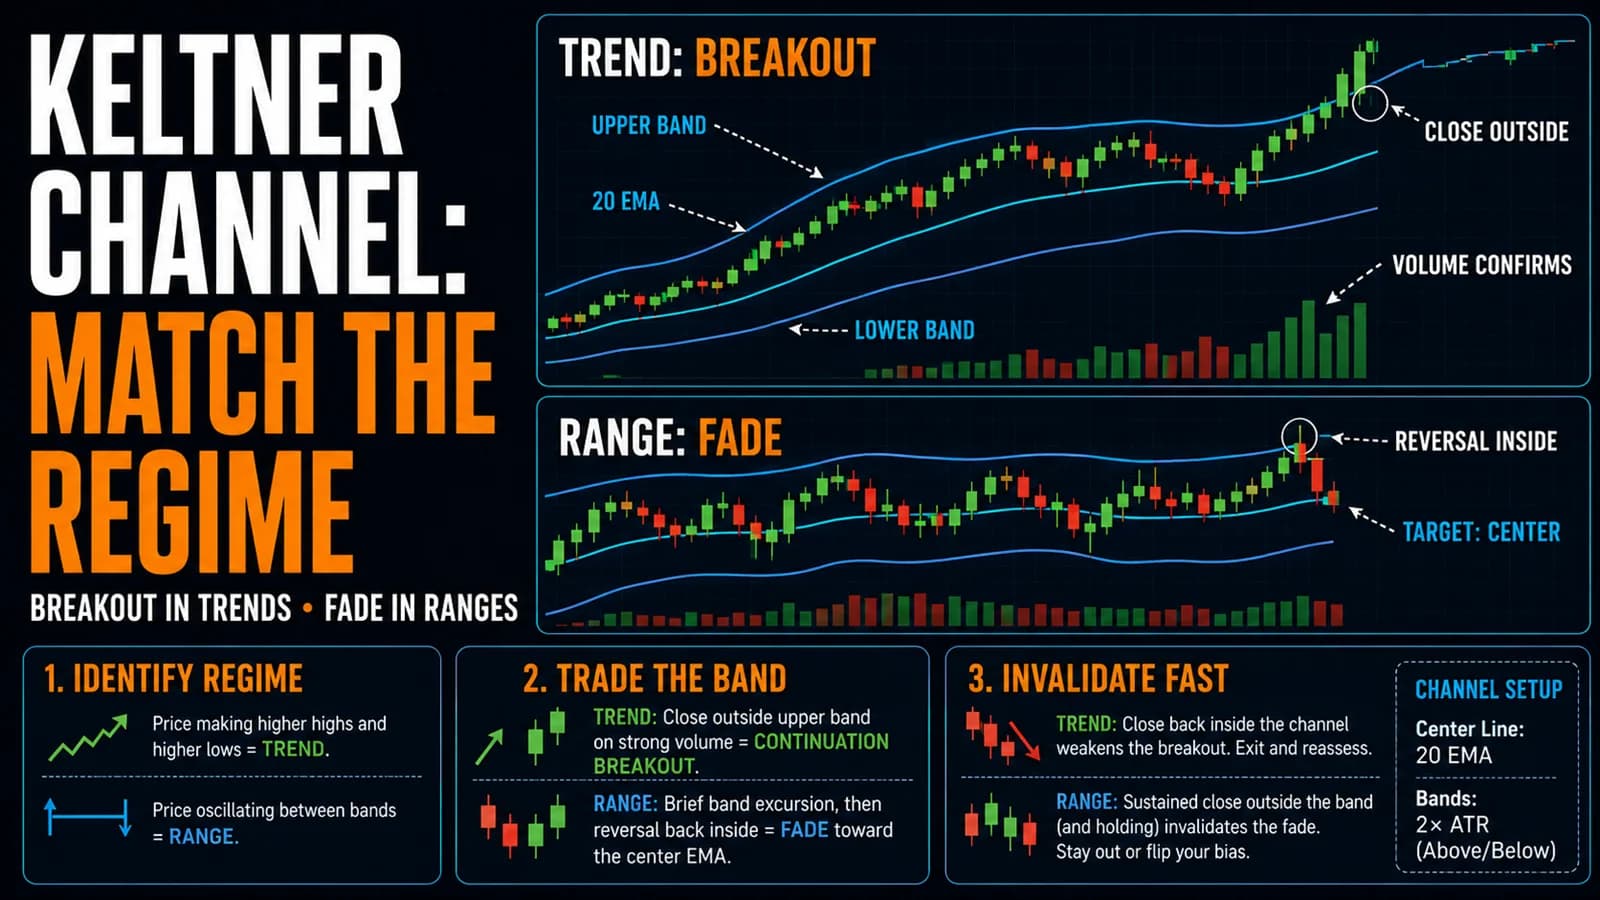
The Keltner Channel Day Trading Strategy
Trade Keltner Channels correctly: breakout versus mean reversion approaches, how ATR-based bands differ from Bollinger Bands, and key failure modes.
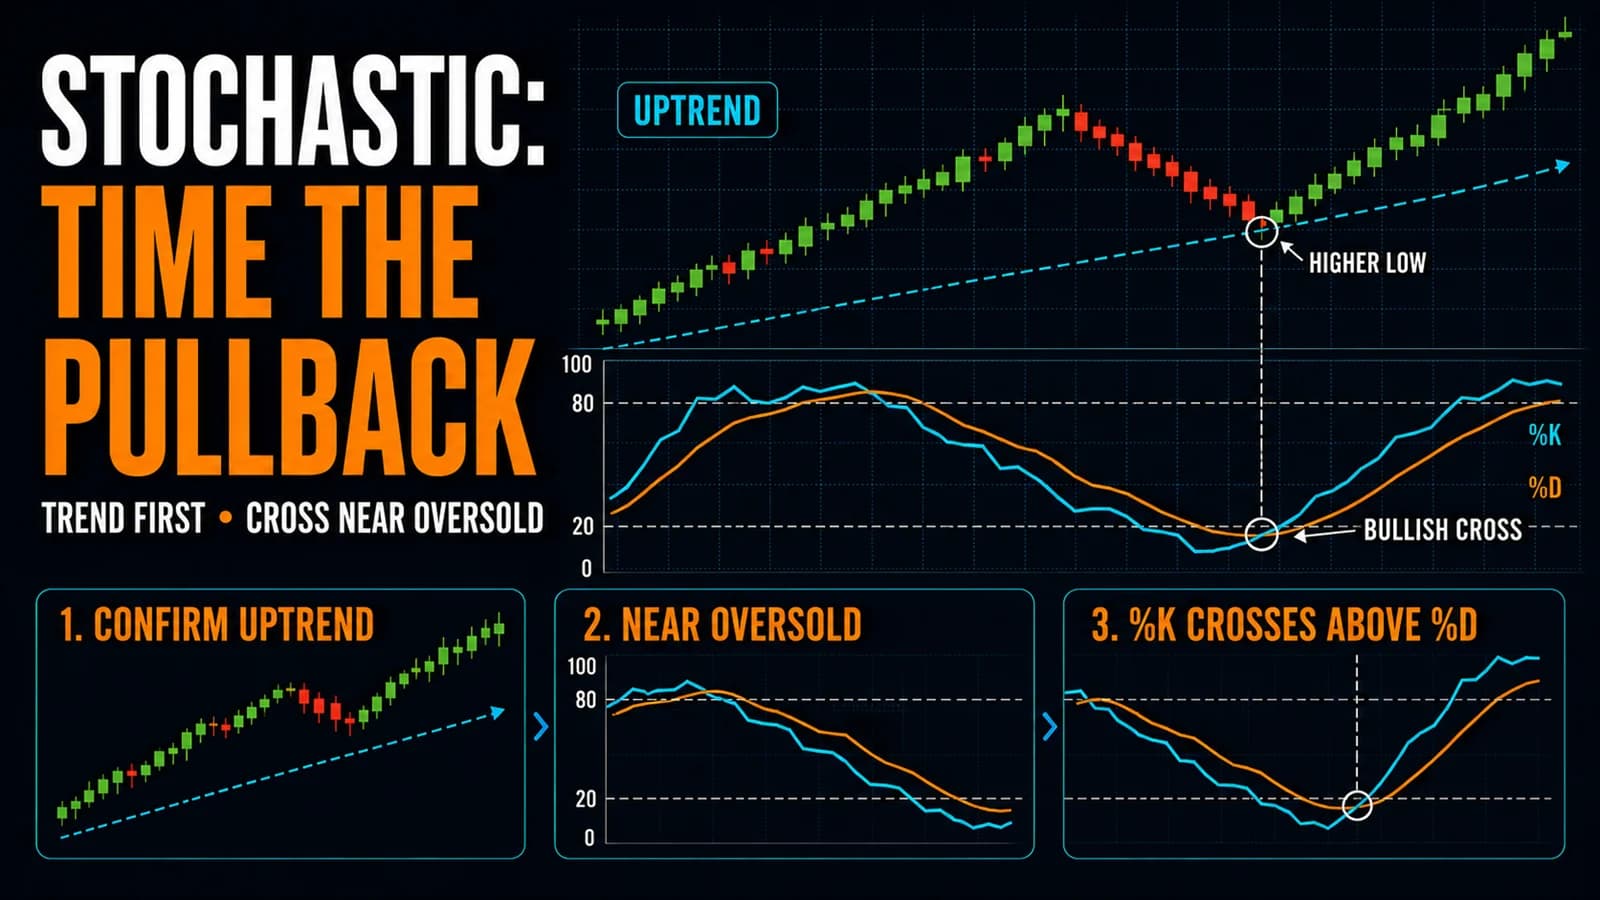
The Stochastic Oscillator Day Trading Strategy
Trade the stochastic oscillator correctly: how %K/%D crossovers work, why context beats raw overbought readings, and common failure modes.
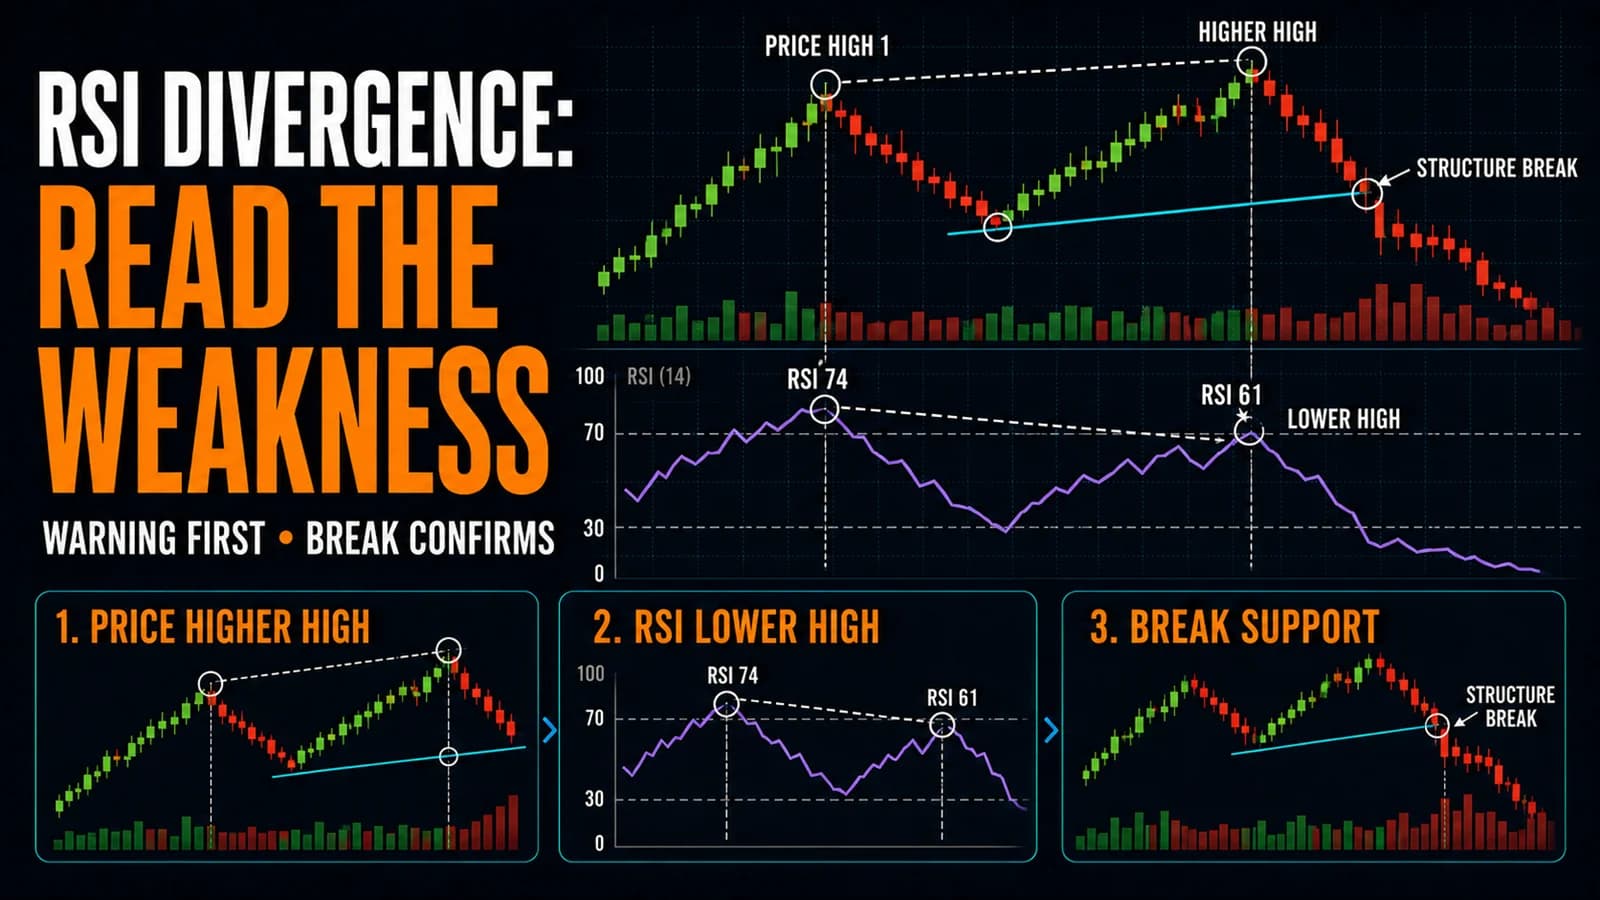
The RSI Divergence Trading Strategy for Day Traders
Trade RSI divergence with confidence: the difference between regular and hidden divergence, and why structural confirmation matters before entering.
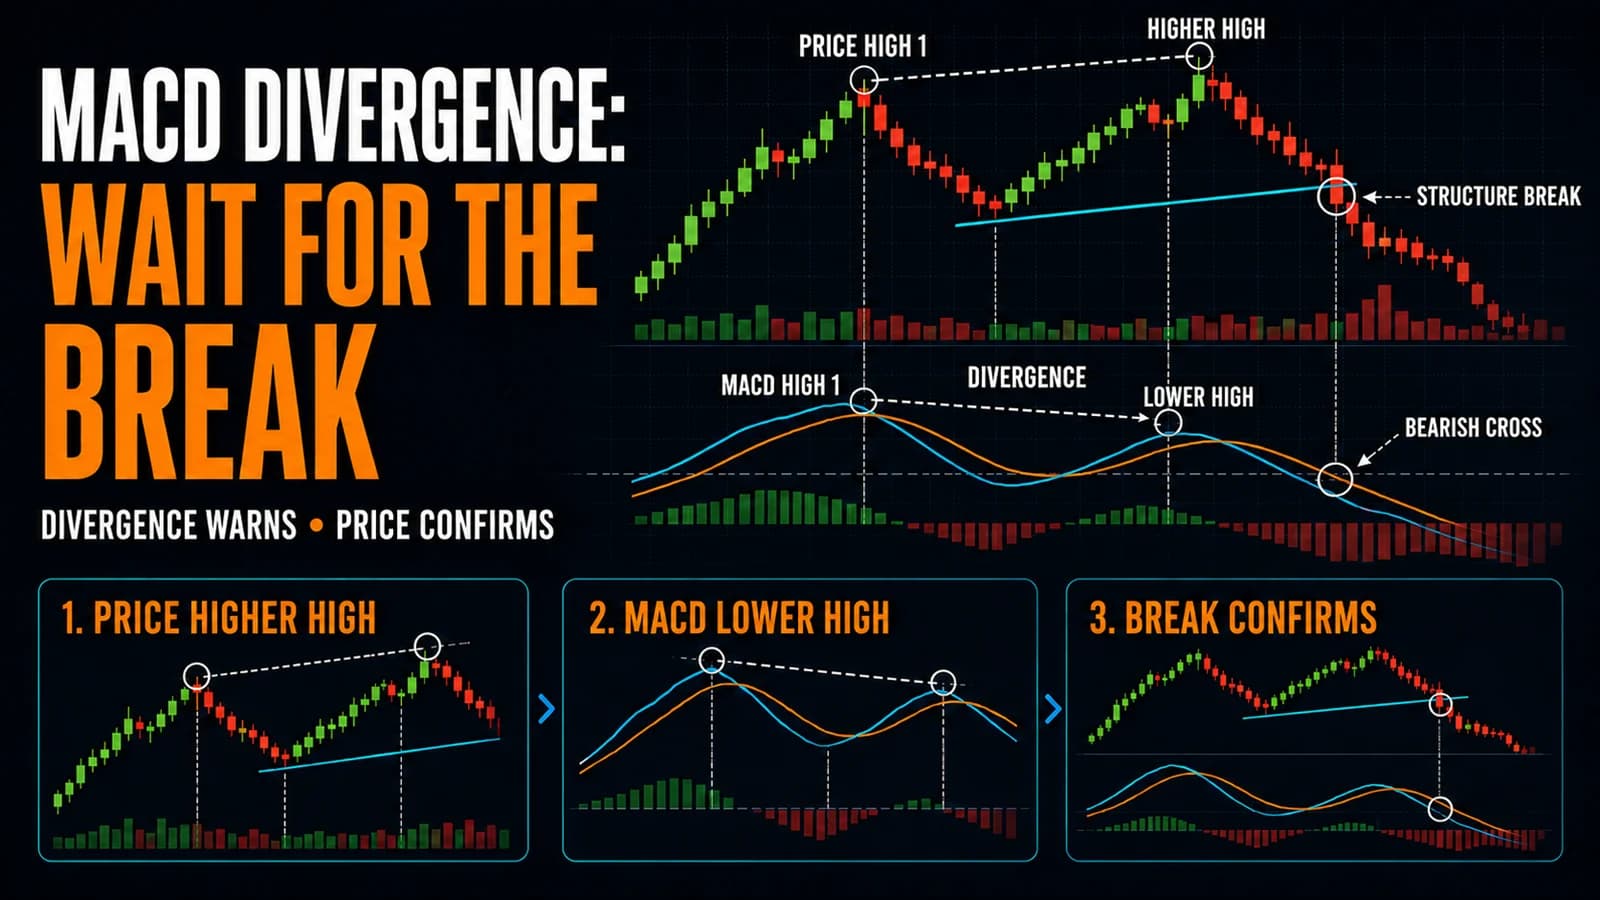
The MACD Divergence Strategy: Spotting Hidden Reversals
Learn to trade MACD divergence: the difference between regular and hidden divergence, and why confirmation matters before entering a reversal.
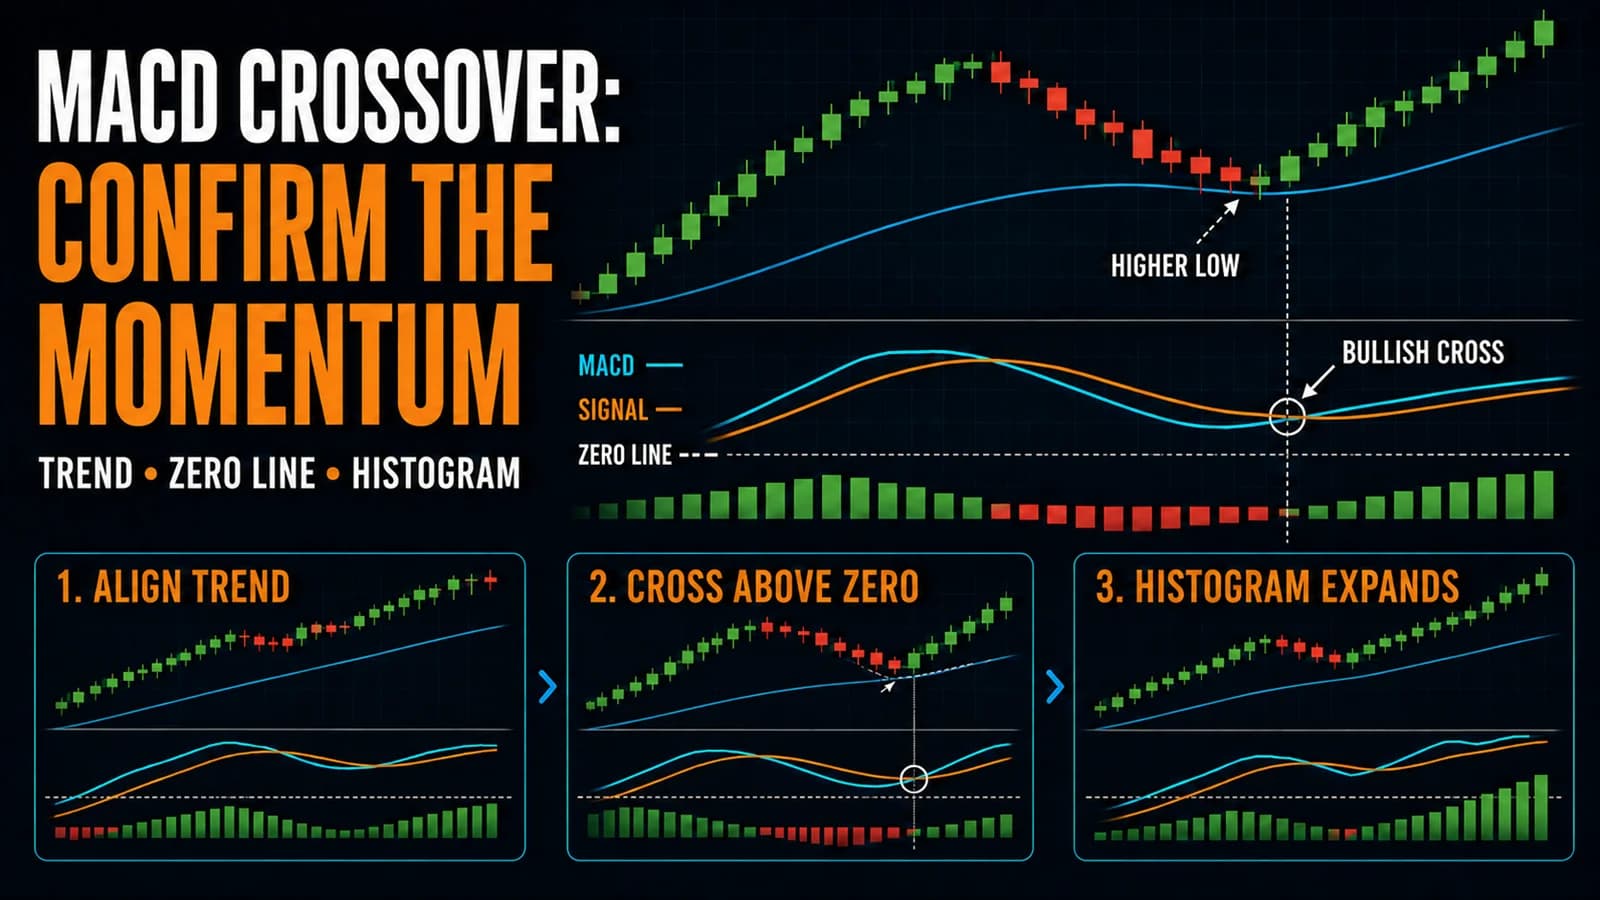
The MACD Crossover Day Trading Strategy
Trade MACD crossovers correctly: what the signal line cross really confirms, how to read the histogram, and why zero-line position matters.
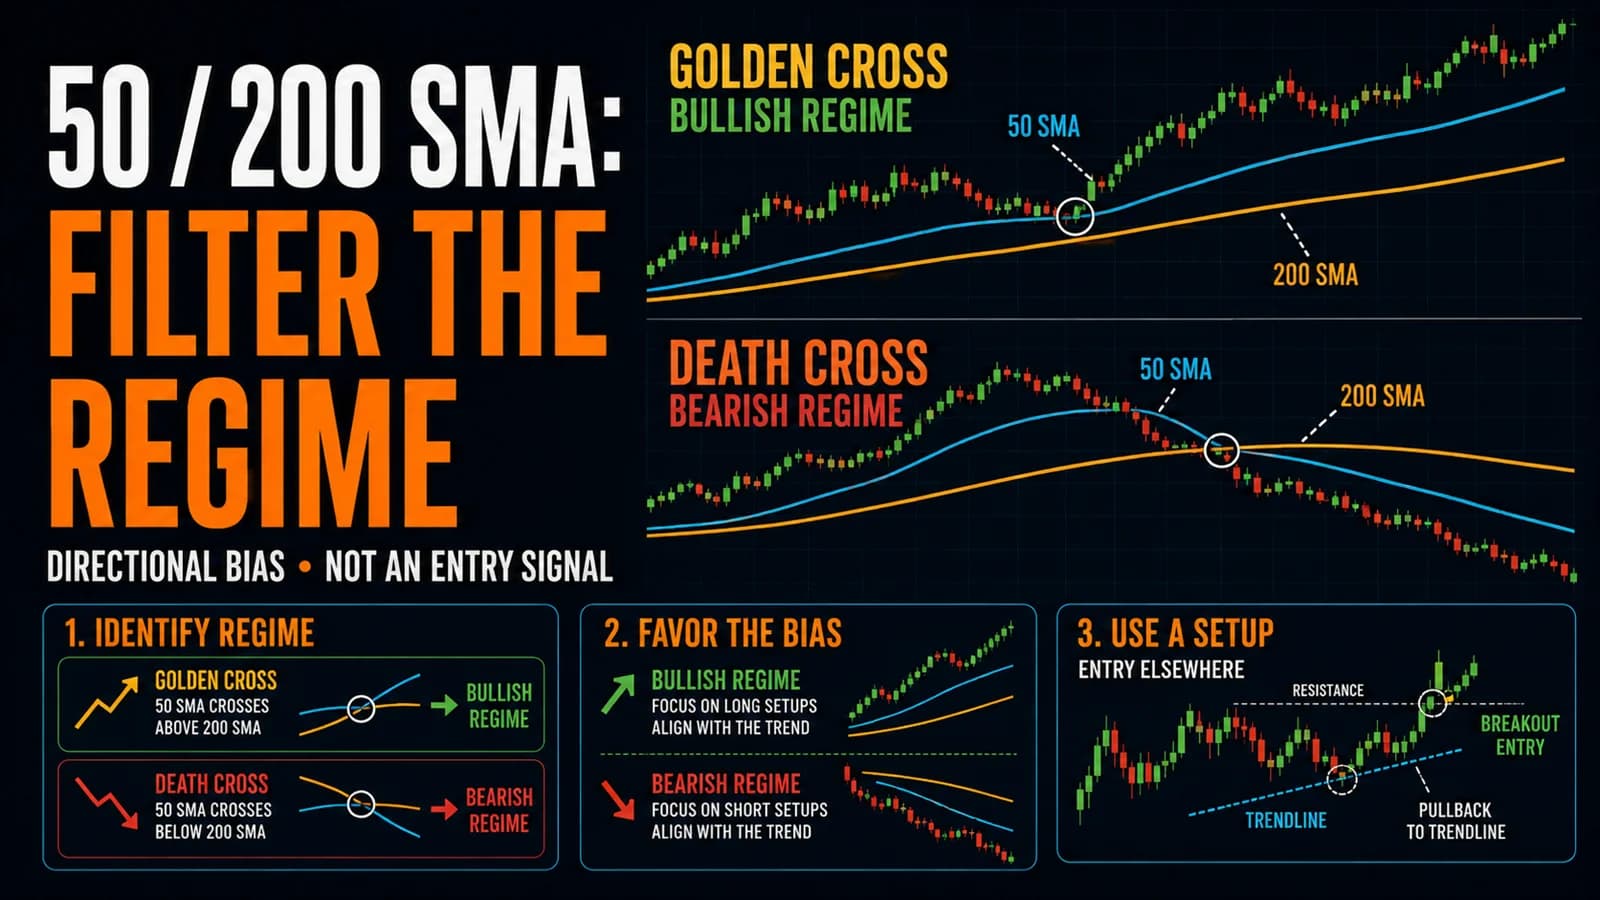
The 50/200 SMA Crossover Strategy for Day Traders
Understand the golden cross and death cross as a day trading regime filter, not an entry signal, with rules for using it alongside intraday setups.
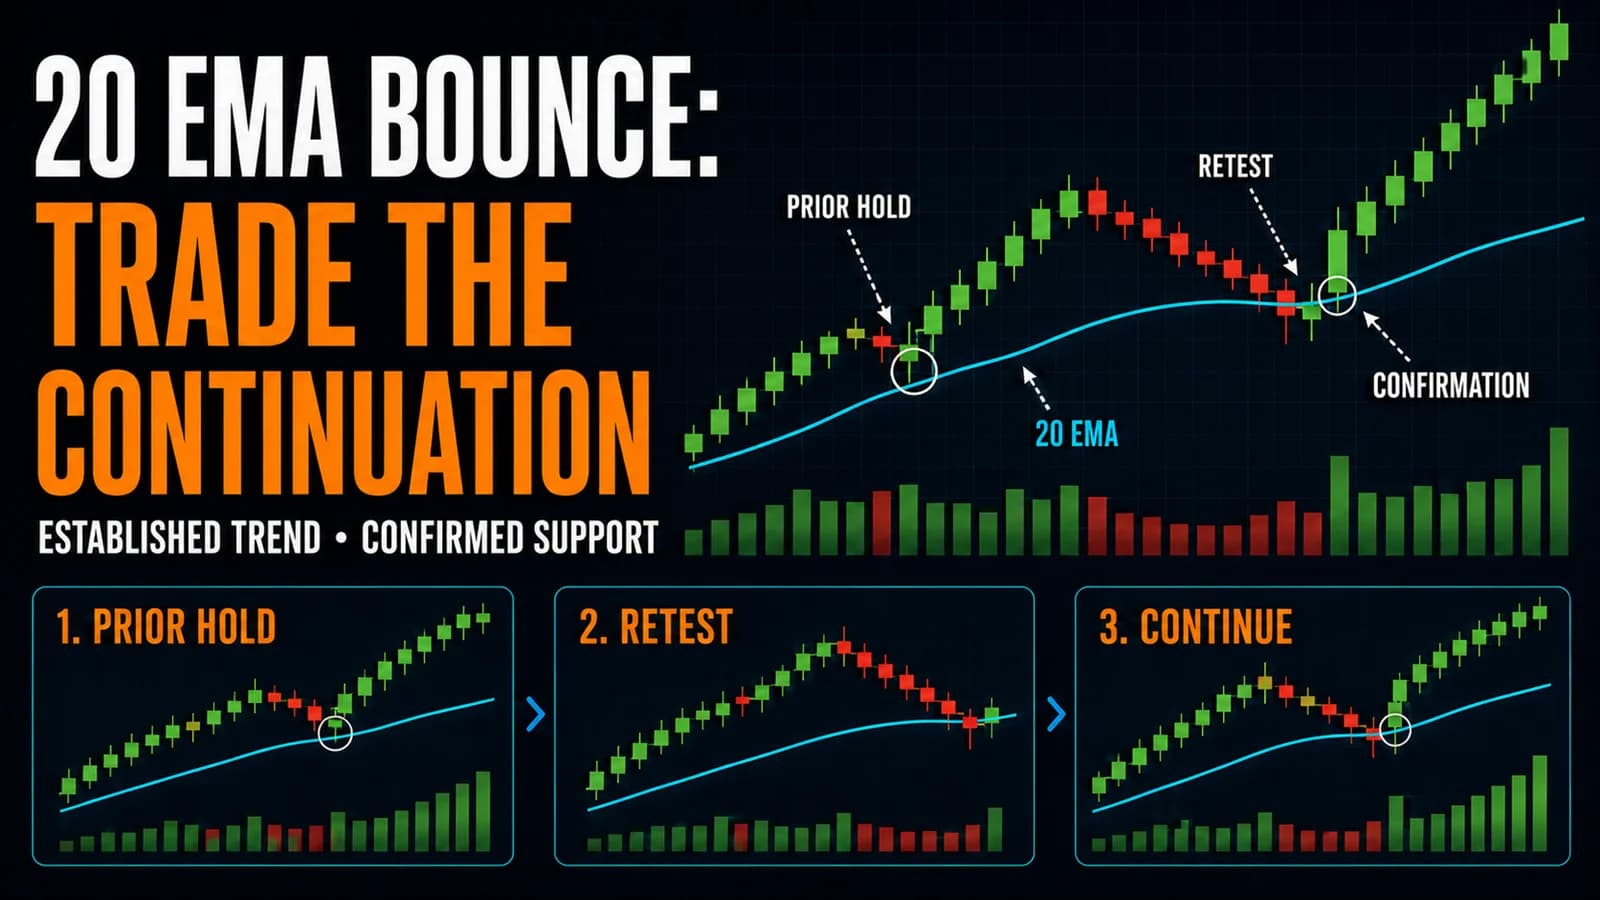
The 20 EMA Bounce Strategy: A Trend Continuation Classic
The 20 EMA bounce strategy explained: how to trade established trend pullbacks, set stops using volatility, and avoid trading unproven trends.