

Author Profile
Kazi Mezanur Rahman
Founder, independent researcher, and editor of DayTradingToolkit. A one-person publication focused on risk-first trading education and documented tool research. He trades his own capital as a retail trader and combines personal market experience with systematic primary-source research.
Areas of expertise
461
Published articles
Risk-first
Editorial focus
Independent
Review standard
About the Author
Kazi Mezanur Rahman is the founder, independent researcher, and editor behind DayTradingToolkit, a one-person publication. He built the site to organize practical trading education, primary-source research, calculators, and documented tool reviews in one place.
Kazi trades his own capital as a retail trader. He does not present himself as a professional trader, full-time trader, financial adviser, broker, accountant, or attorney. His experience comes from personal market participation combined with systematic research. The editorial approach is intentionally conservative: explain risks plainly, disclose affiliate relationships, avoid profit promises, clearly distinguish research from first-hand experience, and correct material errors when they are found.
Kazi oversees the site’s education library, research methodology, review structure, and content updates across beginner lessons, strategy explainers, psychology guides, calculators, and software comparisons.
Author Archive
Articles by Kazi Mezanur Rahman
Page 4 of 39. Showing 12 of 461 published guides, reviews, and trading resources.

Is TrendSpider Worth It? A Cost-Value Breakdown by Trader Profile
TrendSpider isn't a single price point, it's four tiers plus a paid trial plus an optional AI subscription. Here's whether it's worth it, broken down by three actual trader profiles instead of one blanket verdict.

5 Signs You're Not Ready for TrendSpider (Save Your Money)
TrendSpider is one of the most capable automation platforms available to retail traders. That's exactly why it's the wrong first purchase for a specific kind of trader. Here are five honest signs you're not there yet.
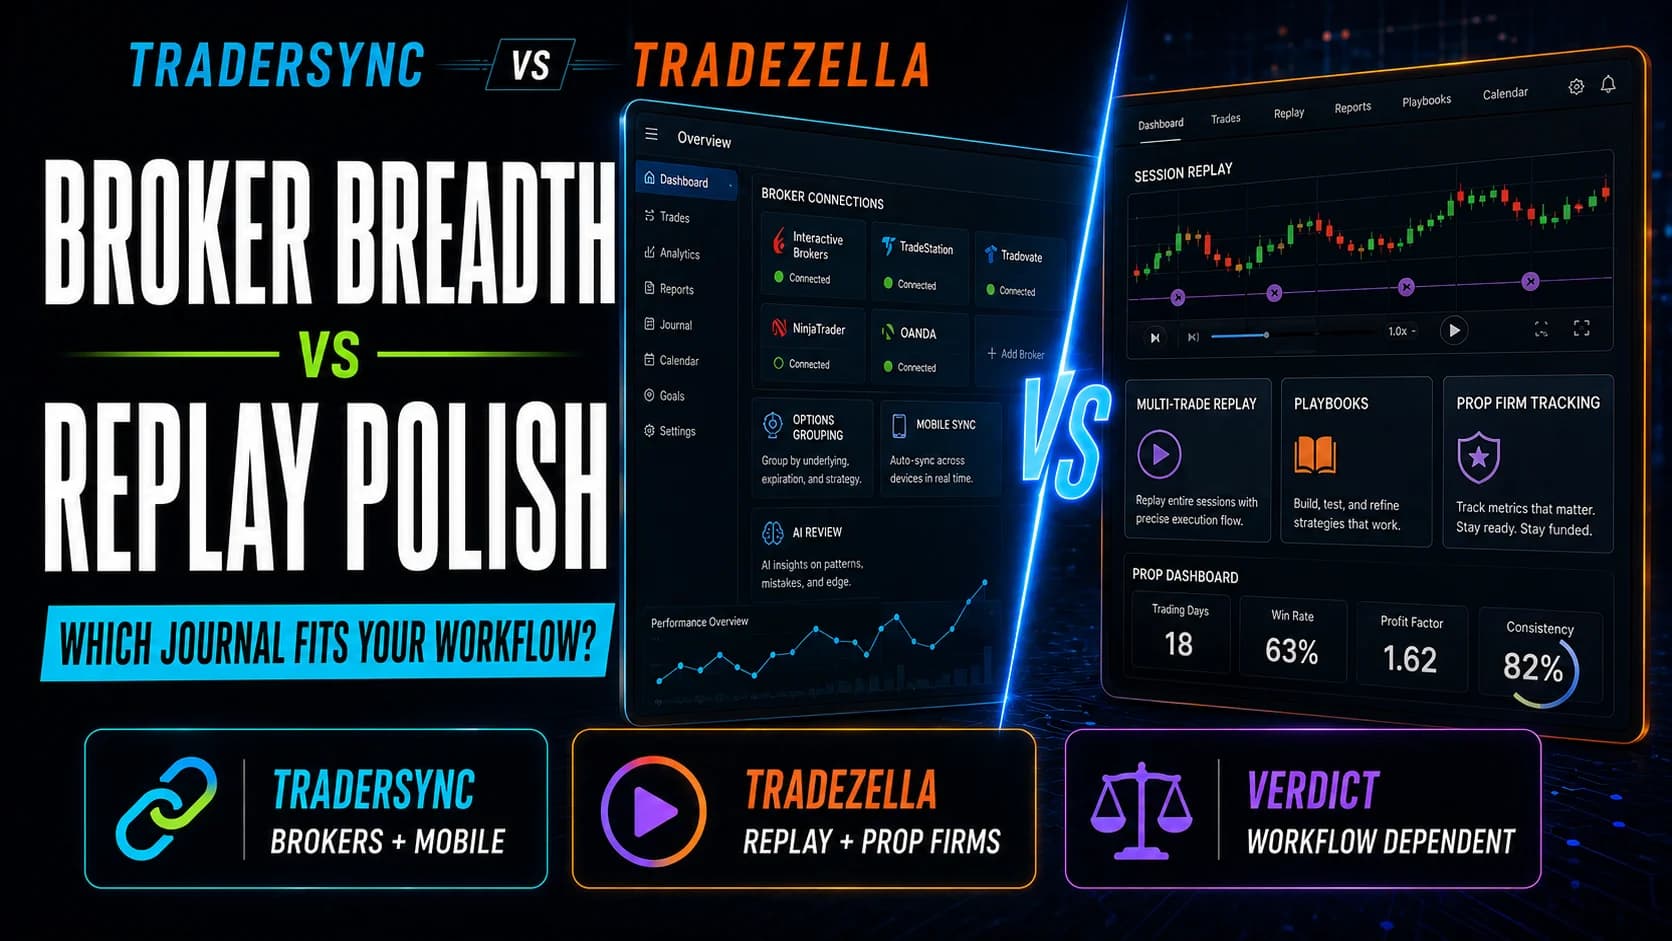
TraderSync vs. TradeZella: Which Journal Fits Your Workflow?
TraderSync and TradeZella charge almost the same price and both gate their best replay behind a higher tier. The real decision comes down to broker breadth, trial risk, and whether you're running prop firm accounts.
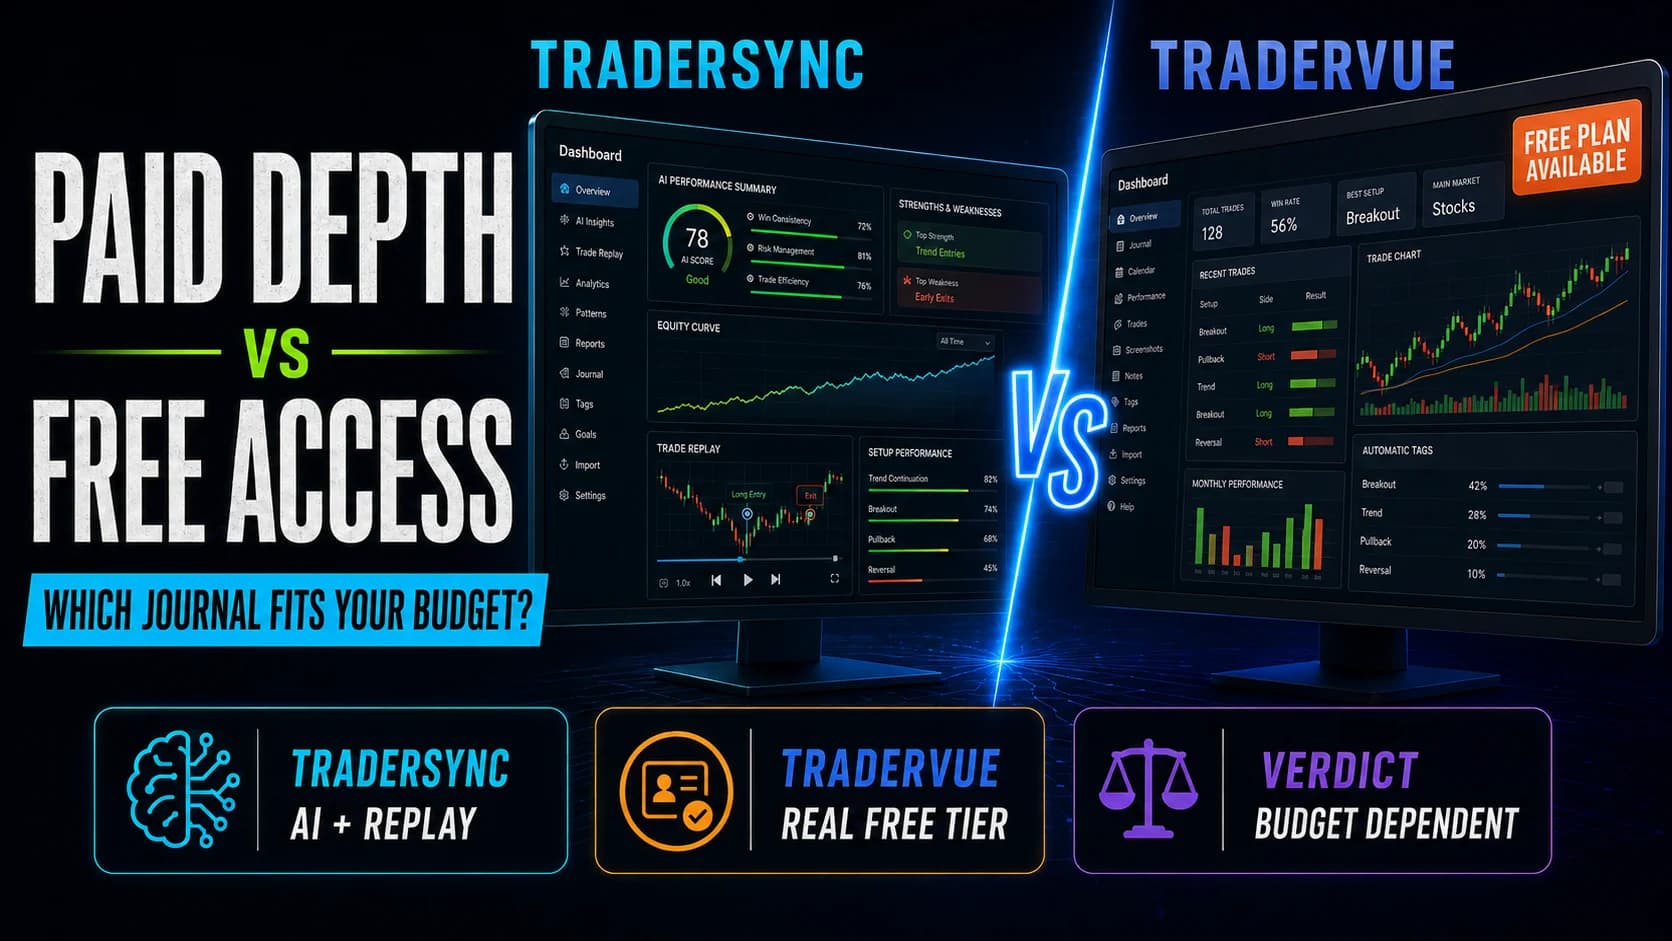
TraderSync vs. Tradervue: Free Plan or Paid Depth?
Tradervue's free tier is genuinely usable forever. TraderSync's AI, replay, and broker breadth make it the stronger paid platform on almost every other dimension. Here's when each one actually wins.
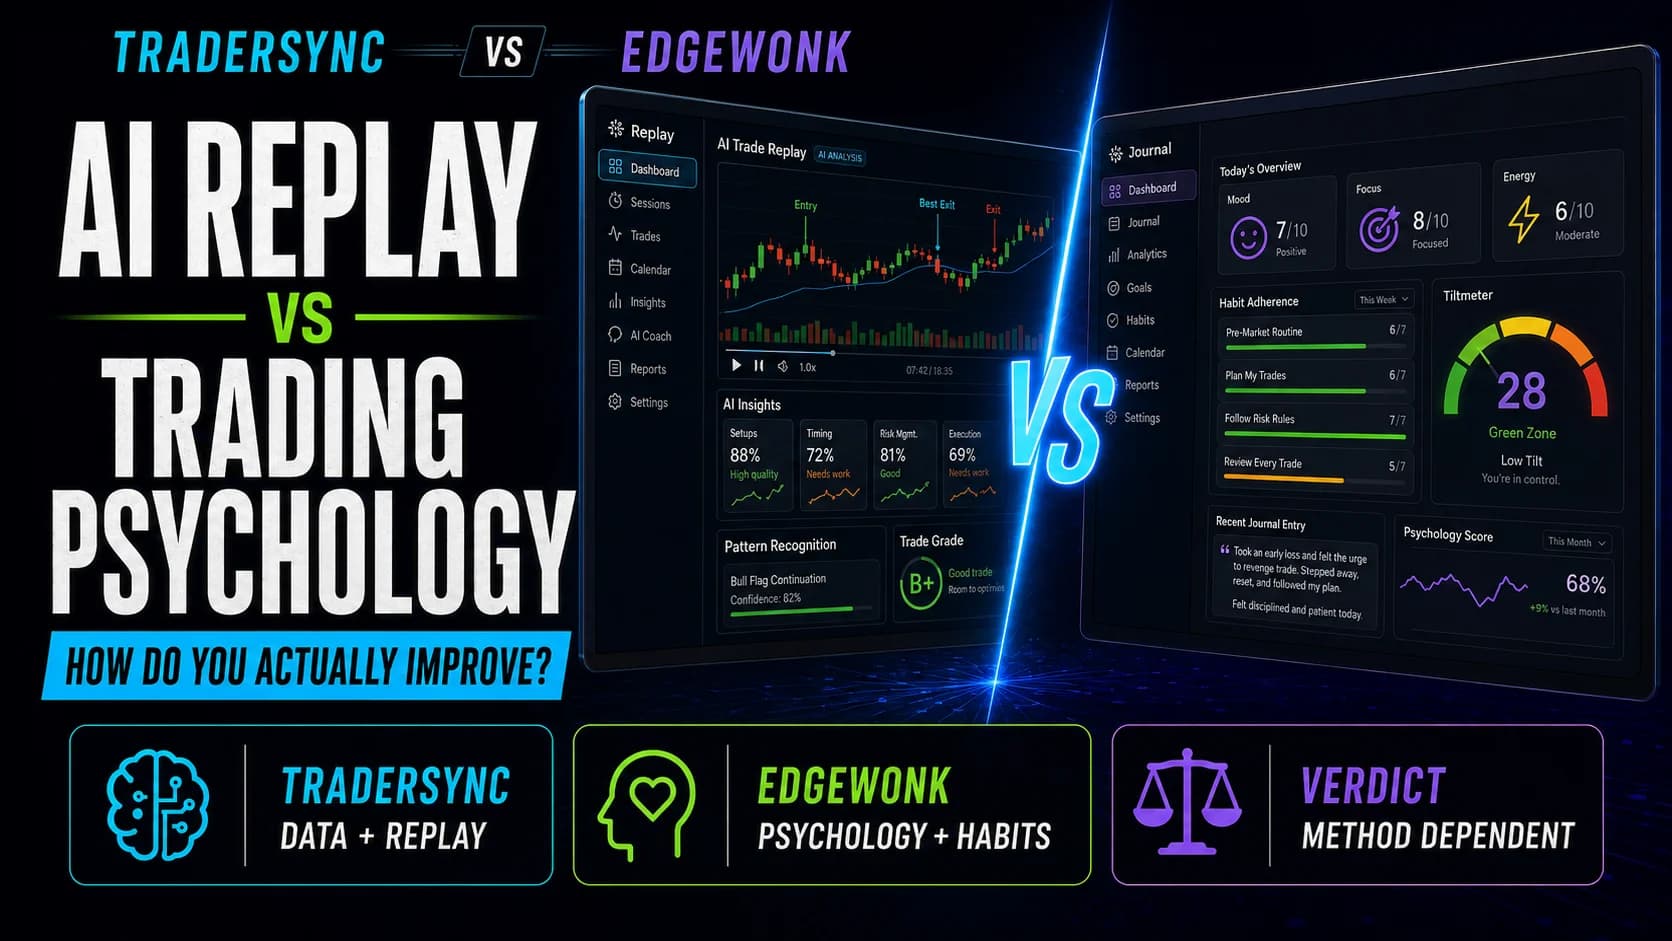
TraderSync vs. Edgewonk: AI Replay or Flat-Rate Psychology?
TraderSync measures what happened. Edgewonk measures why it happened psychologically, at a quarter of the price. Here's which theory of self-improvement actually matches how you review your own trading.
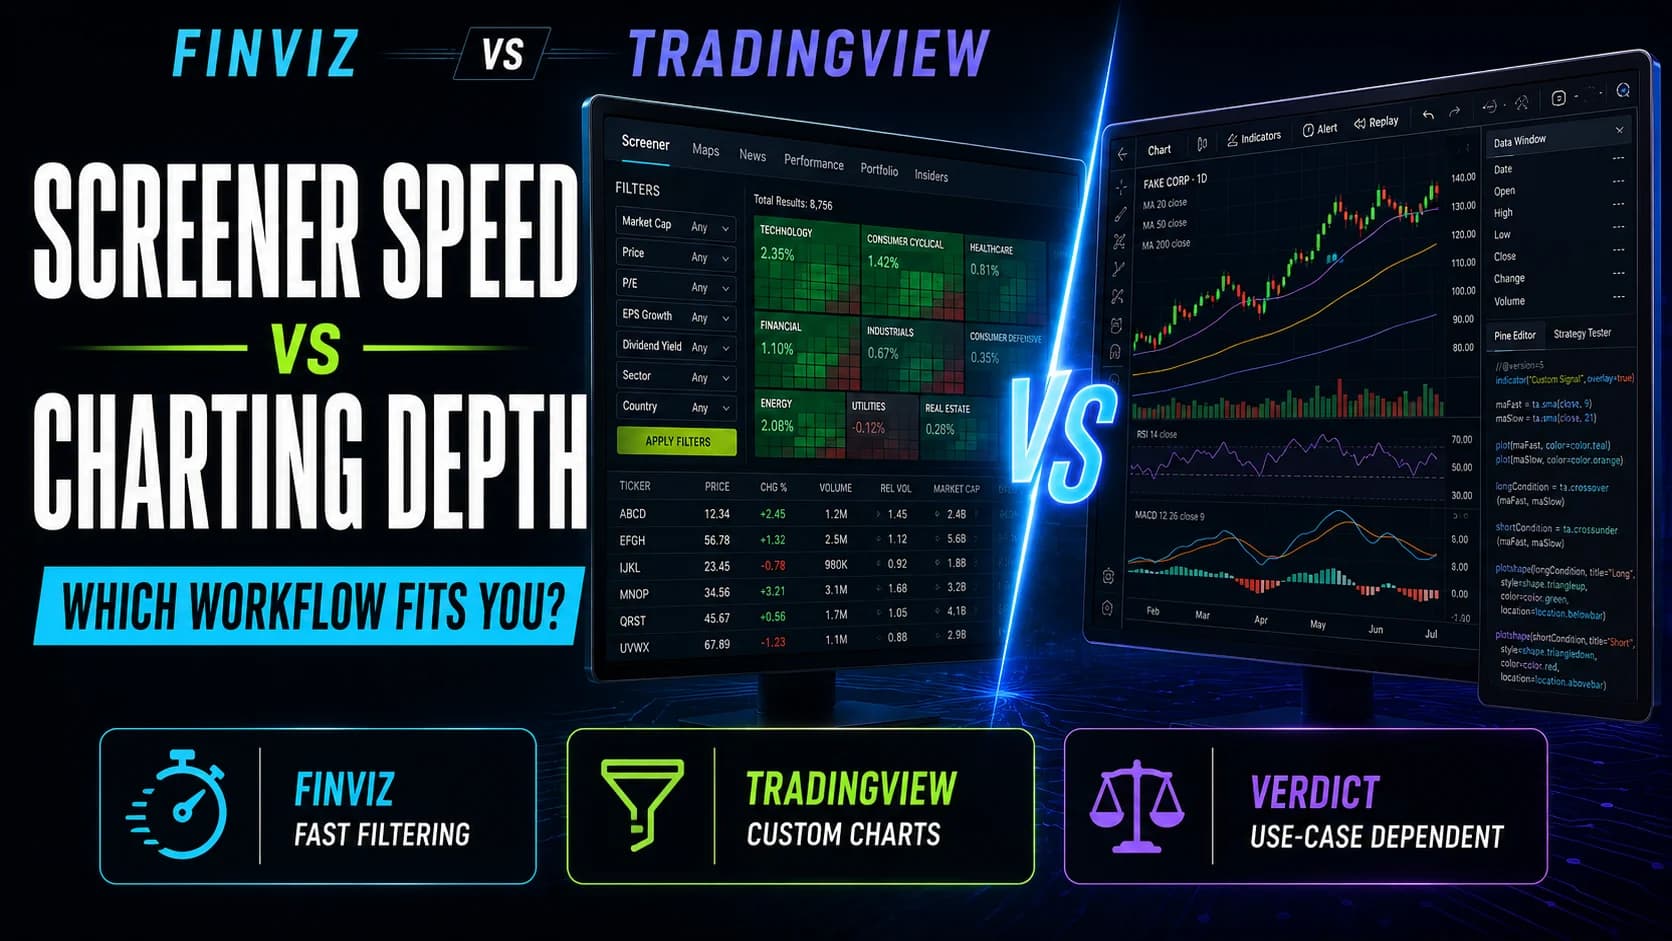
Finviz vs. TradingView: Screener Speed vs. Charting Depth
Finviz gets you to a watchlist fast and cheap. TradingView gives you the charting depth and execution to actually trade what you find. Here's which one your workflow actually needs.
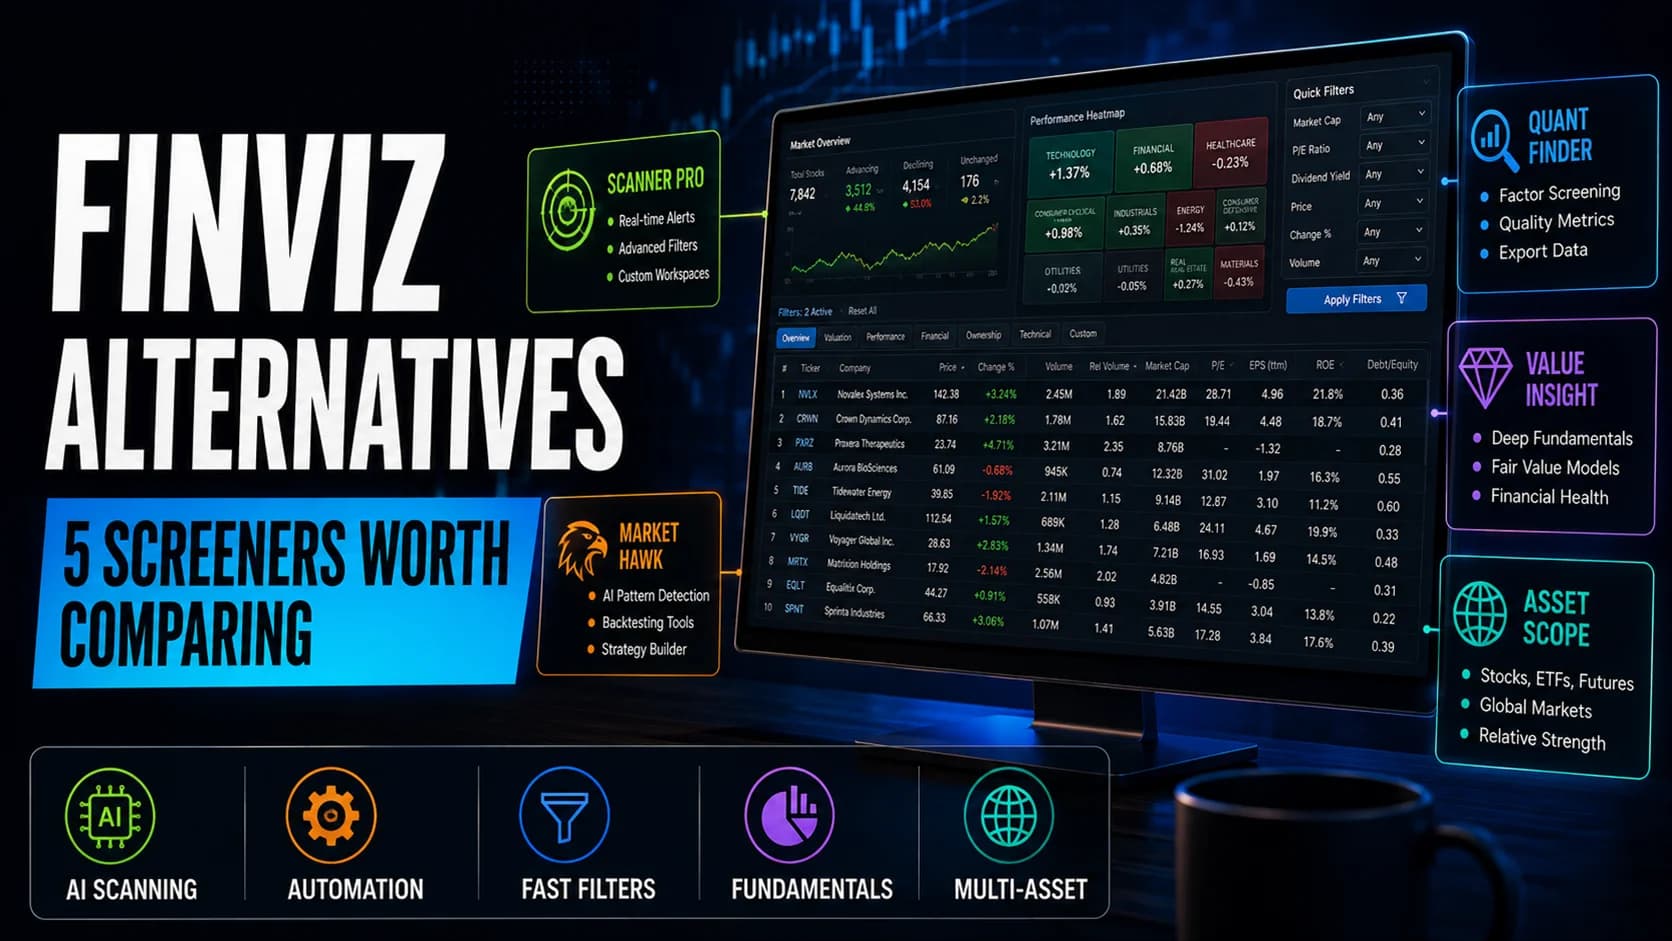
Finviz Alternatives: 5 Screeners Worth Comparing First
Finviz's limits are specific: a 15-minute delay on free, no broker integration, no custom indicators, US equities only. Here are five tools that each close a different one of those gaps, and what closing it actually costs.
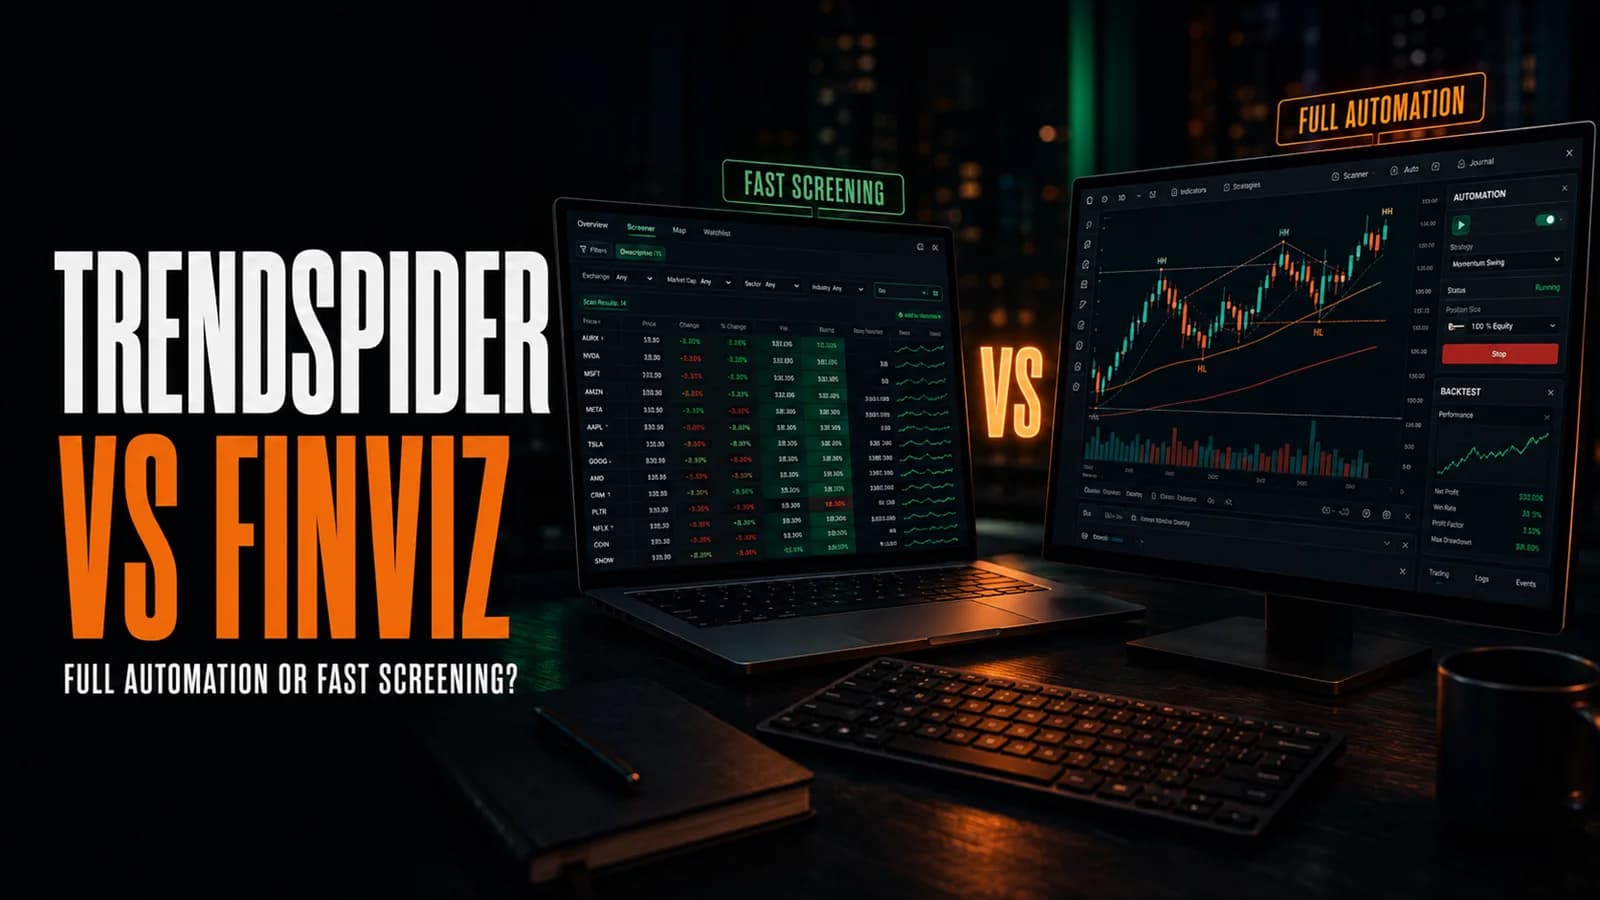
TrendSpider vs. Finviz: Full Platform or Screener?
Finviz gets you from idea to watchlist in seconds for the price of a coffee subscription. TrendSpider tries to be your whole research and automation stack. Here's which one actually fits your workflow.
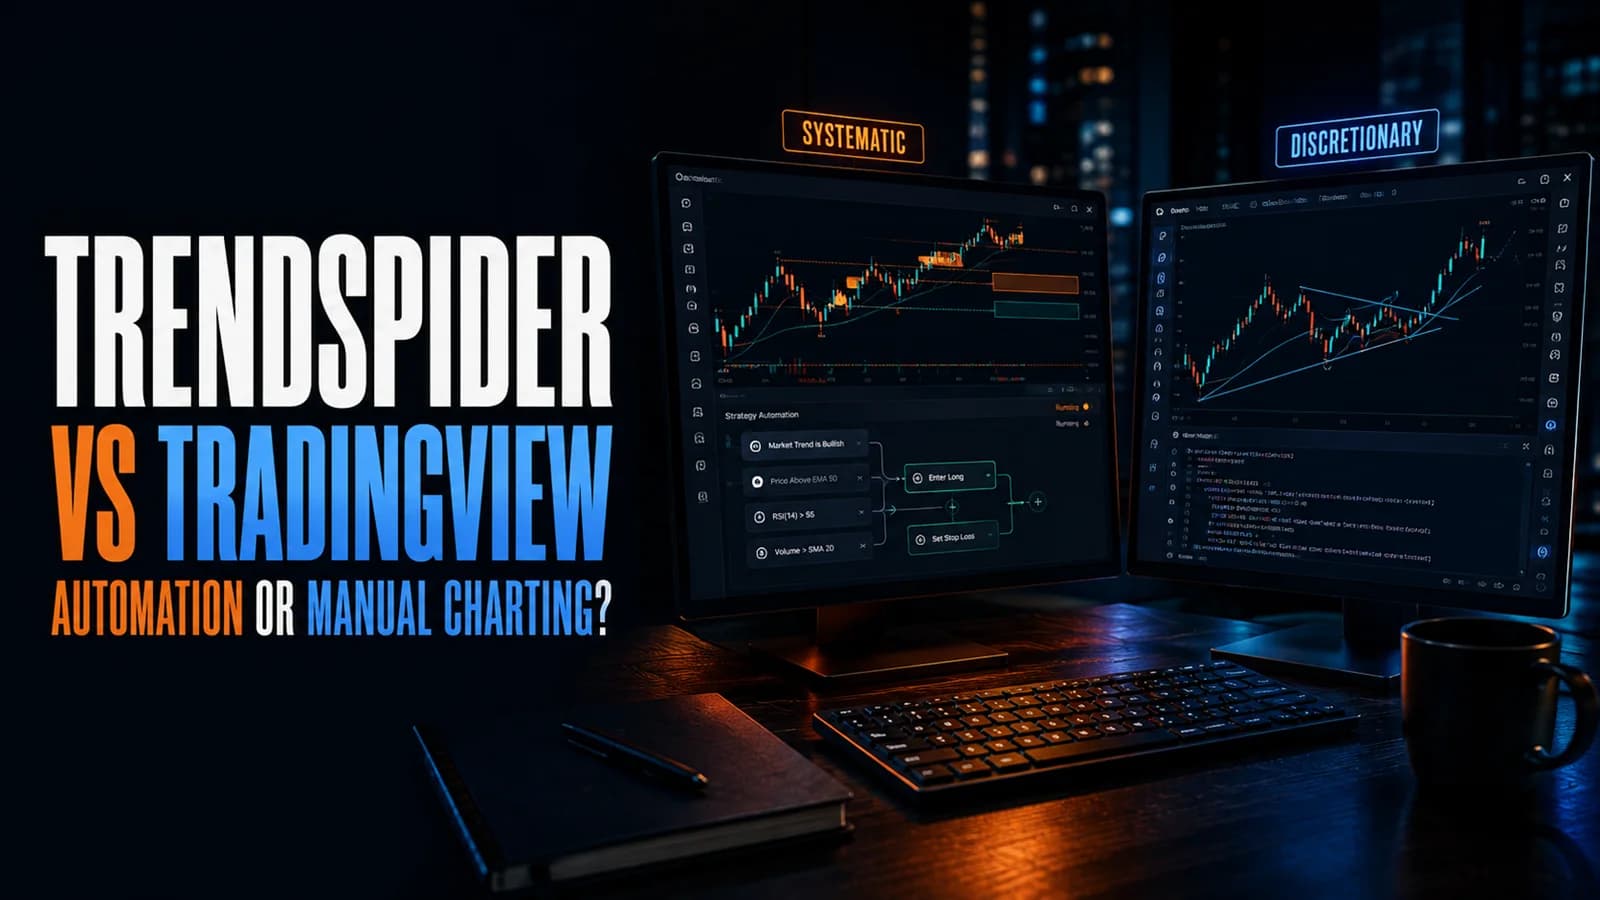
TrendSpider vs. TradingView: Automation or Manual Charting?
TrendSpider automates the technical analysis TradingView expects you to do by hand. Here's what that actually buys you, what it costs, and which platform fits which trader.
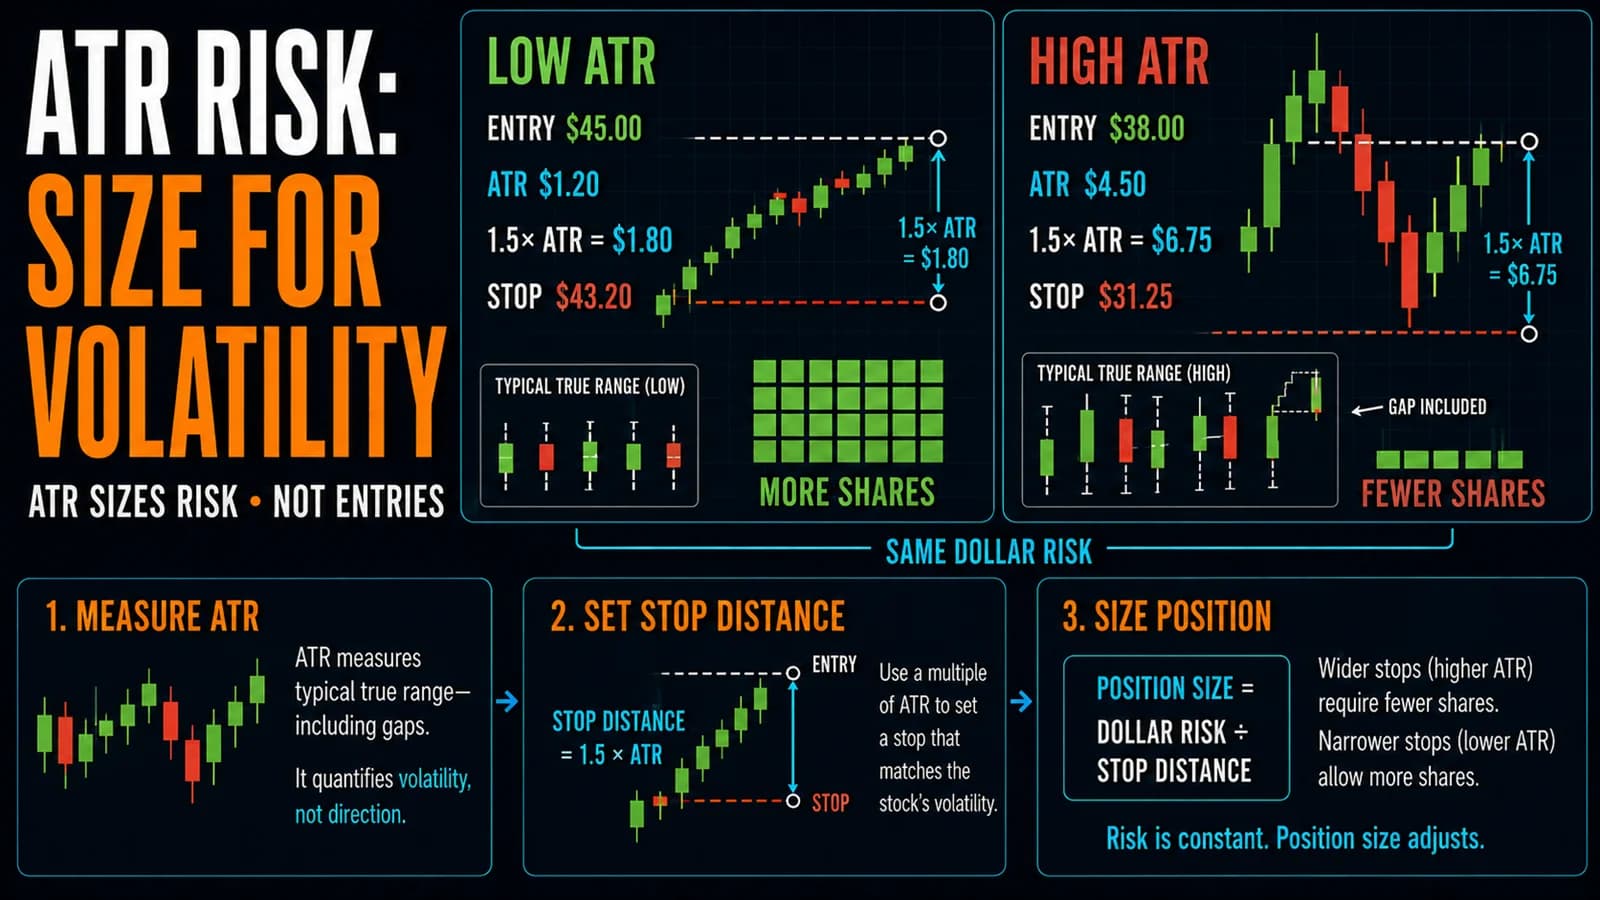
Trading With ATR: A Volatility-Adjusted Day Trading Strategy
Use ATR correctly to size stops, targets, and positions for each stock's real volatility, avoiding the common mistake of fixed dollar stops.
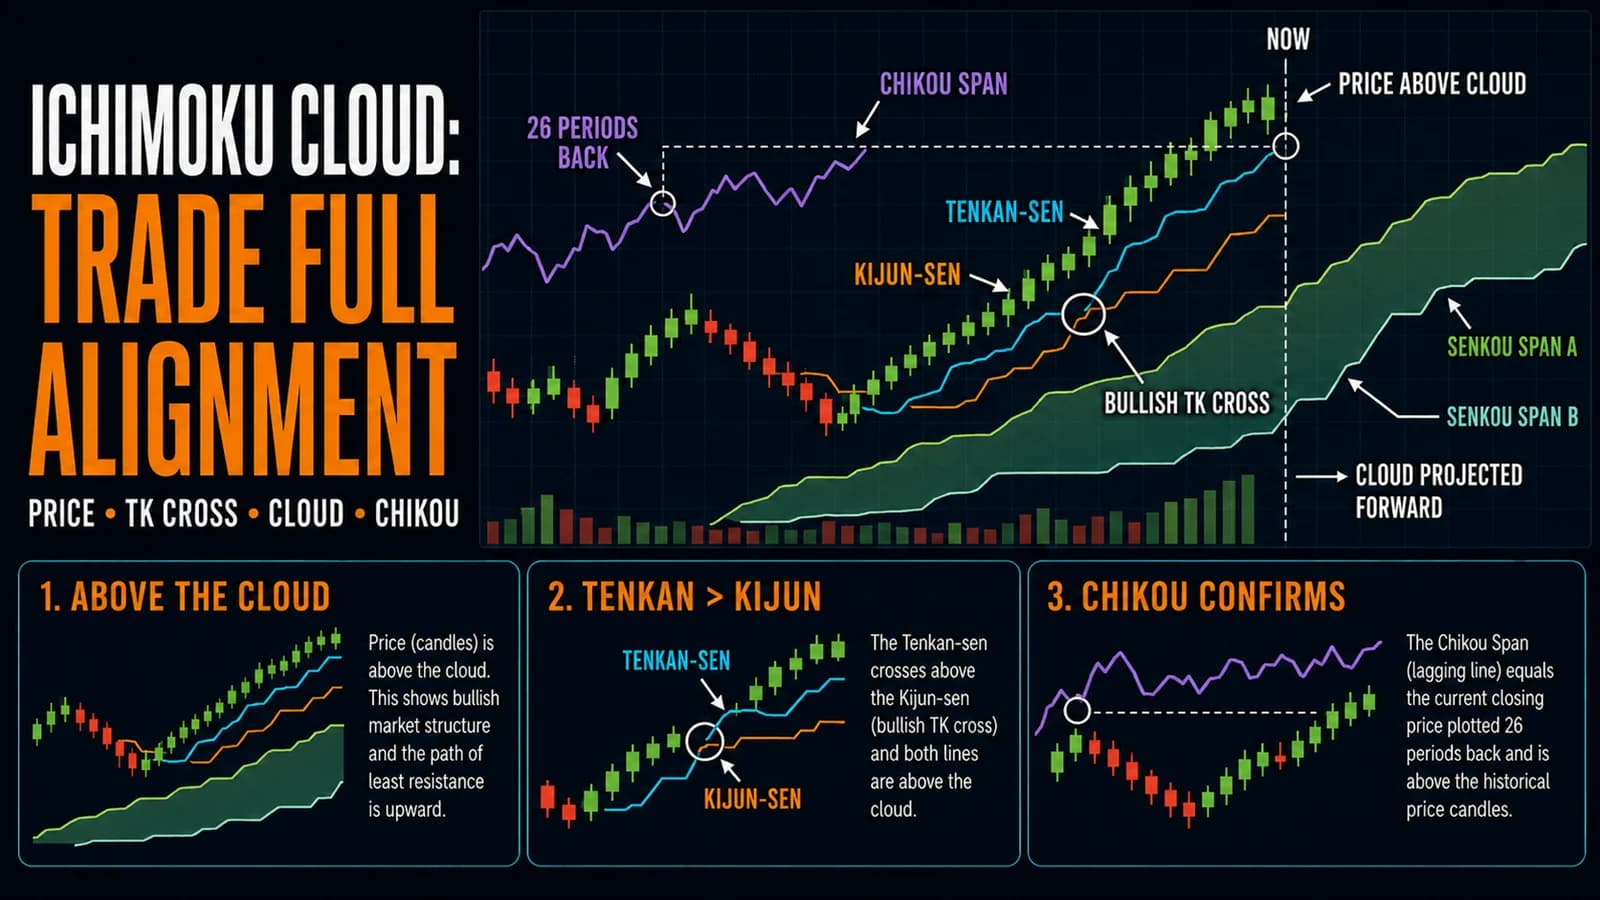
The Ichimoku Cloud Day Trading Strategy
Understand and trade Ichimoku Cloud: the five components explained, why full system alignment matters, and common mistakes to avoid.
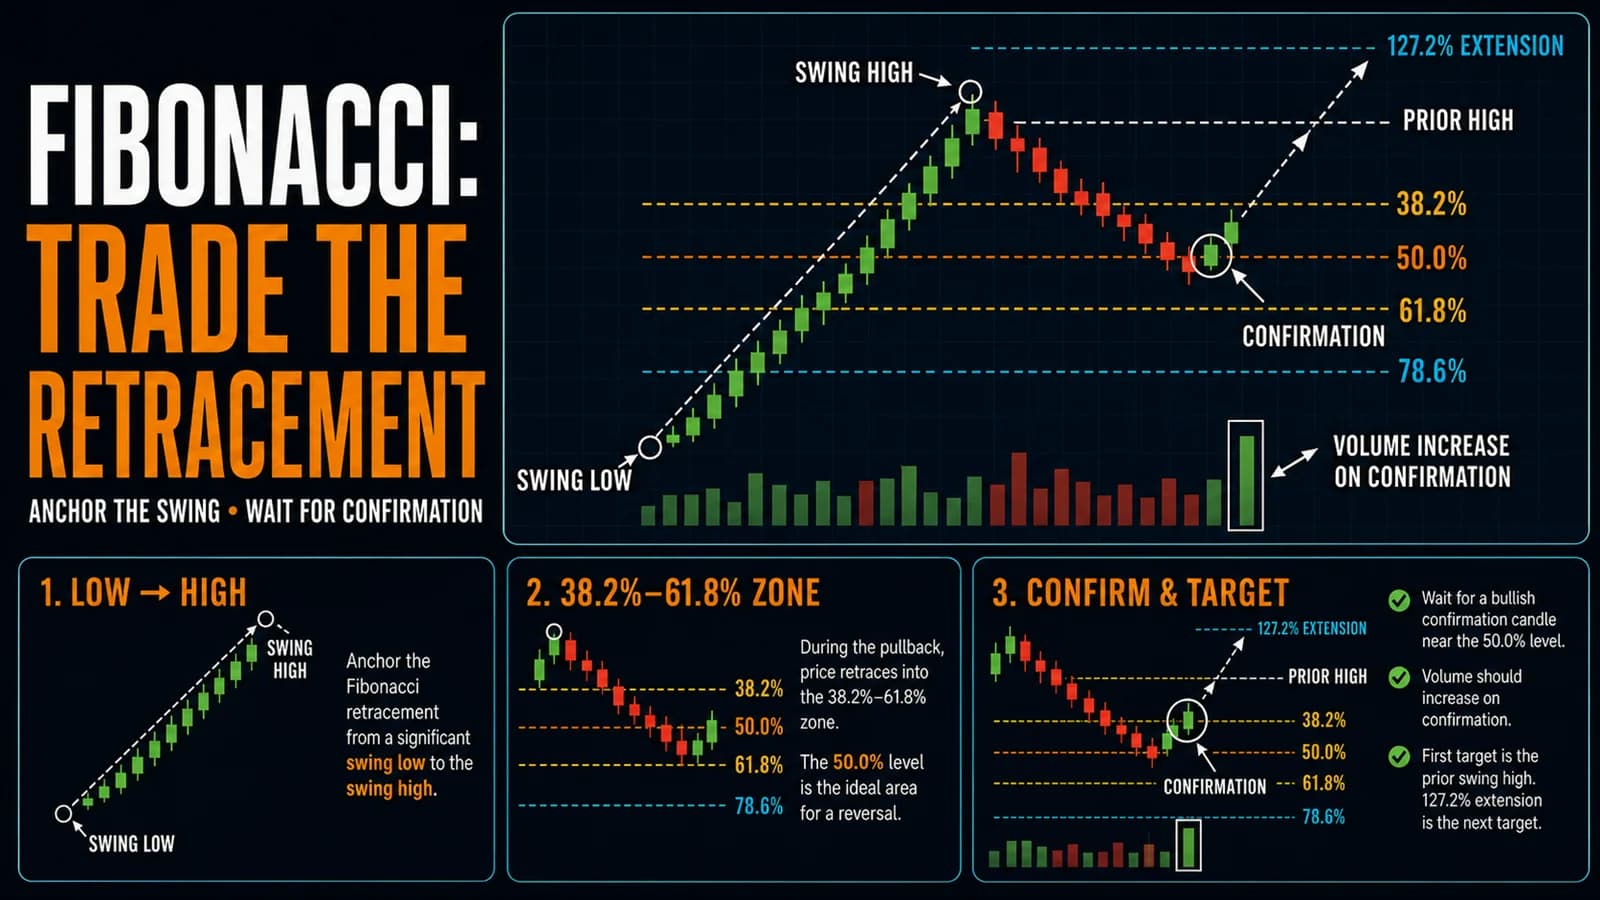
The Fibonacci Retracement Day Trading Strategy
Trade Fibonacci retracements with real confirmation: how to draw them correctly, why 61.8% matters most, and how to avoid trading isolated touches.