

Author Profile
Kazi Mezanur Rahman
Founder, independent researcher, and editor of DayTradingToolkit. A one-person publication focused on risk-first trading education and documented tool research. He trades his own capital as a retail trader and combines personal market experience with systematic primary-source research.
Areas of expertise
465
Published articles
Risk-first
Editorial focus
Independent
Review standard
About the Author
Kazi Mezanur Rahman is the founder, independent researcher, and editor behind DayTradingToolkit, a one-person publication. He built the site to organize practical trading education, primary-source research, calculators, and documented tool reviews in one place.
Kazi trades his own capital as a retail trader. He does not present himself as a professional trader, full-time trader, financial adviser, broker, accountant, or attorney. His experience comes from personal market participation combined with systematic research. The editorial approach is intentionally conservative: explain risks plainly, disclose affiliate relationships, avoid profit promises, clearly distinguish research from first-hand experience, and correct material errors when they are found.
Kazi oversees the site’s education library, research methodology, review structure, and content updates across beginner lessons, strategy explainers, psychology guides, calculators, and software comparisons.
Author Archive
Articles by Kazi Mezanur Rahman
Page 12 of 39. Showing 12 of 465 published guides, reviews, and trading resources.

Trading the Breakout of Prior-Day High/Low Levels
PDH and PDL need no formula, just yesterday's range. This guide covers the breakout, the liquidity-sweep fade, and why stops cluster right at these levels.
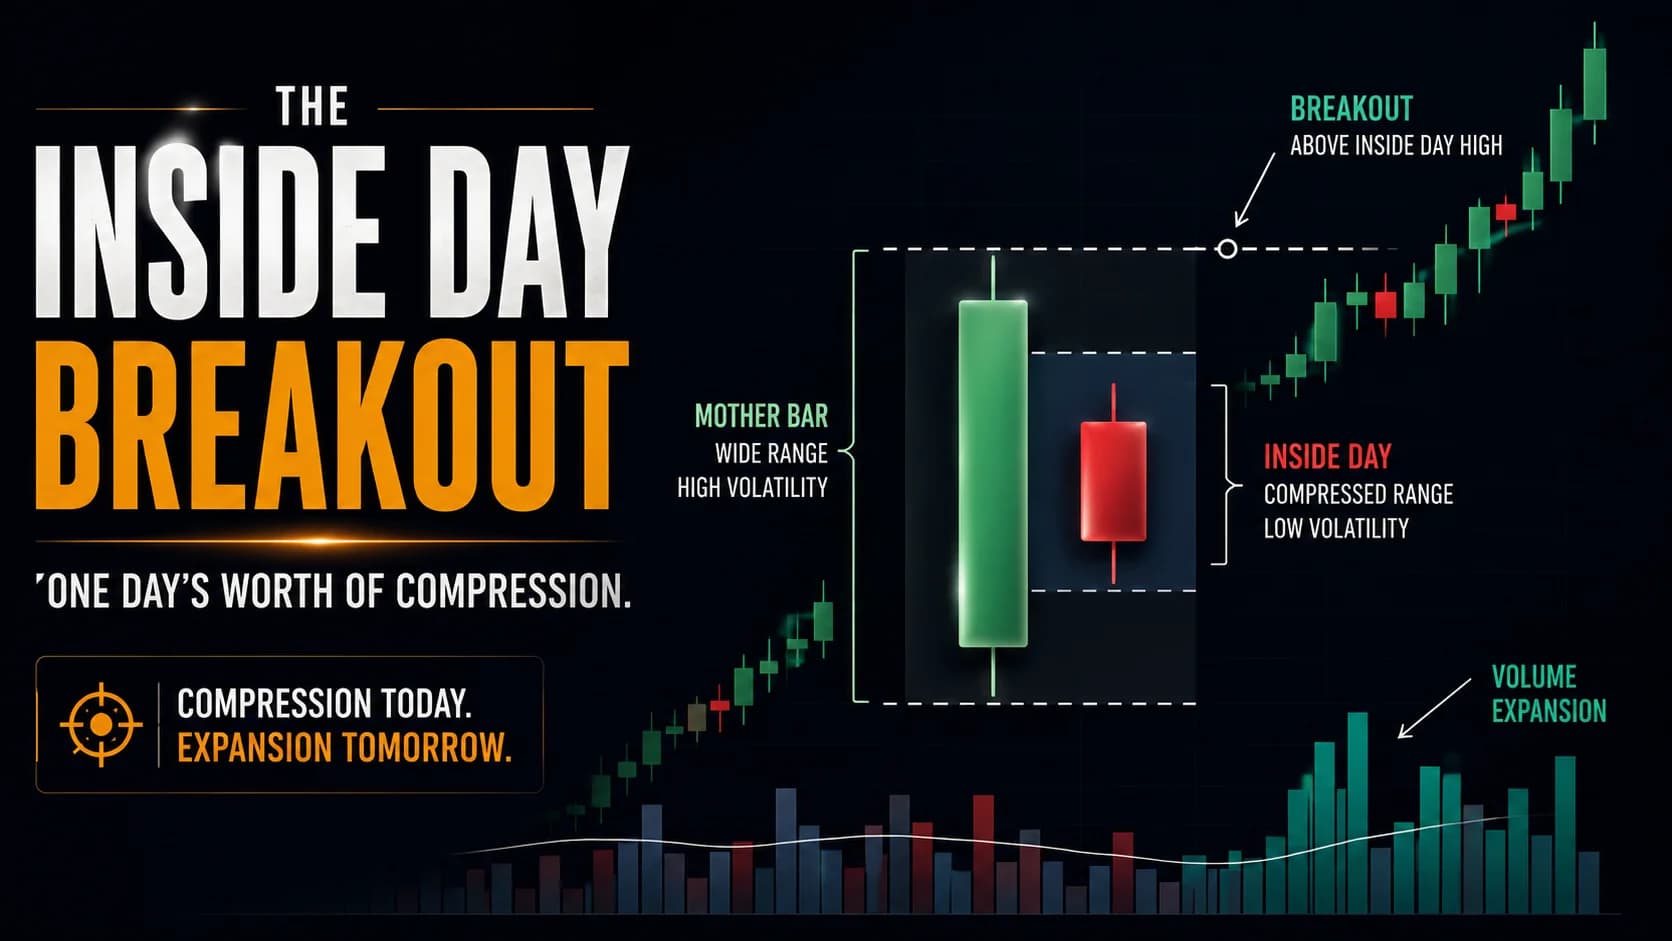
The Inside Day Breakout Strategy for Day Traders
An inside day compresses an entire session inside the prior one. This guide covers trading the breakout, the NR7 combination, and why it needs to work fast.

Trading Breakouts From Consolidation: The Volatility Contraction Pattern
The VCP isn't just a volatility squeeze. This guide covers the staged contraction sequence, the pivot point, and why context matters as much as the pattern.
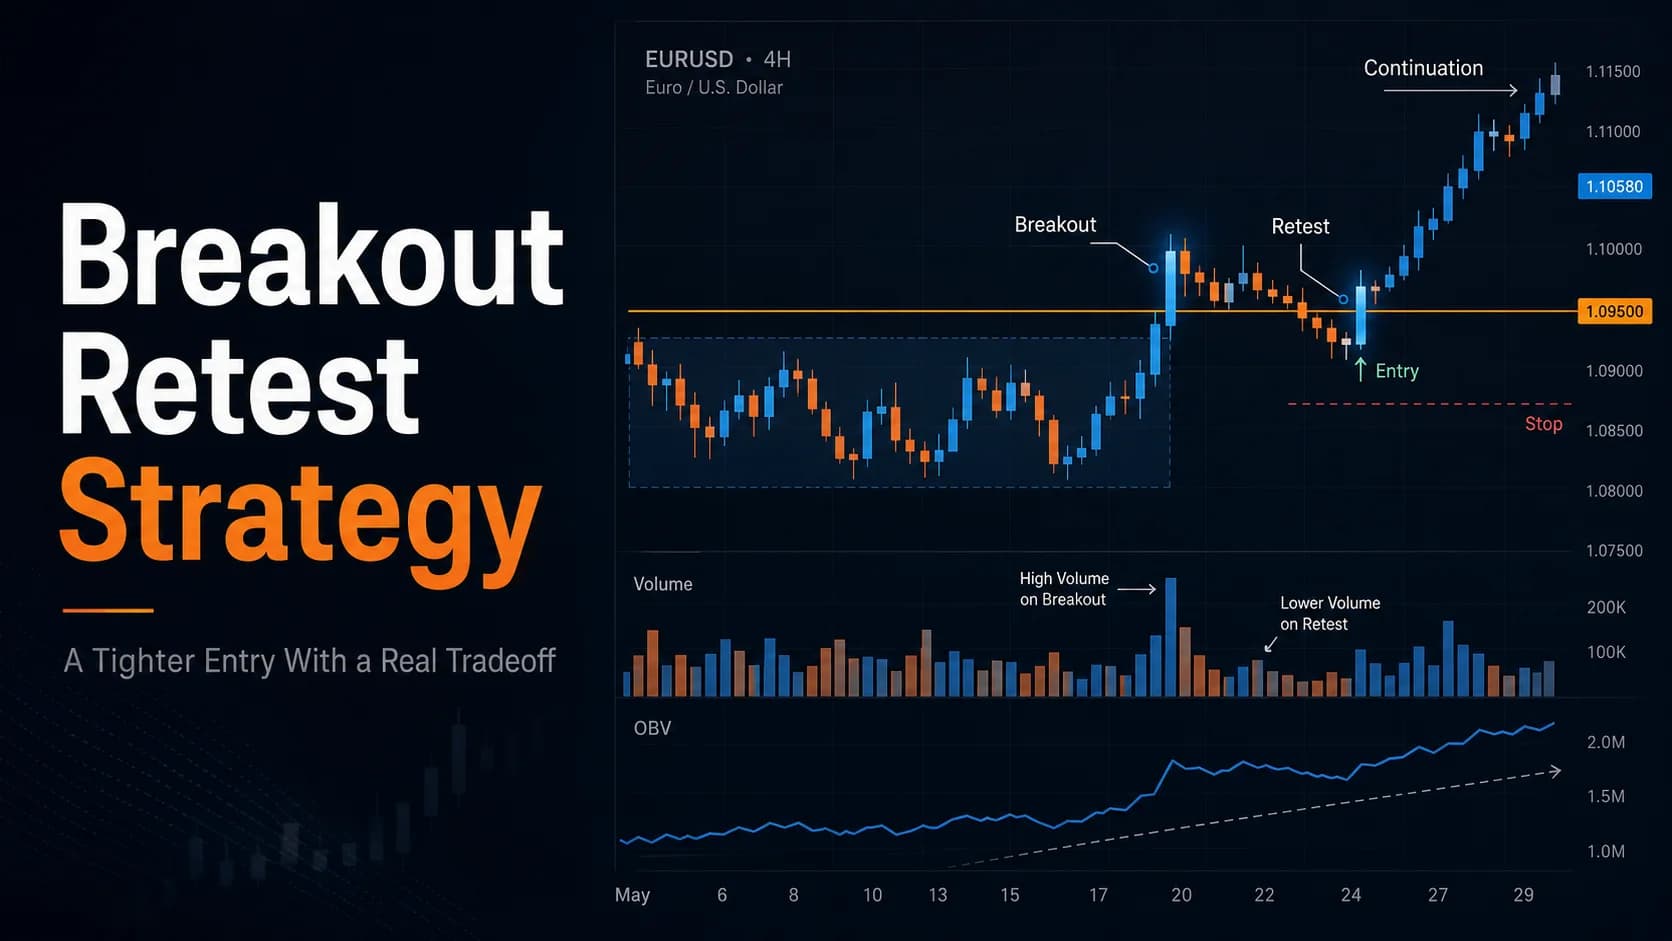
The Retest Strategy: How to Trade the Pullback After a Breakout
Retests offer a better entry price, but the data shows breakouts that never look back tend to perform better. This guide covers trading the retest honestly.
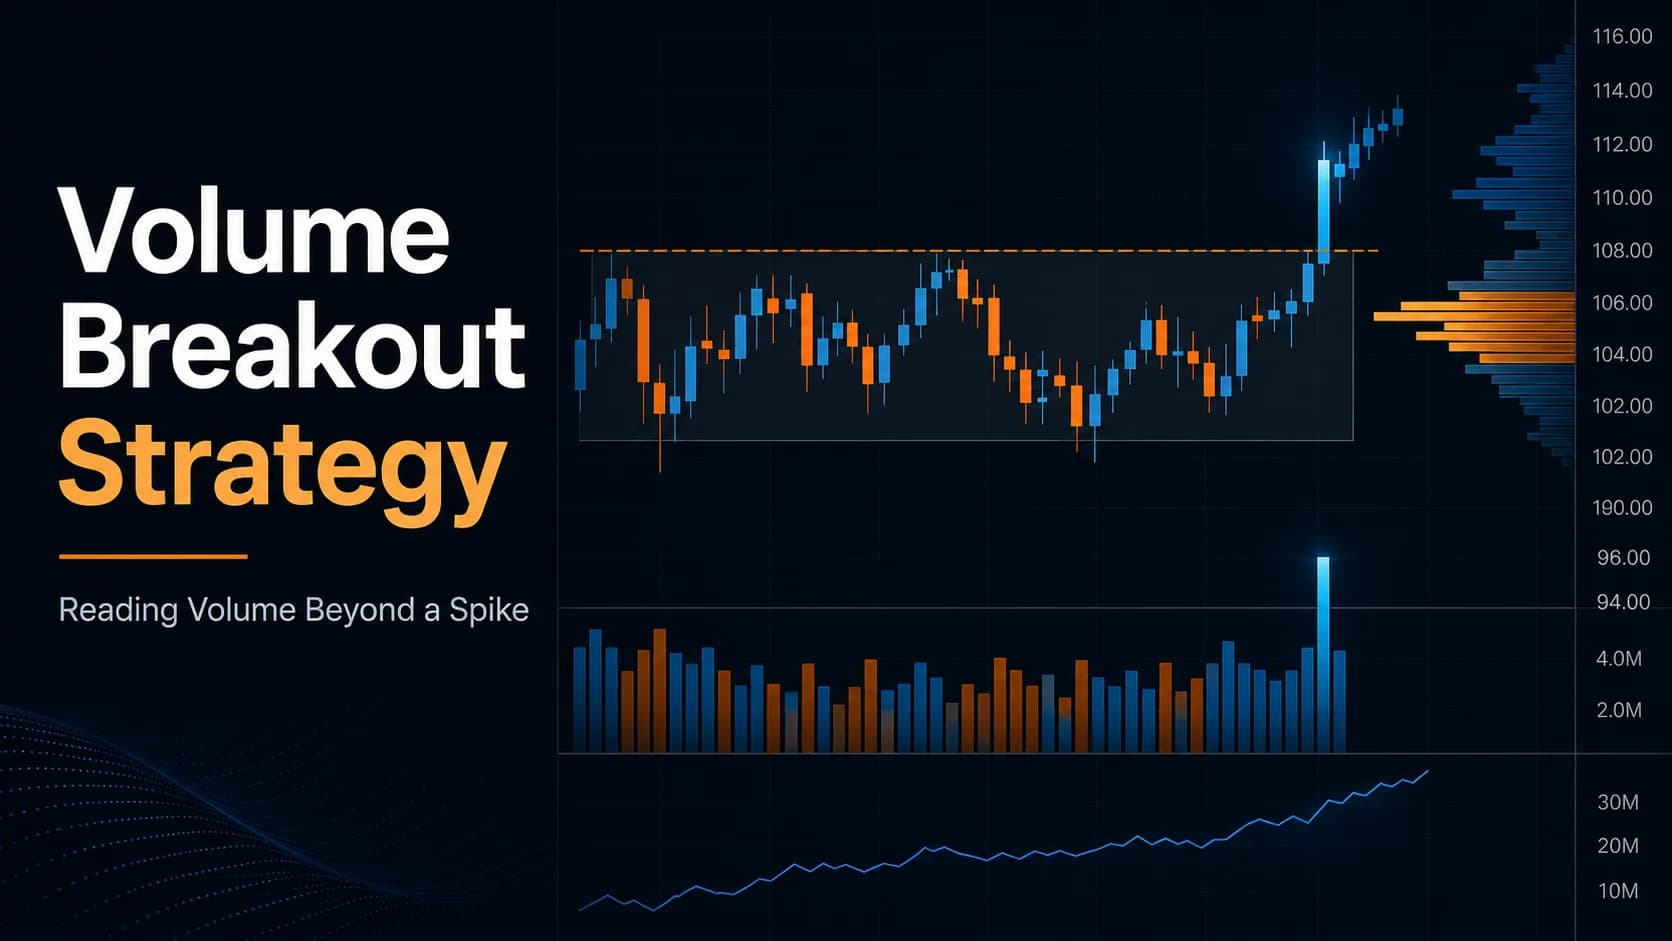
The Volume Breakout Strategy: Why Volume Confirms Every Real Break
A volume spike alone isn't enough. This guide covers reading volume pace, On-Balance Volume, and volume profile structure to confirm a genuine breakout.
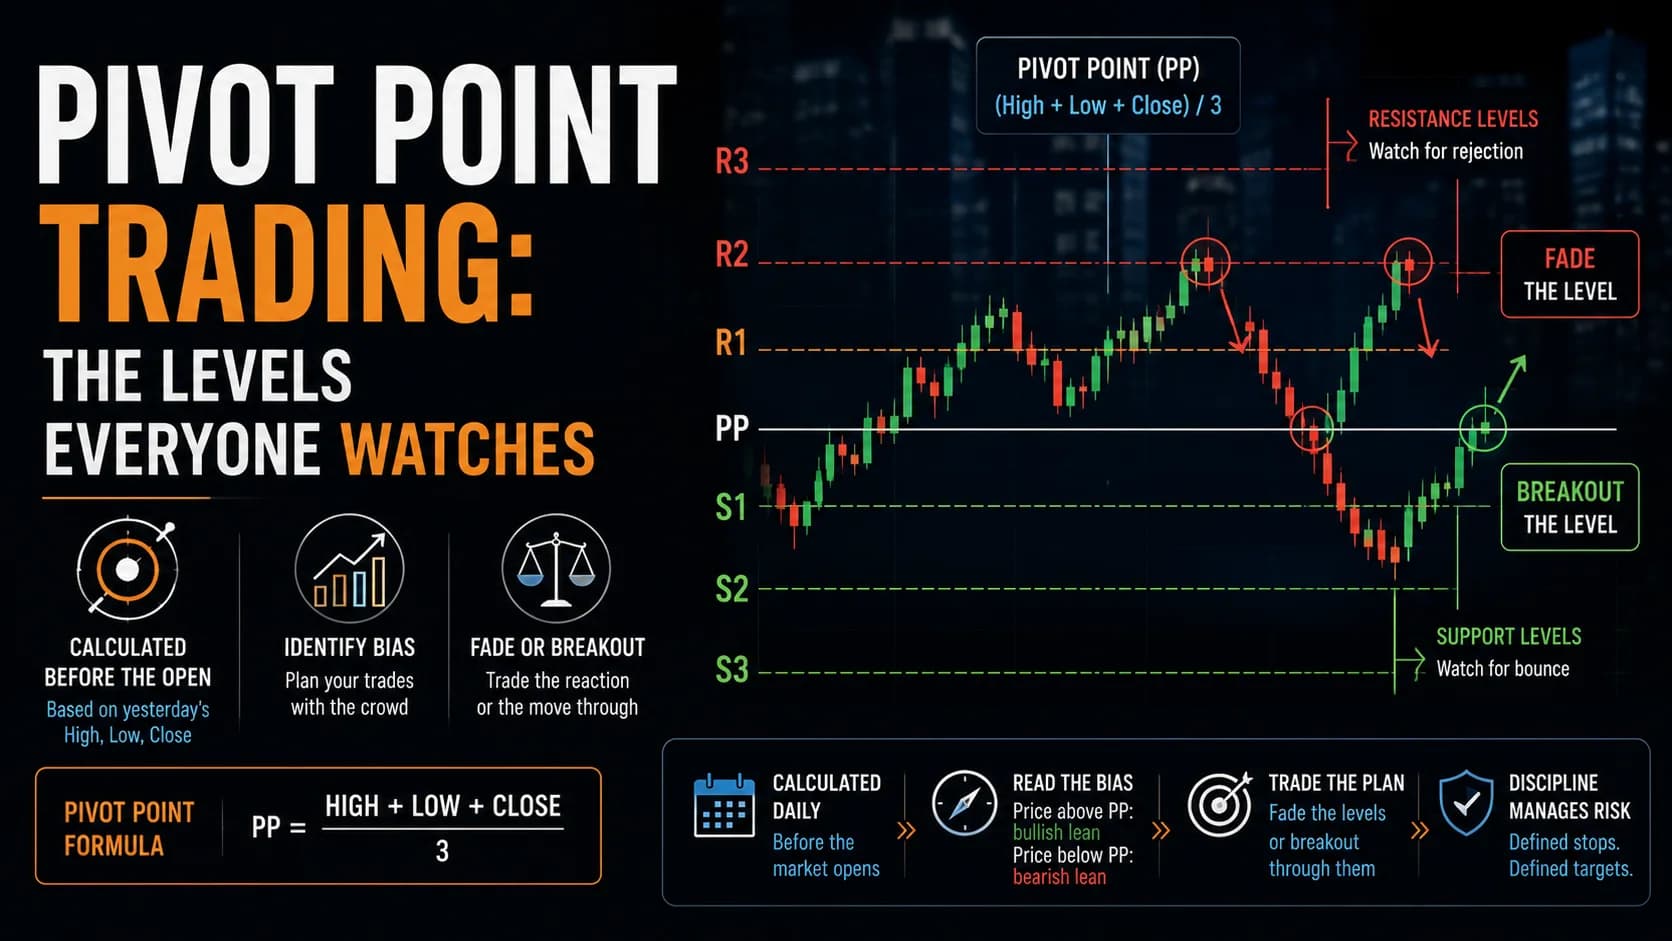
Pivot Point Day Trading Strategy: Floor Trader Levels Explained
Pivot points are calculated before the open, not drawn on a chart. This guide covers the formula, fading pivot levels, and trading breakouts through them.
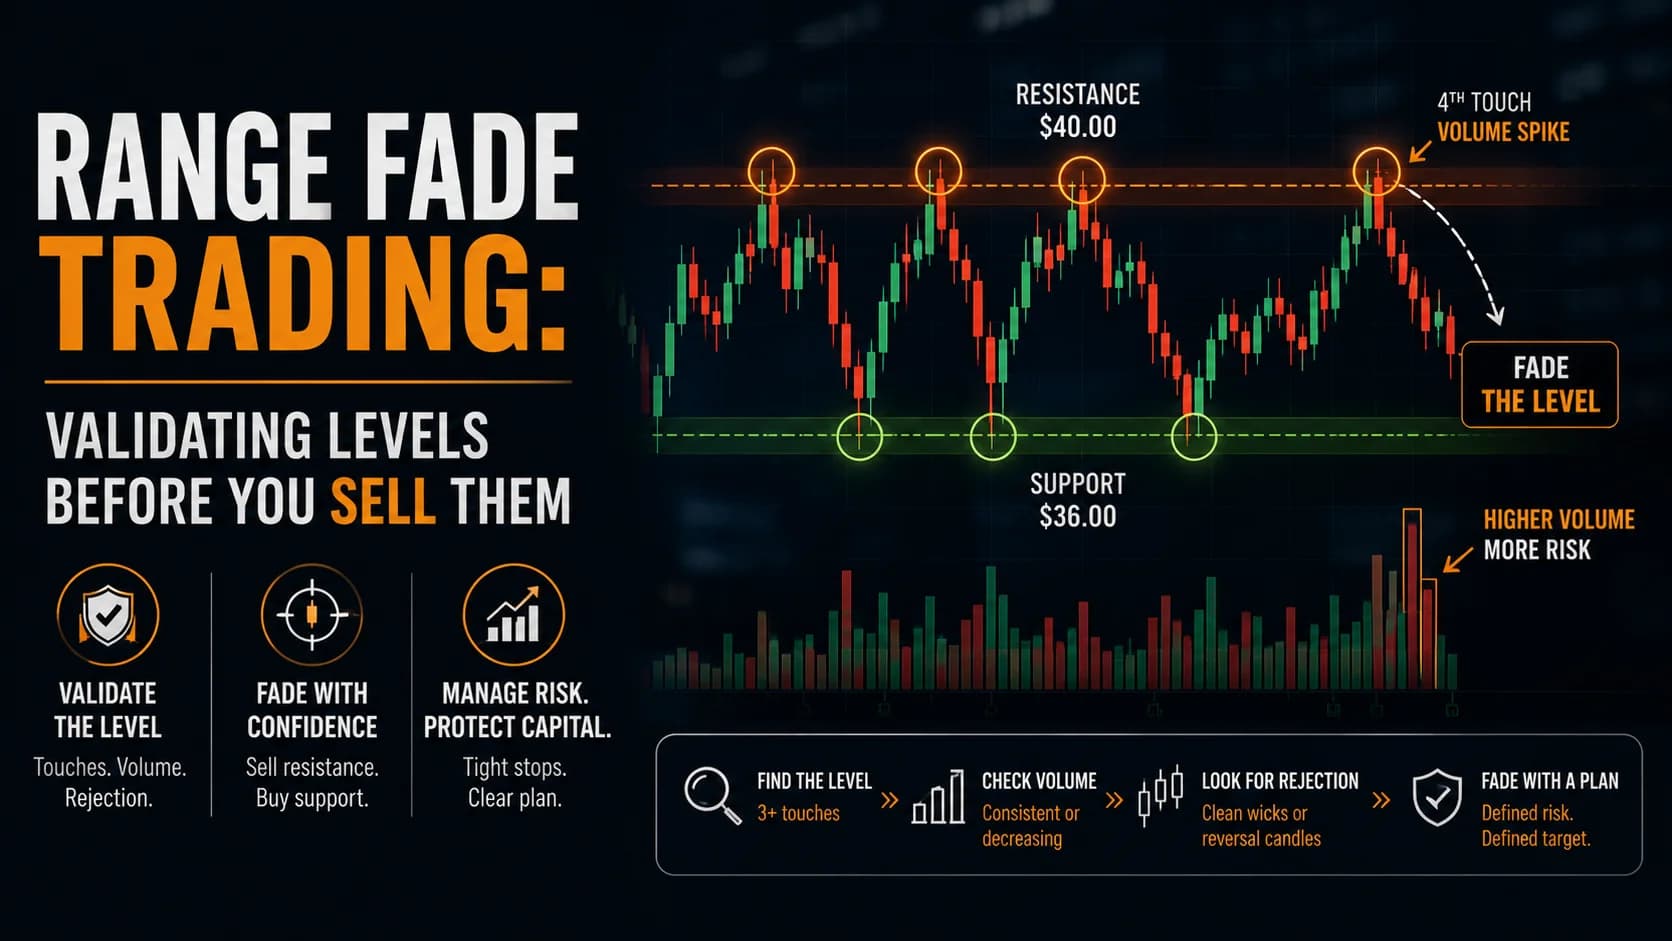
The Range Fade Strategy: How to Sell Resistance and Buy Support
Not every support or resistance line is worth fading. This guide covers validating a level, execution mechanics, and why more touches can mean more risk.
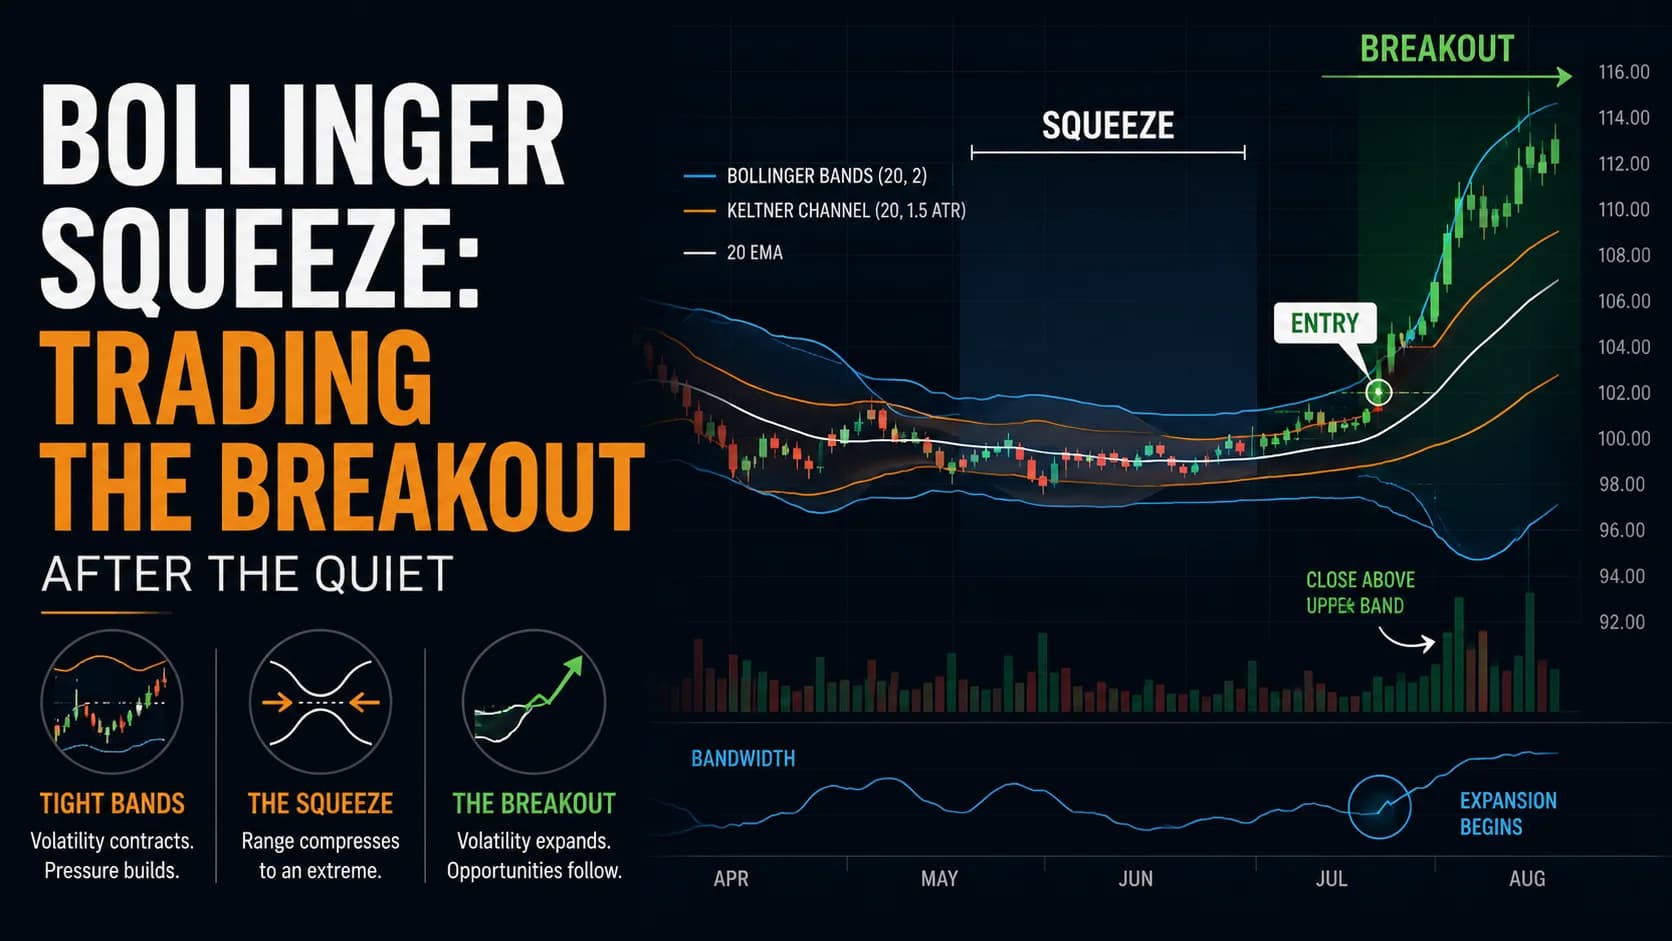
The Bollinger Band Squeeze Strategy: Trading Volatility Compression
Tight Bollinger Bands signal a coiled market. This guide covers measuring real squeeze compression, trading the breakout direction, and avoiding false starts.

Why Index Rebalancing Days Break Volume Records—and Why Chasing the Addition Still Fails
Index rebalancing forces price-insensitive buying and selling into the closing auction, sometimes 40%+ of a stock's daily volume. The mechanics, the September 2026 dates, and why forced buying doesn't guarantee a price pop.

IBM Just Gave the AI Capex Story a Number—Here's How to Test If It's Real
IBM's Q2 2026 warning tied a $660M revenue miss to clients shifting budget toward AI hardware. Five weeks and a full round of Big Tech earnings later, here's what the five-point test actually showed.
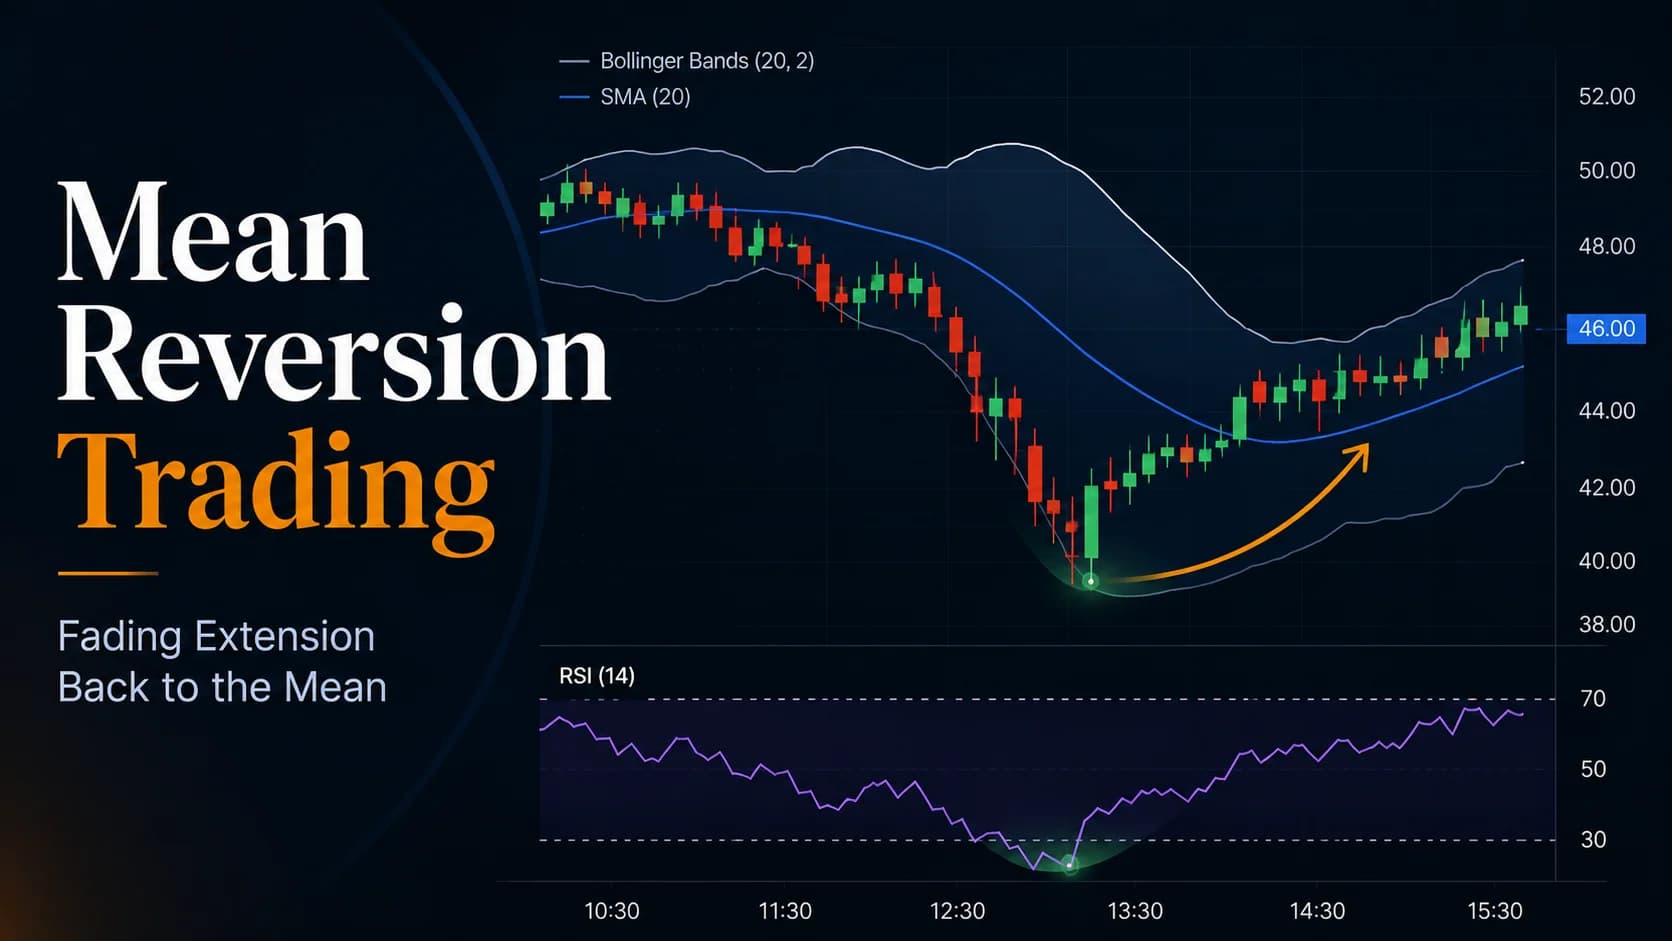
The Mean Reversion Trading Strategy: A Complete Day Trading Guide
Stocks stretch too far from their average, then snap back. This guide covers measuring real extension with Bollinger Bands and RSI, and when reversion fails.

Cboe Premarket Options Trading Is Delayed: What Changed and What to Watch For
Cboe's C1 exchange postponed its planned 7:30-9:25 a.m. ET premarket options session past its August 17, 2026 target, with the new date still TBD. Here's what changed, why it matters, and what the eventual launch will look like.