Every other SupportSupport is a price level where buying pressure has historically overcome selling pressure, causing price to stop declining and reverse — it's the floor where demand enters the market, and when it holds, it's a potential long entry; when it Read definition → and ResistanceResistance is a price level where selling pressure has historically overcome buying pressure, causing price to stall, reverse, or consolidate — it's the ceiling where supply enters the market and where breakout traders watch for either a coRead definition → level in this hub gets built the same way — by watching a chart, waiting for price to test a boundary, and judging whether the rejection looks real. Pivot points work differently. They're calculated from a formula before the market even opens, using nothing but yesterday's high, low, and close. No chart-watching required, no judgment call about whether a level is "valid" — just arithmetic, done in advance.
That mechanical simplicity is exactly why pivot points matter. Because the formula is public, simple, and decades old, an enormous number of traders, market makers, and algorithmic systems are calculating and watching the same handful of numbers on any given day. A level that thousands of participants are independently tracking has a different kind of significance than one a single trader spotted on their own chart.
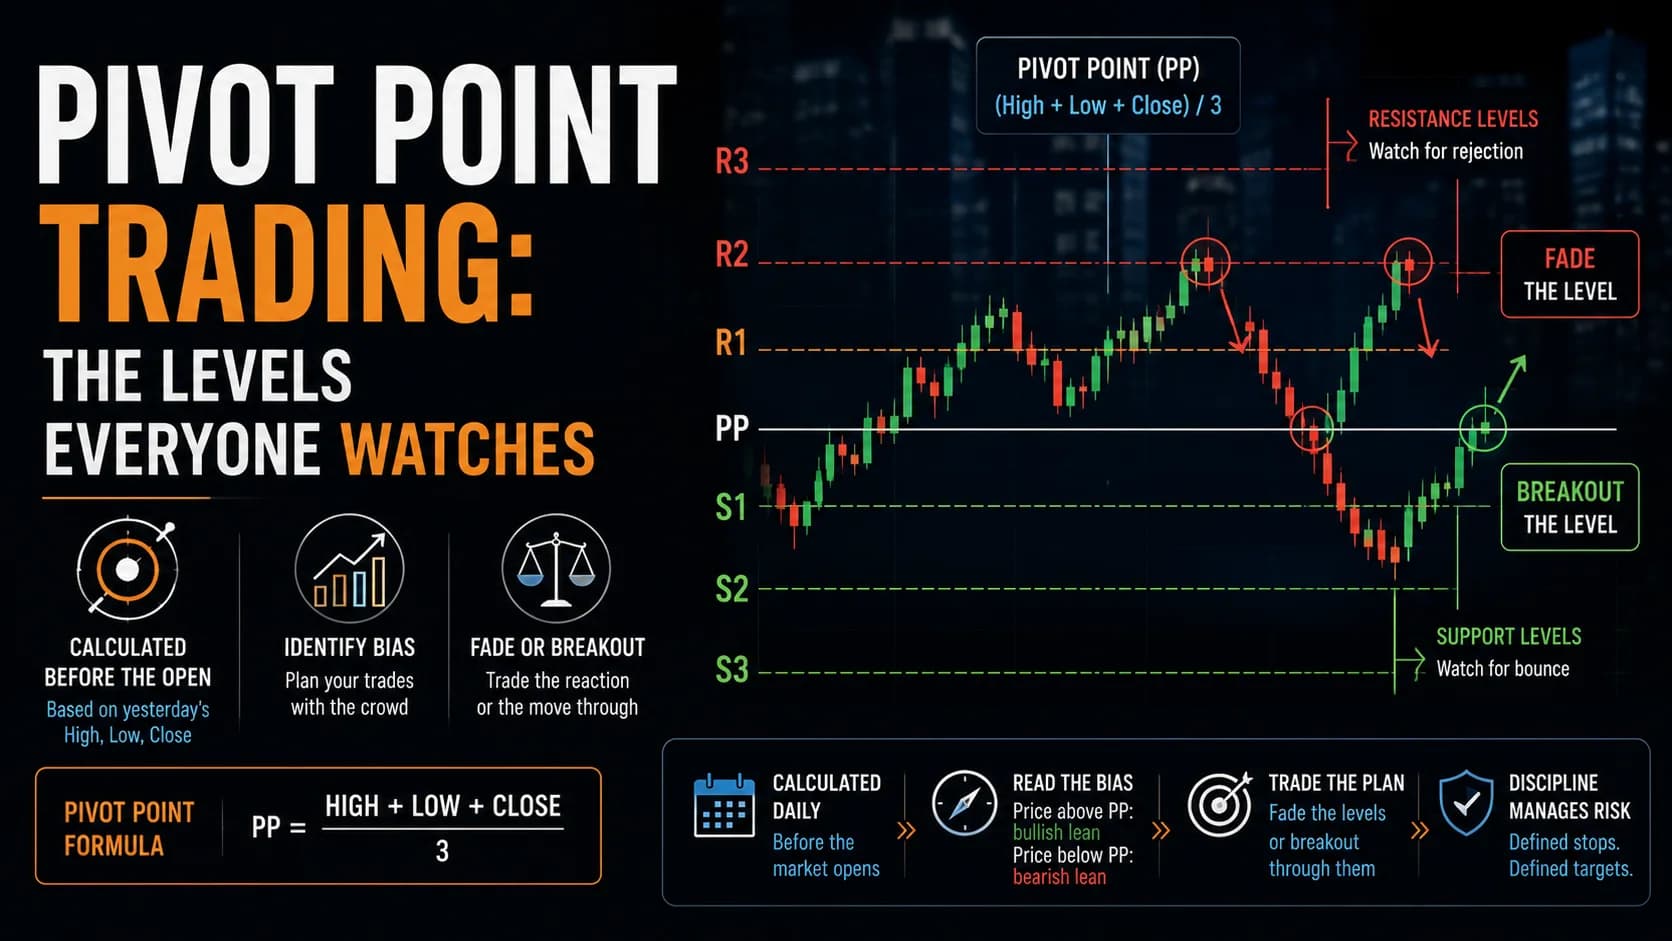
What is pivot point trading? Pivot point trading uses a set of price levels — a central pivot point plus several support and resistance levels above and below it — calculated from the prior session's high, low, and close using a fixed formula. Traders use these levels to gauge the day's directional bias, fade the outer levels when they hold, or trade a BreakoutA breakout is when price moves decisively beyond a defined level — a resistance zone, a consolidation boundary, a chart pattern boundary, or a prior high — suggesting that the previous supply at that level has been overcome.Read definition → when price pushes cleanly through them.
Where Pivot Points Came From, and Why the Formula Still Matters
Pivot points originated on the trading floors of Chicago's futures exchanges, well before electronic charting existed. Floor traders needed a fast way to estimate where a session's support and resistance might sit, and averaging the prior session's high, low, and close gave them a level they could compute by hand between trades. Larry Williams helped popularize the specific formula still in common use today by publishing it in his 1979 book How I Made One Million Dollars Last Year Trading Commodities.
The formula itself, known as the Standard (or Classic) pivot calculation, is:
- Pivot Point (PP) = (High + Low + Close) / 3
- Resistance 1 (R1) = (PP × 2) − Low
- Support 1 (S1) = (PP × 2) − High
- Resistance 2 (R2) = PP + (High − Low)
- Support 2 (S2) = PP − (High − Low)
- Resistance 3 (R3) = High + 2 × (PP − Low)
- Support 3 (S3) = Low − 2 × (High − PP)
High, Low, and Close all refer to the prior trading session — for a daily chart, that's the previous day's data. The levels are recalculated fresh at the start of each new session and remain fixed for the entire day.
How This Differs From Fading a Level You Spotted on a Chart
The Validated-Level Fade covered elsewhere in this hub depends on organic price history — a level earns the right to be traded by being tested and rejected multiple times, with VolumeVolume is the total number of shares (or contracts) traded during a given time period — it's the primary confirmation tool for all price action, because a price move accompanied by high volume indicates genuine market participation, while tRead definition → and timing checked at each touch. Pivot points skip that entire validation process. A pivot level's significance doesn't come from how many times price has bounced off it today; it comes from the fact that the number was known and being watched by a large number of participants before the session even started.
This has a practical consequence: a pivot level can matter on its very first test of the day, in a way an organically-drawn support line generally can't. It also means the two approaches can be combined — a pivot level that happens to line up closely with a level that's also shown organic rejection history carries more weight than either one would carry alone.
Reading the Day's Bias Before Trading Any Level
Before trading any individual pivot level, where price opens relative to the central Pivot Point sets a working bias for the session. An open above PP is generally read as a bullish lean, favoring long setups at support levels over short setups at resistance; an open below PP suggests the opposite. This bias is a starting lean, not a rule — it should be revised over the course of the session if price action contradicts it, not treated as fixed once set at the open.
The Pivot Level Fade and Breakout: A Setup Specification
- Component
- Market Conditions Required
- Rule
- Standard pivots calculated from the prior session's high, low, and close; today's open within roughly one pivot-level spacing of PP (a large gap beyond R2/S2 at the open reduces the levels' relevance for this session)
- Component
- Time of Day
- Rule
- 9:45 AM–3:30 PM ET — the first 15 minutes are excluded to let price establish an initial relationship to PP before trading any level
- Component
- Instrument Selection
- Rule
- Liquid large-cap stocks, major ETFs, or index futures; pivot levels tend to carry the most weight on instruments with heavy institutional and algorithmic participation, since the self-fulfilling effect depends on wide, shared usage
- Component
- Entry Trigger (Fade)
- Rule
- First touch of R1 or S1 with a rejection candle on the 5-minute chart, taken in the direction of the day's opening bias when possible
- Component
- Entry Trigger (Breakout)
- Rule
- A confirmed close beyond R1 or S1 on volume at least 1.5x the recent average, targeting the next pivot level out
- Component
- Stop Loss
- Rule
- For a fade: just beyond the tested level, sized to a fixed ATR buffer. For a breakout: just back inside the level that was broken
- Component
- Initial Profit Target
- Rule
- For a fade: back to the central Pivot Point. For a breakout: the next pivot level in the direction of the move (R1 to R2, S1 to S2)
- Component
- Invalidation Criteria
- Rule
- Price opens with a gap well beyond R2 or S2 — treat the standard levels as less reliable for the session and wait for the market to establish new intraday reference points instead
| Component | Rule |
|---|---|
| Market Conditions Required | Standard pivots calculated from the prior session's high, low, and close; today's open within roughly one pivot-level spacing of PP (a large gap beyond R2/S2 at the open reduces the levels' relevance for this session) |
| Time of Day | 9:45 AM–3:30 PM ET — the first 15 minutes are excluded to let price establish an initial relationship to PP before trading any level |
| Instrument Selection | Liquid large-cap stocks, major ETFs, or index futures; pivot levels tend to carry the most weight on instruments with heavy institutional and algorithmic participation, since the self-fulfilling effect depends on wide, shared usage |
| Entry Trigger (Fade) | First touch of R1 or S1 with a rejection candle on the 5-minute chart, taken in the direction of the day's opening bias when possible |
| Entry Trigger (Breakout) | A confirmed close beyond R1 or S1 on volume at least 1.5x the recent average, targeting the next pivot level out |
| Stop Loss | For a fade: just beyond the tested level, sized to a fixed ATR buffer. For a breakout: just back inside the level that was broken |
| Initial Profit Target | For a fade: back to the central Pivot Point. For a breakout: the next pivot level in the direction of the move (R1 to R2, S1 to S2) |
| Invalidation Criteria | Price opens with a gap well beyond R2 or S2 — treat the standard levels as less reliable for the session and wait for the market to establish new intraday reference points instead |
Both the fade and the breakout use the same set of levels for opposite trades, which makes the entry trigger the deciding factor rather than the level itself. A rejection candle at R1 supports the fade; a clean, volume-confirmed close through R1 supports the breakout. Trading a level without waiting for one of these two confirmations is the most common way this setup gets misapplied.
A Walk-Through: Trading Both Sides of R1
Picture a large-cap stock with a prior session high of $84.20, low of $81.60, and close of $83.00. The Pivot Point comes out to $82.93. R1 works out to $84.27, and S1 to $81.67.
The stock opens at $83.40 — modestly above PP, setting a mild bullish bias for the session. By late morning, it grinds up to $84.25, right at R1. A 5-minute candle prints a rejection wick to $84.35 before closing back at $84.05 — the fade trigger. A short position enters near $84.10, with a stop at $84.50 and a target back at the Pivot Point near $82.93. Over the next hour, the stock drifts back down and the target fills.
Now picture a different session on the same stock. It opens near $84.30 — already above R1 — and by mid-morning, it closes a 5-minute bar at $84.55 on volume running 1.8x the recent average, clearing R1 cleanly rather than rejecting it. That's the breakout trigger instead of the fade: a long position enters near $84.55, with a stop back inside R1 around $84.20, targeting R2 at $85.53.
The same level, R1, supported two entirely different trades on two different days — the deciding factor in both cases was which confirmation actually showed up, not an assumption about which one "should" happen at that level.
Where Pivot Point Trading Breaks Down
The clearest failure is a session that gaps well beyond the calculated RangeA range (or trading range) is a price zone where a stock oscillates between a defined support floor and resistance ceiling without making meaningful new highs or lows — price is consolidating rather than trending, and the dominant trade is Read definition → — an open above R2 or below S2 means the prior session's high and low, which the entire formula is built from, are no longer a meaningful reference for where today's price is likely to pause. Trading the standard levels as though nothing has changed on a day like this is a common mistake, particularly right after a major overnight catalyst.
It also fails when a trader ignores the entry-trigger distinction and trades every touch of a level as a fade by default. Because the same levels support both fades and breakouts, treating R1 or S1 as an automatic reversal point — without waiting for the rejection candle or the volume-confirmed break — means taking the wrong side of the trade roughly as often as the right one.
And the self-fulfilling effect that makes pivot points work in the first place is also the source of a specific risk: because so many participants watch the same levels, a level can attract enough competing orders that price whipsaws around it before settling into a clear direction. A little patience for the entry trigger to actually confirm — rather than acting on the first touch — reduces exposure to this specific kind of noise.
Other Pivot Point Formulas Worth Knowing
The Standard formula covered above is the most widely used, but several variants exist, and it's worth knowing when each is more common. Fibonacci pivot points use the same base Pivot Point but derive the surrounding levels from Fibonacci ratios (38.2%, 61.8%, 100%) applied to the prior session's range rather than the fixed multiples in the Standard formula. Woodie's pivot points weight the closing price more heavily in the base calculation. Camarilla pivot points use a different formula entirely, producing tighter levels intended for reversal trades closer to the prior close.
None of these variants is objectively superior — they simply produce different level spacing, and the choice often comes down to which formula a trader's specific market and instrument seem to respect most consistently. Starting with the Standard formula and only exploring alternatives after genuinely testing it is the more disciplined path than switching formulas after a handful of losing trades.
DeMark pivot points work differently from the others in one important respect: rather than always calculating the same set of symmetric levels, the formula changes depending on the relationship between the prior session's open and close. This produces just a single support and a single resistance level rather than the fuller Standard set, and it's built specifically around that conditional logic rather than a fixed averaging formula. Traders drawn to a simpler, single-level approach sometimes prefer DeMark for exactly this reason, though it sacrifices the wider map of levels the Standard formula provides.
Where Pivot Points Fit a Complete Trading Plan
Pivot points work best as a pre-market preparation tool rather than a standalone system — calculating the day's levels before the open, noting where they sit relative to any organically-validated levels from prior sessions, and forming an initial bias are all steps that belong in pre-market routine rather than in the middle of a live session. The distinction from the Validated-Level Fade is worth remembering: pivot levels are known in advance by formula, while validated chart levels earn their significance through observed rejection history — the strongest setups often occur where both approaches happen to agree on the same price.
For anyone who needs the foundational concepts of support and resistance refreshed before layering pivot-specific formulas on top, Support and Resistance Basics covers that ground. For the broader library of range and reversal setups pivot points complement, the Strategies Hub organizes the full collection by market condition.
Frequently Asked Questions About Pivot Point Trading
How is a pivot point level different from a support or resistance level identified from a chart?
Because the pivot formula is public and widely used, its significance comes from the sheer number of participants tracking the same calculated number, not from any rejection history at that specific price today. A chart-based level, by contrast, only becomes meaningful after price has actually tested and respected it.
Key Takeaway: Pivot levels are pre-calculated and shared across the market; chart-based levels are discovered and validated individually over time.
Why do pivot points work as well as they seem to, given they're just a simple average?
This is different from claiming the formula has some special predictive property beyond its adoption. A level matters more because many traders and algorithmic systems are positioned around it than because of anything unique about the arithmetic itself.
Key Takeaway: Pivot points work partly because they're popular, not purely because of the math behind them.
How should the day's opening bias actually be used once trading begins?
A bullish open can turn bearish by midday if price reverses back below the Pivot Point, and continuing to favor long setups purely because of the open ignores that shift. The bias should be checked continuously against current price action, not set once and held all day.
Key Takeaway: Update the day's bias as price action develops rather than anchoring to the opening relationship to PP all session.
Why do both a fade and a breakout use the exact same pivot levels?
Since the same R1 or S1 level can support either outcome, trading the level without waiting for a rejection candle (favoring the fade) or a volume-confirmed close through it (favoring the breakout) means guessing which outcome will occur rather than reacting to what's actually happening.
Key Takeaway: Wait for the specific fade or breakout confirmation before entering — the level alone doesn't indicate which way it will resolve.
What happens to pivot point reliability on a day with a large overnight gap?
On these sessions, the market has already moved beyond what yesterday's range would suggest is likely, and clinging to the pre-calculated levels as though nothing changed ignores that the new session's actual volatility has outpaced the formula's assumptions.
Key Takeaway: Treat a large gap beyond the outer pivot levels as a signal to look for new intraday reference points rather than trusting the standard calculation.
Which pivot point formula — Standard, Fibonacci, Woodie's, or Camarilla — should be used?
Since none of the variants is objectively superior, and the self-fulfilling effect depends partly on widespread adoption, the Standard formula's popularity is itself a point in its favor for most instruments and traders starting out with this approach.
Key Takeaway: Default to the Standard formula, and only switch to an alternative after real testing shows a specific instrument responds better to it.
Does pivot point trading work the same way on stocks as it does on futures and forex?
A widely traded index future or major currency pair has more participants calculating and watching the same pivot levels than a thinly followed small-cap stock does, which is why the effect tends to be more pronounced on the former.
Key Takeaway: Expect pivot levels to carry more weight on heavily-traded futures, forex, and large-cap instruments than on thinly followed names.
How does combining a pivot level with a chart-validated level change the setup?
This kind of confluence brings together two independent sources of significance — one from widespread formulaic tracking, one from observed price behavior — which is a stronger case for a level mattering than relying on just one of the two.
Key Takeaway: Treat agreement between a pivot level and an organically-validated chart level as a stronger signal than either approach used in isolation.
Why are the first 15 minutes of the session excluded from this setup?
Acting on a pivot level touch in the first few minutes of the session, before the day's bias and initial price behavior have had a chance to develop, increases the odds of reacting to opening volatility rather than a meaningful test of the level itself.
Key Takeaway: Let the first 15 minutes establish context before treating any pivot level touch as a genuine setup.
What timeframe is pivot point trading best suited for?
Applying the same daily-calculated levels to a much longer timeframe chart doesn't provide useful additional information, since the levels remain fixed for the entire session regardless of which intraday timeframe is being viewed.
Key Takeaway: Use pivot points on intraday charts where the levels can meaningfully interact with the session's price action, not on daily or higher timeframes.
Disclaimer
Article Sources
- Pivot Points — StockCharts ChartSchool - documents the Standard, Fibonacci, and Demark pivot point formulas and their floor-trading origin.chartschool.stockcharts.com
- Williams, L. (1979). How I Made One Million Dollars Last Year Trading Commodities. Windsor Books. — the book widely credited with popularizing the Standard pivot point formula among retail and professional traders.
- Pivot Point Trading: Your Complete Guide to Market Success — ChartsWatcher - covers the floor-trading history and practical application of the Standard pivot calculation.chartswatcher.com