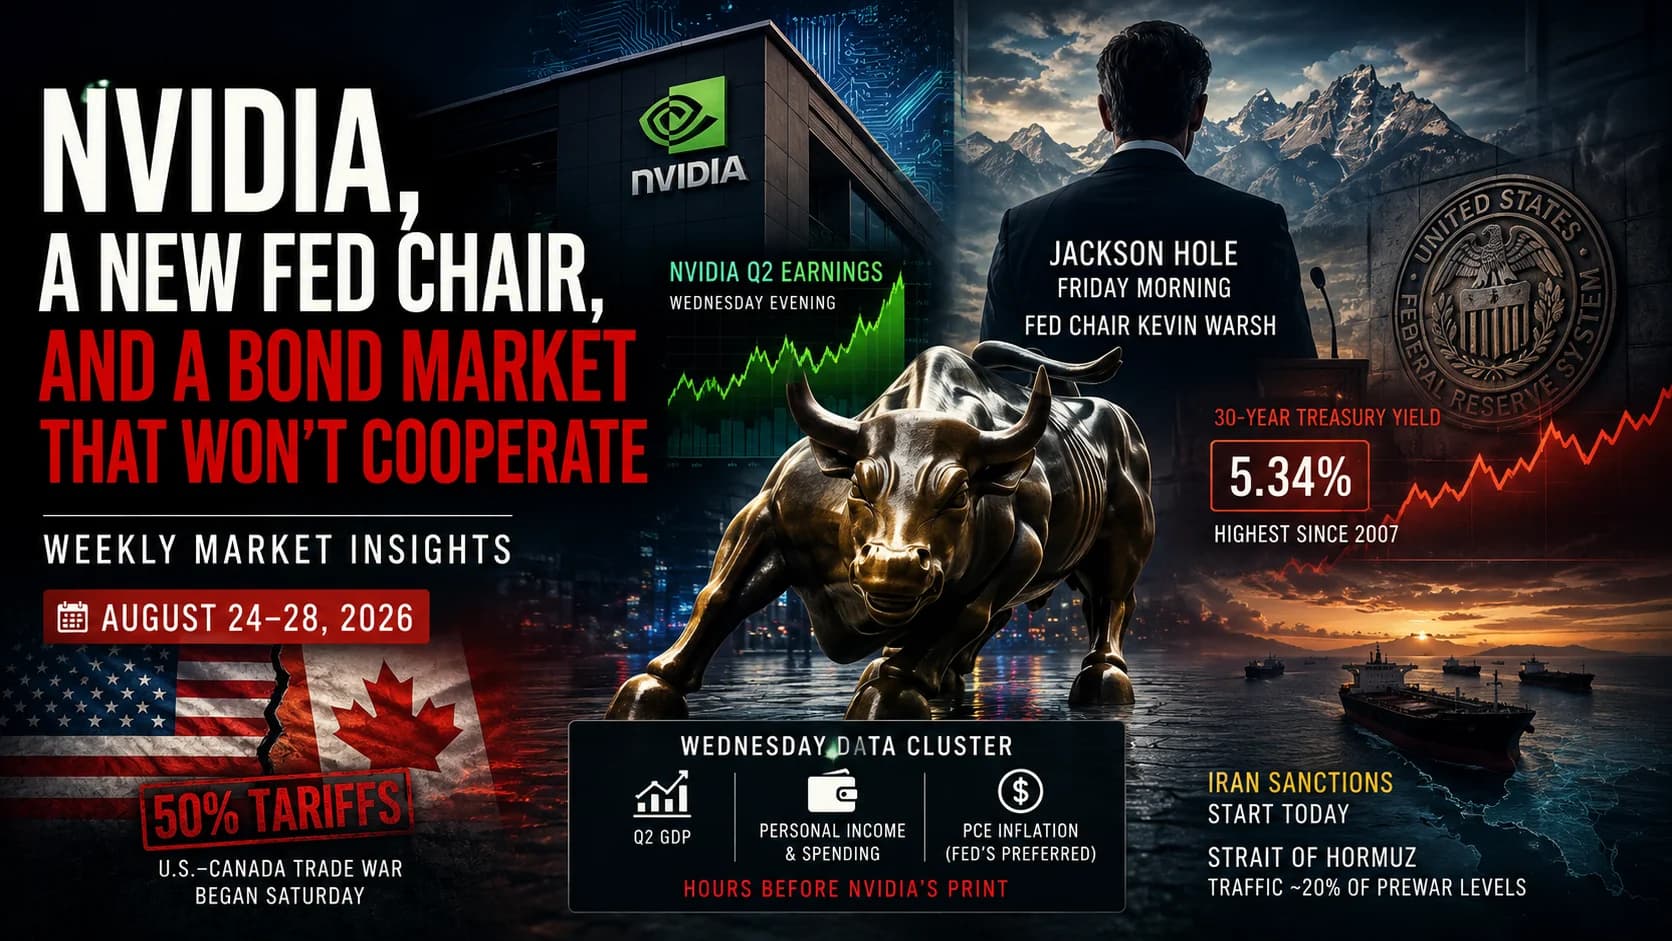


Nvidia reports Tuesday with an interim CEO, five days after Jensen Huang resigned, while a 5.15% 10-year yield, a wave of retail EarningsAn earnings report is the quarterly financial disclosure a public company files with the SEC, revealing revenue, earnings per share (EPS), profit margins, and forward guidance — it's the most significant regular catalyst for individual stocRead definition → and Anthropic's expected Nasdaq debut crowd the same four sessions.
As of November 15, 2026, 11:30 p.m. ET. Stock prices are Friday, November 13 closes unless otherwise noted. Options implied moves are as of November 13. All event times are Eastern.
Week at a glance
November 13, 2026 regular-session closes; changes are weekly, November 6 to November 13The VIXThe CBOE Volatility Index — a real-time measure of the market's expectation for 30-day volatility in the S&P 500, derived from the prices of S&P 500 options. Widely called the "fear gauge," a rising VIX indicates increasing uncertainty and Read definition → fell 24.7% on the week to 19.30, and the 10-year Treasury yield rose 29 basis points to 5.15%.
In 30 Seconds
- Nvidia ($NVDA) reports fiscal third-quarter results Tuesday, November 17, at about 4:20 p.m. ET, its first report since Jensen Huang resigned as CEO on November 12 and CFO Colette Kress became interim CEO. Options price a move of about ±8.6%, or roughly $14 either way from Friday's $162.85 close.
- The indexes rose last week while Nvidia fell 12.7% and the 10-year Treasury yield climbed 29 basis points to 5.15% after October core CPIThe Consumer Price Index (CPI) is a monthly U.S. government report measuring the average change in prices paid by consumers for goods and services — it's the most closely watched inflation indicator in the market.Read definition → rose 0.3% against a 0.2% forecast.
- Retail earnings arrive in one burst: Home Depot ($HD) Tuesday, Target ($TGT), Lowe's ($LOW) and TJX ($TJX) Wednesday, and Walmart ($WMT) Thursday, all before the open, with October retail sales Tuesday at 8:30 a.m.
- Anthropic expects to price its IPO on Wednesday, November 18, and begin trading on Nasdaq as ANT on Thursday, November 19, subject to regulatory clearance. The amended filing offers 825 million shares at $70 to $78.
- FOMCThe Federal Open Market Committee (FOMC) is the Federal Reserve committee that sets U.S. monetary policy — most importantly, the target federal funds rate — at eight scheduled meetings per year.Read definition → minutes land Wednesday at 2:00 p.m., with fed funds futures fully pricing a December Rate HikeA rate hike is when the Federal Reserve raises its benchmark federal funds rate target, increasing borrowing costs across the economy to slow inflation — it's generally considered bearish for stocks in the near term because it reduces liquiRead definition → after the CPI report.
- Strategy ($MSTR) leaves the MSCI USA Index at the November 30 close, so index-fund selling is a known overhang after bitcoin fell below $65,000 over the weekend.
Priority Stocks at a Glance
Four names on this list have a report on the calendar, so you know the hour their risk arrives: Nvidia, Palo Alto Networks, Target and Walmart. The other five are moving on unscheduled flows (a CEO exit, a post-earnings rebound, an index deletion, a breakout to a record). Every number below comes from Nasdaq market data through Friday's close: ATR is the 14-day average true range, RVOL is last week's average volume against the prior 20 sessions, and days to cover is short interest divided by average daily volume.
Priority stocks at a glance
As of Nov 15, 2026, 11:30 p.m. ET; prices through Nov 13Q3 FY2027 results; first report after CEO exit
Tue, Nov 17, after closeLevel: Resistance $179.92 / Support $148.80
Week -12.7%, RVOL 4.0x, ATR $11.00 (6.8%), implied move about ±8.6% ($14.05), days to cover 2.8
Rotation beneficiary as Nvidia slid
All weekLevel: Resistance $594.00 / Support $520.01
Week +18.9%, RVOL 1.8x, ATR $47.88 (9.0%), $14.0B traded daily, 19% below 52-week high
Post-earnings rebound after record Q3 revenue
All weekLevel: Resistance $120.44 / Support $101.18
Week +21.2%, RVOL 1.4x, ATR $11.50 (10.6%), $1.3B traded daily, 72% below 52-week high
Fading a 24.7% post-earnings pop
All weekLevel: Resistance $62.02 / Support $49.24
Week +14.5%, RVOL 1.4x, ATR $6.44 (12.1%), $4.0B traded daily, days to cover 1.1
Q1 FY2027 results; webcast 4:30 p.m.
Wed, Nov 18, after closeLevel: Resistance $341.80 / Support $314.10
Implied move about ±11.1% ($35.83), ATR $20.06 (6.2%), 25% below 52-week high, days to cover 3.5
Q3 results; call 8:00 a.m.
Wed, Nov 18, before openLevel: Resistance $167.60 / Support $157.92
Implied move about ±9.0% ($14.47), ATR $5.47 (3.4%), 5% below 52-week high
Q3 FY2027 results before the open
Thu, Nov 19, before openLevel: Resistance $131.82 / Support $123.58
Implied move about ±6.2% ($8.00), ATR $3.02 (2.4%), days to cover 3.8
MSCI USA Index deletion at Nov 30 close
All weekLevel: Resistance $129.37 / Support $108.25
Week -13.4%, ATR $8.46 (7.6%), $2.6B traded daily, 61% below 52-week high
Record high while chips sold off
All weekLevel: Resistance $360.83 / Support $344.78
Week +4.1%, ATR $9.46 (2.7%), $16.7B traded daily, RVOL 0.8x (light volume)
Week at a Glance: Economic and Earnings Calendar
Keep the release time and the call time apart. Nvidia, Palo Alto Networks, Intuit and Ross Stores all report after the close, so the first reaction happens in thin after-hours trading and the call can reverse it before the next open. The retailers report before the bell, which means the reaction is already priced by 9:30 a.m.
Weekly Economic Calendar
All times ETMonday, November 16
Light macro day; the session trades on weekend Nvidia and crypto headlines
Tuesday, November 17
First read on big-ticket housing spending with mortgage rates tied to a 5%+ 10-year
September rose 0.8%; a hot print adds to December hike pricing
The AI trade's anchor reports with an interim CEO
Guidance and any comment on the leadership transition
Wednesday, November 18
Three views of the consumer in one premarket; Lowe's lists its date as tentative
How many officials want more than one more hike
Options price about an 11% move
Sets the opening reference for Thursday's debut
Thursday, November 19
The biggest single read on U.S. shoppers before Black Friday
Labor data the Fed watches between payroll reports
A $61 billion offering can pull money from other AI names
Software, off-price retail and test equipment reads
Friday, November 20
Large open interest near round strikes can pin or release prices into the close
Key earnings reports this week
As of November 15, 2026| Report | Est. EPS | Implied move |
|---|---|---|
XP XP Inc.Mon, Nov 16 · after close | $0.53 | ±8.1% |
HD Home DepotTue, Nov 17 · before open | $3.87 | ±5.2% |
DIS Walt DisneyTue, Nov 17 · before open | $1.67 | ±6.0% |
NVDA NvidiaTue, Nov 17 · after close | $2.49 | ±8.6% |
TGT TargetWed, Nov 18 · before open | $2.03 | ±9.0% |
LOW Lowe'sWed, Nov 18 · before open | $2.86 | ±5.4% |
TJX TJX CompaniesWed, Nov 18 · before open | $1.33 | ±5.9% |
PANW Palo Alto NetworksWed, Nov 18 · after close | $0.96 to $0.98 (guide) | ±11.1% |
P EverpureWed, Nov 18 · after close | $0.27 | ±16.3% |
WMT WalmartThu, Nov 19 · before open | $0.64 | ±6.2% |
PDD PDD HoldingsThu, Nov 19 · before open | $2.61 | ±7.2% |
INTU IntuitThu, Nov 19 · after close | $2.47 | ±9.1% |
ROST Ross StoresThu, Nov 19 · after close | $1.82 | ±7.4% |
KEYS Keysight TechnologiesThu, Nov 19 · after close | $3.09 | ±9.7% |
EPS estimates are Nasdaq consensus figures except Palo Alto Networks, where the table shows the company's own guidance because the published consensus figures disagree. Implied moves are the at-the-money straddle midpoint for the first expiration after each report, so read each one as "about." Nvidia, Palo Alto Networks, Home Depot, Target, TJX and Walmart dates are company-confirmed; the rest come from Nasdaq's calendar and are worth a check on each company's investor page before you plan around them.
Live Risks and Unscheduled Catalysts
Nvidia's story did not end with Thursday's resignation. Three House committee chairs asked Huang for a closed-door briefing on November 18, and House Foreign Affairs Chair Brian Mast told reporters Huang is willing to testify as soon as this week. The board's independent investigation has no published timeline, so new findings can land on any day, including earnings day.
The other open risk is rates. The 10-year closed at 5.15% on Friday, and the 30-year at 5.47%, per Treasury. A hot retail sales print Tuesday or hawkish minutes Wednesday can push long yields higher in the middle of the earnings week, and higher yields hit the most expensive growth stocks first. Oil sits near $88 a barrel and bitcoin slid below $65,000 over the weekend, so both crude and crypto headlines can still move whole sectors at the open.
Market Setup: Indices Rise as Nvidia Breaks and the 10-Year Hits 5.15%
The S&P 500 gained 2.5% last week to 7,561.67, but that headline hides how uneven the week was. Monday's 2.3% jump did most of the work, and the index lost ground on three of the next four sessions, including a 0.4% dip on Friday. The Nasdaq Composite rose 2.3%, the Dow 2.1% and the Russell 2000 1.3%.
The index gain came while Nvidia ($NVDA) sold off hard. The stock fell from $186.64 to $162.85, a 12.7% drop, on four times its normal volume. Nvidia is one of the largest weights in both the S&P 500 and the Nasdaq, so the indexes rose despite it, carried by Apple ($AAPL) at a record, a broad chip rebound and defensive leaders like Eli Lilly, Costco and Coca-Cola all closing within 1% of their 52-week highs.
Inside the chip group, money rotated instead of leaving. Advanced Micro Devices ($AMD) rose 18.9% and Broadcom ($AVGO) 18.2% on the week, while Nvidia fell. That split is the cleanest signal of the week: traders still want AI hardware exposure, and they moved it away from the one name with a leadership question.
The VIX fell 24.7% to 19.30, back below 20 after the November 5 spike. A falling VIX during a week with a 13% intraday gap in the largest stock tells you the stress was specific to Nvidia, and broad hedging demand cooled.
Bonds told a different story. The 10-year Treasury yield rose from 4.86% to 5.15% and the 2-year from 4.51% to 4.88%, per Treasury's daily curve. The 2-year moves most on Fed expectations, so a 37 basis point jump in one week means the market priced more tightening after CPI. Our guide to why the 2-year Treasury yield matters to day traders explains how to read that move against stock reactions.
Crude oil settled Friday near $88.56 a barrel, down from above $96 at the start of November as Middle East tensions eased, which helped the inflation picture at the margin. Bitcoin fell below $74,000 after Tuesday's CPI report, per The Block, and kept sliding into the weekend. That weakness spills into crypto-linked stocks like Strategy, Coinbase and Bitmine, and into speculative small caps that trade on the same risk appetite.
For context on how we got here, last week's issue, Weekly Market Insights: November 9 to 13, covered the November 5 chip crash and the setup into CPI.
Economy and Fed Policy: Retail Sales, FOMC Minutes and a December Hike Priced In
The Federal Reserve held its target range at 3.75% to 4.00% on October 28 in a 10-2 vote, and the market now treats a December hike as settled. After October CPI, CME FedWatch showed 84.7% odds of a quarter-point hike to 4.00% to 4.25% at the December 8-9 meeting and 15.3% odds of a half-point move, per InvestmentNews. Combined, that is effectively 100% priced for some hike.
Last week's key data. October CPI rose 0.4% for the month after 0.6% in September, and core CPI rose 0.3% for a third straight month, against forecasts of 0.3% and 0.2%. Shelter accounted for more than 30% of the monthly increase, per the Bureau of Labor Statistics. BLS could not publish most 12-month changes because it never collected October 2025 prices during last year's shutdown, so monthly numbers carry more weight than usual.
Monday. No tier-one U.S. data. Weekend headlines about Nvidia, crypto and the Anthropic IPO set the tone.
Tuesday. October retail sales at 8:30 a.m. from the Census Bureau. September rose 0.8%. Home Depot reports before the open, and Nvidia reports after the close, so Tuesday stacks a macro print and the market's biggest earnings event into one session.
Wednesday. Target, Lowe's and TJX before the open, then the FOMC minutes at 2:00 p.m. The minutes cover the October meeting, where two officials dissented. Watch the wording on how many members see more than one additional hike as likely; that is what moves the 2-year.
Thursday. Walmart before the open, weekly jobless claims at 8:30 a.m., and Anthropic's expected first trade. Intuit, Ross Stores and Keysight report after the close.
Friday. Monthly options expiration. With Nvidia, Walmart and Palo Alto Networks all reporting before it, expect heavy open interest near round strikes in those names.
What a hot or cold retail print would do. A strong October number on top of a 0.3% core CPI would pressure the 2-year higher and strengthen the case for a half-point December move, which tends to hit long-duration tech and small caps hardest. A weak number would ease yields and could help rate-sensitive groups like homebuilders and regional banks, but it would also raise questions about the consumer right before Walmart and Target report. The next big inflation test, November CPI, lands December 10, the morning after the Fed decision.
Stocks to Watch This Week
The list below draws on seven scanner screens: earnings this week, momentum leaders, broken names, unusual volume, stocks at their highs, wide ranges with deep liquidity, and crowded shorts. Each name had at least one number that stood out, plus a catalyst you can verify. Before the open, Trade Ideas' free Stock Info page is a quick way to pull up a ticker's chart and recent news alongside these levels.
How to Execute the Key Levels
Support and resistance are areas to watch, and price can slice through either one. Wait for price to test a level, then look for confirmation, such as a 5-minute candle that closes back on the right side of the level with volume absorbing the push. If you trade a level, any stop belongs on the other side of it, sized so a normal day's range (the ATR shown for each stock) doesn't take you out by noise alone.
On earnings names, the opening gap often blows straight through the nearest level. Let the first 5 to 15 minutes print before you treat any level as active, and see our earnings day playbook for gap-and-go versus gap-fill setups.
Nvidia's Leadership Shock and the Chip Rotation
$NVDA: First earnings report under an interim CEO
Setup Difficulty: Moderate to High (Deep Liquidity, Event Risk Plus Open Headline Risk)
Key levels · NVDA
November 13, 2026 close| Kind | Level | Price |
|---|---|---|
| resistance | Prior swing low, Nov 5 (now overhead) | 181.46 |
| resistance | Week high, Nov 9 | 179.92 |
| close | Friday close | 162.85 |
| support | Friday low, Nov 13 | 158.39 |
| support | 52-week low, Nov 12 | 148.80 |
Week -12.7% | RVOL 4.0x | ATR $11.00 (6.8%) | implied move about ±8.6% | days to cover 2.8 | 33% below 52-week high.
Nvidia's board announced on Thursday, November 12, that Jensen Huang had resigned as CEO, with CFO Colette Kress named interim CEO and director Harvey Jones as board chair, per the company's SEC filing. The stock opened that day at $151.00, about 13% below Wednesday's close, hit $148.80, and closed at $166.19. That intraday reversal from the low is the most important price fact on the chart, because it shows buyers absorbed the worst of the headline.
The same filing confirms the report is still on schedule: results at about 1:20 p.m. Pacific (4:20 p.m. ET) on Tuesday, November 17, with written CFO commentary posted at release and a call at 5:00 p.m. ET. Nasdaq's consensus is $2.49 a share. The ATR of $11.00 means Nvidia has been traveling about 7% a day on average, so the options market's ±8.6% implied move ($14.05 either way from $162.85, or roughly $149 to $177) is only a little more than one normal day of range.
What to watch at Monday's open: whether $158.39 holds. A drop through it puts the November 12 low at $148.80 back in play before earnings. On the upside, $179.92 and $181.46 are the first overhead levels; the November 5 low at $181.46 used to be support and is now resistance until price closes above it.
After the report, the if/then is simple. If guidance clears the bar and the stock reclaims $179.92 with volume, the November 12 low becomes a confirmed capitulation low. If it gaps below $148.80 and can't reclaim it in the first 15 minutes, there is no recent price support underneath. Short-dated options cost about $14 of premium for the straddle alone, so an unhedged weekly bet needs a move bigger than that just to break even.
$AMD: The other side of the Nvidia trade
Setup Difficulty: High Risk / Advanced Only (ATR Near $48, 9% Daily Range)
Key levels · AMD
November 13, 2026 close| Kind | Level | Price |
|---|---|---|
| resistance | Prior high, Oct 13 | 606.20 |
| resistance | Week high, Nov 12 | 594.00 |
| close | Friday close | 534.06 |
| support | Friday low, Nov 13 | 520.01 |
| support | Week low, Nov 9 | 468.21 |
Week +18.9% | RVOL 1.8x | ATR $47.88 (9.0%) | $14.0B traded daily | days to cover 1.9 | 19% below 52-week high.
AMD jumped 13.3% on Monday, November 9, and kept climbing to $585.30 on Thursday as Nvidia's leadership crisis unfolded; CNBC reported AMD and Broadcom gained as Nvidia slumped that day. Friday's 8.8% drop to $534.06 gave back a chunk of it in one session, which shows how crowded the rotation had become in four days.
Nvidia's report is AMD's catalyst too. A strong Nvidia print can pull money back toward the market leader and away from AMD, and a weak one or new leadership headlines can extend AMD's relative strength. Watch the two tickers side by side on Wednesday morning, because that relationship can flip faster than either stock's own news.
The numbers make this an advanced name. A $47.88 ATR means a normal day covers nearly $48, so a stop that looks tight on a percentage basis is still a large dollar risk per share. If $520.01 holds early in the week, the $594.00 high is the level that decides whether Friday was a pause or a top. A break of $520.01 opens the gap toward Monday's $468.21 low.
AI Infrastructure Rebounds Under Test
$CBRS: Record quarter meets a 72% drawdown
Setup Difficulty: High Risk / Advanced Only (10.6% ATR, Recent IPO, Insider Selling)
Key levels · CBRS
November 13, 2026 close| Kind | Level | Price |
|---|---|---|
| resistance | Post-earnings high, Nov 13 | 120.44 |
| close | Friday close | 108.72 |
| support | Friday low, Nov 13 | 101.18 |
| support | Week low, Nov 9 | 87.16 |
| support | All-time low, Nov 5 | 77.84 |
Week +21.2% | RVOL 1.4x | ATR $11.50 (10.6%) | $1.3B traded daily | days to cover 2.1 | 72% below 52-week high.
Cerebras Systems reported record third-quarter GAAP revenue of $210.8 million on November 12, raised its full-year outlook and said it expects to triple revenue in 2027, per its SEC filing. The stock opened Friday at $108.70, ran to $120.44 and closed at $108.72, so the whole post-earnings gain above the open was sold by the close.
That round trip matters. A stock that rallies 37% off its November 5 low of $77.84 in six sessions, then fails to hold an intraday spike, is showing supply above $110 to $120. Holders who bought near the May 14 high of $386.34 are far underwater, which is the kind of overhead supply that sells into every rally.
If Cerebras holds $101.18 and reclaims $110 with volume early in the week, buyers are defending the earnings gap. If it loses $101.18, the gap toward $100 and then the $87.16 week low is open. With an ATR near 11%, size it like a small cap even though it trades $1.3 billion a day.
$CRWV: Does the earnings pop hold or fade?
Setup Difficulty: High Risk / Advanced Only (12.1% ATR, Heavy Debt Story)
Key levels · CRWV
November 13, 2026 close| Kind | Level | Price |
|---|---|---|
| resistance | Post-earnings high, Nov 11 | 62.02 |
| resistance | Nov 12 high | 58.56 |
| close | Friday close | 53.13 |
| support | Friday low, Nov 13 | 49.24 |
| support | Week low, Nov 9 | 45.15 |
Week +14.5% | RVOL 1.4x | ATR $6.44 (12.1%) | $4.0B traded daily | days to cover 1.1 | 62% below 52-week high.
CoreWeave reported third-quarter revenue of $3.66 billion, up 168% from a year earlier, and a revenue backlog of $132.5 billion on November 10. The stock jumped 24.7% on Wednesday to $60.77, then gave back 12.6% over the next two sessions to $53.13. It is now a countertrend rally inside a stock that sits 62% below its high.
The bull case is the backlog; the bear case is the cost of funding it. CoreWeave guided fourth-quarter interest expense to $1.05 billion to $1.15 billion, and that matters more when the 10-year is above 5%. Rising long yields are a direct headwind for this name, so watch Tuesday's retail sales and Wednesday's minutes alongside the chart.
If $49.24 holds, the first test is whether price can reclaim $58.56, the Thursday high. A break of $49.24 would turn last week's rally into a failed bounce and put the $45.15 low back in view. A 12% average daily range means half-size positions are reasonable even for experienced traders.
Cybersecurity Earnings
$PANW: An 11% implied move into a weak chart
Setup Difficulty: Moderate to High (Binary Event, Deep Liquidity)
Key levels · PANW
November 13, 2026 close| Kind | Level | Price |
|---|---|---|
| resistance | Week high, Nov 11 | 341.80 |
| close | Friday close | 322.24 |
| support | Week low, Nov 9 | 314.10 |
| support | 20-day low, Nov 5 | 312.12 |
Implied move about ±11.1% | ATR $20.06 (6.2%) | $2.2B traded daily | days to cover 3.5 | 25% below 52-week high.
Palo Alto Networks reports fiscal first-quarter results after the close on Wednesday, November 18, with a video webcast at 4:30 p.m., per the company. Its own guidance calls for revenue of $3.30 billion to $3.31 billion, Next-Generation Security annual recurring revenue of $9.54 billion to $9.56 billion and non-GAAP EPS of $0.96 to $0.98.
The options market prices about $35.83 either way from $322.24, roughly $286 to $358. That is a large move for a security company worth about $264 billion, and it reflects a chart that fell from $421.48 on October 12 to the low $310s in a month. The stock has held $312.12 to $314.10 twice in two weeks, so that zone is the line the report has to respect.
CrowdStrike ($CRWD) rose 4.5% last week to Palo Alto's 2.7% and also held above its November 5 low, so compare the two on Thursday morning. If Palo Alto gaps above $341.80 and holds, the drawdown may have been overdone. If it opens below $312.12, the chart has no nearby support from the last month. Weekly options here carry a lot of premium; buying them unhedged into the report is a bet against the market's own $36 estimate.
Retail Earnings Into a 5% Yield
$TGT: The bigger mover of the two big-box reports
Setup Difficulty: Moderate (Liquid, but a 9% Implied Move)
Key levels · TGT
November 13, 2026 close| Kind | Level | Price |
|---|---|---|
| resistance | 52-week high, Aug 24 | 170.75 |
| resistance | Week high, Nov 9 | 167.60 |
| close | Friday close | 161.45 |
| support | Week low, Nov 10 | 157.92 |
Implied move about ±9.0% | ATR $5.47 (3.4%) | $599M traded daily | 5% below 52-week high.
Target reports before the open on Wednesday, November 18, with its call from 8:00 to 9:00 a.m. Nasdaq's consensus is $2.03 a share. The stock usually travels about 3.4% a day, yet options price about $14.47 either way (roughly 9%), nearly triple a normal day. That gap between ATR and implied move tells you the market expects a decisive reaction.
Target sits 5% below its August high after rising 3.1% over the past month, so the setup is a stock near the top of its range heading into a binary event. The premarket gap will show whether $167.60 or $157.92 matters first.
If the stock opens above $167.60 and holds the first 15-minute low, the August high at $170.75 is the next reference. If it opens below $157.92, last week's range has failed and the move is likely to extend, given how much the options market expects. Wait for the opening range to form before acting on either.
$WMT: The week's largest consumer read
Setup Difficulty: Moderate (Low Normal Volatility, but a 6% Event)
Key levels · WMT
November 13, 2026 close| Kind | Level | Price |
|---|---|---|
| resistance | 20-day high, Nov 5 | 131.82 |
| resistance | Week high, Nov 13 | 128.27 |
| close | Friday close | 128.09 |
| support | Week low, Nov 9 | 123.58 |
Implied move about ±6.2% | ATR $3.02 (2.4%) | $2.7B traded daily | days to cover 3.8 | 5% below 52-week high.
Walmart reports fiscal third-quarter results before the open on Thursday, November 19. Nasdaq's consensus is $0.64 a share. Walmart closed Friday at $128.09, right at its week high of $128.27, so it heads into the report pressing the top of its recent range while the rest of retail waits.
The options market prices about $8.00 either way, about 6.2%, against a normal daily range of $3.02. For a stock this size, a move of that scale shifts the whole consumer staples group, and Target's report a day earlier will set expectations.
If Walmart opens above $131.82, the November 5 high, it is breaking out of a month-long range. A gap below $123.58 would erase the whole week. Because Walmart's normal range is only 2.4%, many traders size up in it; around an event priced at 6%, normal sizing is the safer default.
Crypto Pressure and an Index Deletion
$MSTR: Forced selling with a known date
Setup Difficulty: High Risk / Advanced Only (Bitcoin Beta, Index Flows)
Key levels · MSTR
November 13, 2026 close| Kind | Level | Price |
|---|---|---|
| resistance | Week high, Nov 9 | 129.37 |
| close | Friday close | 111.62 |
| support | Week low, Nov 13 | 108.25 |
| support | 52-week low, Jun 26 | 81.81 |
Week -13.4% | RVOL 0.9x | ATR $8.46 (7.6%) | $2.6B traded daily | days to cover 1.4 | 61% below 52-week high.
MSCI said on November 11 that Strategy will be removed from the MSCI USA Index at the close of November 30 under a new non-operating company screen, which also takes it out of MSCI World and ACWI, per The Block. Funds that track those indexes must sell by that close. A removal does not force the company to sell bitcoin, but the pressure lands on the shares.
The stock fell five straight sessions to $111.62 and closed near its $108.25 low, while bitcoin slid below $65,000 over the weekend. Strategy usually moves about twice as much as bitcoin in percentage terms, so a gap lower Monday is possible before any U.S. data hits.
Watch $108.25 first. Below it, the chart has no support until the high $80s, near the June 26 low of $81.81. A sharp gap lower that reverses above $108.25 would be the first sign of a capitulation bounce, but index selling into November 30 can cap rallies. Coinbase ($COIN) and Bitmine ($BMNR) trade on the same bitcoin flows.
Structural Strength at Record Highs
$AAPL: A record close while the chip trade broke
Setup Difficulty: Beginner Friendly (High Liquidity, Clean Structure)
Key levels · AAPL
November 13, 2026 close| Kind | Level | Price |
|---|---|---|
| resistance | Record high, Nov 13 | 360.83 |
| close | Friday close | 356.27 |
| support | Prior 20-day high, Nov 5 | 355.38 |
| support | Week low, Nov 9 | 344.78 |
Week +4.1% | RVOL 0.8x | ATR $9.46 (2.7%) | $16.7B traded daily | days to cover 3.4 | 1% below 52-week high.
Apple rose 4.1% last week to $356.27 and set a record high of $360.83 on Friday, while Nvidia fell 12.7%. It has no scheduled catalyst this week, which makes it the cleanest structure on the list: a liquid mega-cap trending higher with a 2.7% daily range.
The one caution is volume. Last week's RVOL of 0.8x means the breakout came on lighter-than-normal trading, so buyers have not yet committed in size. Breakouts on light volume fail more often than breakouts on heavy volume.
The prior 20-day high at $355.38 is the first test. If Apple holds it on any dip, the breakout is intact. A close back below $355.38 turns Friday's record into a possible false breakout, with $344.78 as the next support.
Broader Market Radar: Chips, Retail, Crypto, Biotech and Energy
Each name below showed up on at least one scan list, but a caveat kept it off the priority list: thin dollar volume, no fresh catalyst, or overlap with a priority name.
- $AVGO: Up 18.2% last week to $347.01 with a 5.8% ATR, the other big winner of the Nvidia rotation. It trades with AMD, so it adds little you don't already have from that card.
- $LITE, $SNDK, $NBIS and $IREN: The widest ranges among stocks trading at least $500 million a day, with ATRs from 12.9% to 16.2%. All four sit 48% to 76% below their highs. Advanced only.
- $HD, $LOW and $TJX: Home Depot reports Tuesday before the open (implied about ±5.2%), Lowe's and TJX Wednesday before the open (about ±5.4% and ±5.9%). Lowe's still lists its date as tentative.
- $INTU, $ROST and $KEYS: All Thursday after the close, with implied moves of about ±9.1%, ±7.4% and ±9.7%. Ross carries 4.7 days to cover, the most crowded short of the group.
- $CRWD: Up 4.5% last week to $226.61, 21% below its high. It reports later in the season; watch it as the comparison for Palo Alto's reaction.
- $COIN and $BMNR: Down 5.3% and 6.3% last week, with ATRs of 7.4% and 8.4%. Both move with bitcoin and with Strategy's index flows.
- $LUNR: Up 24.2% on 2.2x volume with 6.1 days to cover. Average dollar volume is only $77 million, so this is advanced only.
- $LQDA: Up 29.3% last week to $57.41 after its November 10 quarterly report, with 5.3 days to cover. The stock tripped no volume screen (RVOL 0.6x), so the move came on thinner trading than it looks.
- $MRNA: Down 12.1% last week to $223.37 after a run to $280.80, with an 8.6% ATR and $3.7 billion traded daily. The week's range was wide; no single verified catalyst explains it yet.
- $ABNB and $AMZN: Both within 7% of their 52-week highs with ATRs near 4%. Steady relative strength, no event this week.
- $LNG: Up 11.1% last week to $308.75, 7% below its high. LNG exporters trade on Middle East supply headlines, which can change overnight.
- $BZ: Down 26.6% last week with 7.5 days to cover and earnings Tuesday (timing not confirmed). A crowded short reporting after a collapse is two-way risk.
Anthropic's IPO and Why It Matters for AI Stocks
Anthropic filed an amended S-1 on November 10 to sell 825 million Class A shares at $70 to $78, and it plans to list on the Nasdaq Global Select Market as ANT. Renaissance Capital puts the deal at about $61 billion, with a fully diluted market value near $1.2 trillion at the midpoint. The company's IPO site expects pricing on November 18 and trading on November 19, subject to regulatory clearance.
For day traders, the first effect is supply. A $61 billion offering needs buyers, and some of that money can come out of other AI stocks in the days around the debut. The second effect is the opening itself: large IPOs often open well after 9:30 a.m. once the exchange balances orders, so the first print can arrive midday. Our guide to preparing for the Anthropic IPO covers the Nasdaq-100 Fast Entry rule and the options timeline, and the IPO trading playbook walks through an opening range approach.
Trading Scenarios and Preparation for the Week
Each scenario below lists what you would actually see if it is playing out. None of them predicts which way an event will go.
Scenario 1: Nvidia's report resets the AI trade
Signs it is working: Nvidia reclaims $179.92 on heavy volume after the report, AMD gives back part of last week's gain as money rotates back, and the Nasdaq-100 leads the S&P 500 on Wednesday.
Signs it is failing: Nvidia gaps below $148.80 and can't reclaim it in the first 15 minutes, AMD and Broadcom fall with it instead of rising, and the VIX moves back above 22.
Scenario 2: Retail data and earnings push yields higher
Signs it is working: Retail sales beat, the 2-year yield rises above 4.95%, and rate-sensitive groups (homebuilders, small caps, CoreWeave-style debt-heavy growth) lag even as Walmart or Target trade higher on their own reports.
Signs it is failing: Retail sales miss, the 10-year falls back toward 5.00%, and small caps lead. In that case watch whether Walmart and Target sell off on consumer worries even with lower yields.
Scenario 3: IPO supply and crypto weakness drain speculative stocks
Signs it is working: Recent AI winners like Cerebras and CoreWeave fade in the two sessions around Anthropic's debut, bitcoin stays below $65,000, and Strategy breaks $108.25.
Signs it is failing: Cerebras holds $101.18 and CoreWeave holds $49.24 through Thursday, bitcoin reclaims $70,000, and Strategy reverses a gap lower back above $108.25.
Myth and fact
Buying weekly options into earnings without checking the implied move
Weekly Trader Preparation Checklist
Frequently Asked Questions
Why did Nvidia (NVDA) stock fall 12.7% this week?
When does Nvidia report earnings this quarter?
How much is NVDA stock expected to move after earnings?
Why is Strategy (MSTR) being removed from the MSCI USA Index?
When does Anthropic (ANT) start trading on Nasdaq?
Why did the 10-year Treasury yield rise to 5.15%?
Disclaimer
Article Sources
- NVIDIA Form 8-K: NVIDIA Announces CEO Transition - Huang's resignation, Kress as interim CEO, Harvey Jones as chair, and the November 17 report time.sec.gov
- NVIDIA: Conference Call for Third-Quarter Financial Results - 5:00 p.m. ET call and CFO commentary timing.investor.nvidia.com
- CNBC: Nvidia CEO Jensen Huang resigns, live updates - Congressional testimony comments and AMD and Broadcom gains on November 12.cnbc.com
- U.S. Bureau of Labor Statistics: Consumer Price Index, October 2026 - Monthly CPI, core CPI, shelter share and the missing 12-month changes.bls.gov
- U.S. Treasury: Interest Rate Statistics, Daily Par Yield Curve - 2-year, 10-year and 30-year yields for November 6 and 13.home.treasury.gov
- Federal Reserve: November 2026 calendar - FOMC minutes release on November 18 at 2:00 p.m.federalreserve.gov
- WealthManagement.com: Fed Holds Rates - October 28 decision and 10-2 vote.wealthmanagement.com
- InvestmentNews: October CPI and December hike odds - CME FedWatch probabilities after CPI.investmentnews.com
- U.S. Census Bureau: Monthly Retail Trade - October retail sales release schedule.census.gov
- Palo Alto Networks: Fiscal first quarter 2027 results date - Report date and 4:30 p.m. webcast.prnewswire.com
- Palo Alto Networks: Fiscal Q4 and fiscal 2026 results - First-quarter fiscal 2027 guidance.paloaltonetworks.com
- Cerebras Systems Form 8-K: Third quarter 2026 results - Record revenue, raised outlook and 2027 growth target.sec.gov
- Cointelegraph: CoreWeave third-quarter results - Revenue and backlog figures.cointelegraph.com
- The Block: Strategy and Metaplanet lose MSCI index membership - Deletion and November 30 effective date.theblock.co
- The Block: Bitcoin slides after hotter-than-expected CPI - Bitcoin's move after the CPI report.theblock.co
- Renaissance Capital: Anthropic sets terms for its IPO - Deal size, price range and timing.renaissancecapital.com
- Nasdaq: Earnings calendar and market data - Stock and index closes, consensus EPS, report timing, option chains for implied moves and short interest for days to cover.nasdaq.com