
The 10 AM Reversal Strategy: Why the Hour Mark Matters


In this article8 sections
A stock gaps up, runs hard for the first twenty-five minutes, and every chart looks like a clean continuation setup. Then, somewhere close to 10:00 AM ET, the move simply stops, stalls for a few minutes, and reverses, sometimes hard enough to erase the entire morning gain. Traders who've watched this happen enough times start calling it "the 10 o'clock reversal," and it isn't superstition. Two real, identifiable forces converge right around that hour mark, and understanding both is what turns this from a frustrating pattern into a tradable one.
What is the 10 AM reversal in day trading? The 10 AM reversal refers to a recurring tendency for a stock's initial directional move off the open to stall and reverse around the 10:00 AM ET hour, driven by the exhaustion of the first 30 minutes' order flow combined with the concentration of major scheduled U.S. economic data releases at that exact time.
Why 10 AM Specifically, Not 10:15 or 9:50
Two separate mechanisms land at almost the same moment, which is what makes 10:00 AM a genuinely different kind of inflection point than an arbitrary round number.
The first is economic data concentration. A meaningful share of the U.S. government's and private-sector's monthly economic indicators, ISM Manufacturing and Services, Consumer Confidence, New and Existing Home Sales, JOLTS, among others, are scheduled for release at exactly 10:00 AM ET on their respective release days. A headline number that surprises meaningfully in either direction can override whatever an individual stock's chart was doing a minute earlier, turning what looked like an exhausted move into a fresh, data-driven one, or turning what looked like a strong continuation into an abrupt reversal.
The second is unrelated to any scheduled data at all: the order flow that drove the first 30 minutes, the opening imbalance resolving and the Golden Hour's heaviest institutional execution, naturally starts thinning out by 9:55 to 10:05 AM regardless of what any economic calendar says. A move that was purely momentum-driven, with no fresh catalyst to sustain it, tends to run out of the exact fuel that got it started right around this point.
Distinguishing which of these two forces is actually driving a given morning's reversal, a data surprise versus simple momentum exhaustion, is the entire skill this setup depends on.
The 10 AM Reversal Fade Setup Specification
- Component
- Market Conditions Required
- Rule
- No major scheduled economic release in the 9:55 to 10:05 AM window, OR a scheduled release that came in close to consensus with no major surprise
- Component
- Time of Day
- Rule
- Entries taken 9:55 AM to 10:20 AM ET only
- Component
- Stock Selection Criteria
- Rule
- Stock with a clear, momentum-driven (not fresh-catalyst) move in the first 25 to 30 minutes; no new news or data specific to that stock in the prior 10 minutes
- Component
- Entry Trigger
- Rule
- Price stalls (two or more consecutive candles with a shrinking range) at or near the morning's high (for a short) or low (for a long), then closes back through the most recent short-term higher low or lower high
- Component
- Stop Loss
- Rule
- Above the stall high (for a short) or below the stall low (for a long)
- Component
- Initial Profit Target
- Rule
- First target at the VWAP or the midpoint of the morning's range; second target at the opening print itself, sized for at least 2:1 reward-to-risk
- Component
- Trade Management
- Rule
- Scale a portion at the first target; trail the remainder using short-term lower highs (for a short) or higher lows (for a long)
- Component
- Invalidation Criteria
- Rule
- Price breaks back beyond the stall extreme on rising volume, meaning the original move is resuming rather than reversing
| Component | Rule |
|---|---|
| Market Conditions Required | No major scheduled economic release in the 9:55 to 10:05 AM window, OR a scheduled release that came in close to consensus with no major surprise |
| Time of Day | Entries taken 9:55 AM to 10:20 AM ET only |
| Stock Selection Criteria | Stock with a clear, momentum-driven (not fresh-catalyst) move in the first 25 to 30 minutes; no new news or data specific to that stock in the prior 10 minutes |
| Entry Trigger | Price stalls (two or more consecutive candles with a shrinking range) at or near the morning's high (for a short) or low (for a long), then closes back through the most recent short-term higher low or lower high |
| Stop Loss | Above the stall high (for a short) or below the stall low (for a long) |
| Initial Profit Target | First target at the VWAP or the midpoint of the morning's range; second target at the opening print itself, sized for at least 2:1 reward-to-risk |
| Trade Management | Scale a portion at the first target; trail the remainder using short-term lower highs (for a short) or higher lows (for a long) |
| Invalidation Criteria | Price breaks back beyond the stall extreme on rising volume, meaning the original move is resuming rather than reversing |
The Market Conditions Required row is the setup's most important filter, and it's worth being direct about why: this setup fades momentum exhaustion, not a fresh data-driven move. Trading it into a surprising ISM or Consumer Confidence print is fading the wrong thing entirely, and it's the single fastest way to turn a well-designed setup into a bad trade.
Case Study: Fading Morning Momentum Into a Quiet 10 AM
Picture a mid-cap retail name, ticker DEF, gapping up on a modest but real pre-market catalyst and running from $58.00 at the open to $60.50 by 9:52 AM on strong volume, a textbook Golden Hour continuation. No economic release is scheduled for that morning; the move is pure momentum.
Between 9:53 and 9:58 AM, DEF prints three consecutive candles with progressively smaller ranges, stalling just under $60.50 on noticeably lighter volume than the initial push. At 9:59 AM, price closes back below the most recent short-term higher low at $60.05. That's the trigger. Entry at $60.00 (short), stop at $60.60 (above the stall high), for $0.60 of risk per share. The first target at VWAP, $59.20, is roughly 1.3:1; the second target at the opening print of $58.00 is over 3:1.
DEF reaches the VWAP target by 10:12 AM, where a third of the position scales out, and continues drifting toward the opening print through the rest of the morning as the momentum that drove the initial run fully unwinds. The reversal wasn't news-driven; it was the natural exhaustion of a move that had already used up its own fuel by the time real economic-data risk would have mattered anyway.
Where This Setup Breaks Down
The most damaging failure is fading a stall that's actually a fresh, data-driven continuation. A stock stalling at 9:57 AM ahead of a 10:00 AM ISM release, and then extending hard on a surprise beat, will run straight through this setup's stop with real conviction behind it. Checking the economic calendar before taking this trade isn't optional context; it's a hard prerequisite the Market Conditions row exists to enforce.
A second failure is confusing a stall with an exhausted move too early. Two shrinking-range candles are the minimum signal, not a guarantee; a stock can pause for two candles and then resume its original direction on the third without ever qualifying as a genuine reversal. The invalidation criteria, a break back beyond the stall extreme on rising volume, exists specifically to exit this misread quickly rather than holding through it.
A third, quieter failure is applying this setup on a day the Initial Balance framework would already flag as a likely Trend Day. A narrow, high-conviction Initial Balance, described in this hub's dedicated Initial Balance guide, raises the odds that a 10 AM stall is a brief pause within a larger trend rather than the trend's actual end, and checking that broader context before fading any individual stock's stall reduces this specific misread.

When the 10 AM Move Is Continuation, Not Reversal
Not every stall at the hour mark resolves as a reversal. On a day with a genuinely surprising, market-moving economic release, or on a stock whose Initial Balance already points to a Trend Day, the more likely outcome is a brief pause followed by continuation in the original direction, essentially a range extension trade rather than a fade.
Recognizing which scenario is actually developing comes down to the same volume and context checks used throughout this setup: a stall with declining volume and no fresh catalyst favors the fade described above; a stall followed by renewed volume and a data-driven or trend-confirming reason to continue favors standing aside from the fade and instead treating it as a possible range-extension entry using the Initial Balance framework instead.
Reading the Economic Calendar and Real-Time Volume
Trading this setup responsibly means checking the morning's scheduled economic releases before 9:30 AM, not discovering them in real time as price starts moving unexpectedly. The Federal Reserve Bank of New York publishes a full schedule of major U.S. economic indicator release dates and times, which is worth a five-minute check as part of any pre-market routine on a day this setup might apply. For the real-time volume confirmation the setup depends on, a scanner capable of flagging a genuine volume decline against a stock's own opening-hour pace is more useful than a static chart. Trade Ideas supports this kind of relative-volume tracking directly.
Fitting the 10 AM Reversal Into the Rest of the Morning
This setup sits at the seam between the Golden Hour and the transition toward midday conditions, and it's genuinely optional: on mornings with a scheduled economic release or a clear Trend Day forming, this setup should simply be skipped in favor of continuation setups from the ORB or Initial Balance frameworks. It isn't a replacement for those broader tools; it's a narrow, specific play for the mornings when the first move was pure momentum with nothing behind it to sustain it past the hour mark.
10 AM Reversal FAQs
How is this setup different from the failed-breakout fade covered in the midday playbook?
They share a fading mechanic, but the underlying cause is different: this setup is about a specific, time-anchored momentum handoff tied to economic data timing and the end of peak opening volume, while the midday setup is about the broader liquidity dip that lasts for hours afterward.
Key Takeaway: The 10 AM setup is a narrow, time-specific transition trade; the midday setup covers a much longer, separate low-liquidity stretch.
Why does checking the economic calendar matter more for this setup than for most others in this hub?
A surprising ISM or Consumer Confidence print can turn what looks like exhausted momentum into a fresh, data-driven continuation in seconds, which is precisely the scenario this setup's Market Conditions row is built to screen out.
Key Takeaway: This setup's entry window and the economic calendar's busiest release time genuinely overlap, which makes the calendar check load-bearing rather than a general precaution.
What counts as a genuine "stall" versus a normal, brief pullback within a continuing trend?
The volume signature matters more than the price shape alone. A pause on genuinely fading volume suggests the move has run out of participation; a pause on volume that's merely paused alongside price suggests the trend is more likely to resume.
Key Takeaway: Judge a stall by its volume signature, not just by the shrinking candle ranges alone.
Can this setup be traded on index ETFs like SPY or QQQ, or only individual stocks?
An individual stock's 10 AM stall might be driven by stock-specific order flow exhaustion alone; an index ETF's stall at the same time is more consistently tied to the broader momentum-and-data dynamic this article describes.
Key Takeaway: This setup transfers cleanly to index ETFs, where the economic-data mechanism tends to dominate more consistently.
How does this setup relate to the Initial Balance framework covered elsewhere in this hub?
Since the Initial Balance isn't fully formed until 10:30 AM, this setup's earlier entry window (9:55 to 10:20 AM) means the two tools don't always align in time, but checking the emerging IB shape as it develops is still useful context for judging whether a 10 AM stall is more likely a reversal or a pause.
Key Takeaway: Use the Initial Balance's emerging shape as a cross-check, even though it isn't fully confirmed until after this setup's entry window closes.
Why does the setup use two separate profit targets instead of one fixed exit?
Not every reversal makes it all the way back to the open; many stall out at VWAP or the range midpoint instead. Scaling protects the more common, partial outcome while still allowing the position to capture the larger move when it happens.
Key Takeaway: Scaling at two targets accounts for both the partial-reversal and full-reversal outcomes this setup can produce.
What's the honest reliability of this pattern compared to more heavily studied setups like the ORB?
The two mechanisms behind it, concentrated 10 AM economic data releases and the natural thinning of opening-hour order flow, are both independently well documented. What isn't independently documented is a precise win rate for trading the specific fade described here, and inventing one wouldn't be honest.
Key Takeaway: The underlying mechanisms are well documented; the specific setup's win rate is an estimate, not a citable statistic.
Disclaimer
Article Sources
- Federal Reserve Bank of New York: Economic Indicators Calendar - official schedule confirming the concentration of major U.S. economic indicator releases around the 10:00 AM ET window.
- Heston, Korajczyk, Sadka: Intraday Patterns in the Cross-section of Stock Returns - academic research on systematic intraday return patterns, including reversal tendencies across the session.
- Chapman University: Revisiting the U-shaped Patterns in Volatility and Price Impacts - research on the intraday volume and volatility curve relevant to why opening-hour momentum tends to fade by the mid-morning.
Was this helpful?
Be the first to weigh in

Written by
Kazi Mezanur RahmanFounder, independent researcher, and editor of DayTradingToolkit. A one-person publication focused on risk-first trading education and documented tool research. He trades his own capital as a retail trader and combines personal market experience with systematic primary-source research.
Keep Reading
Strategies
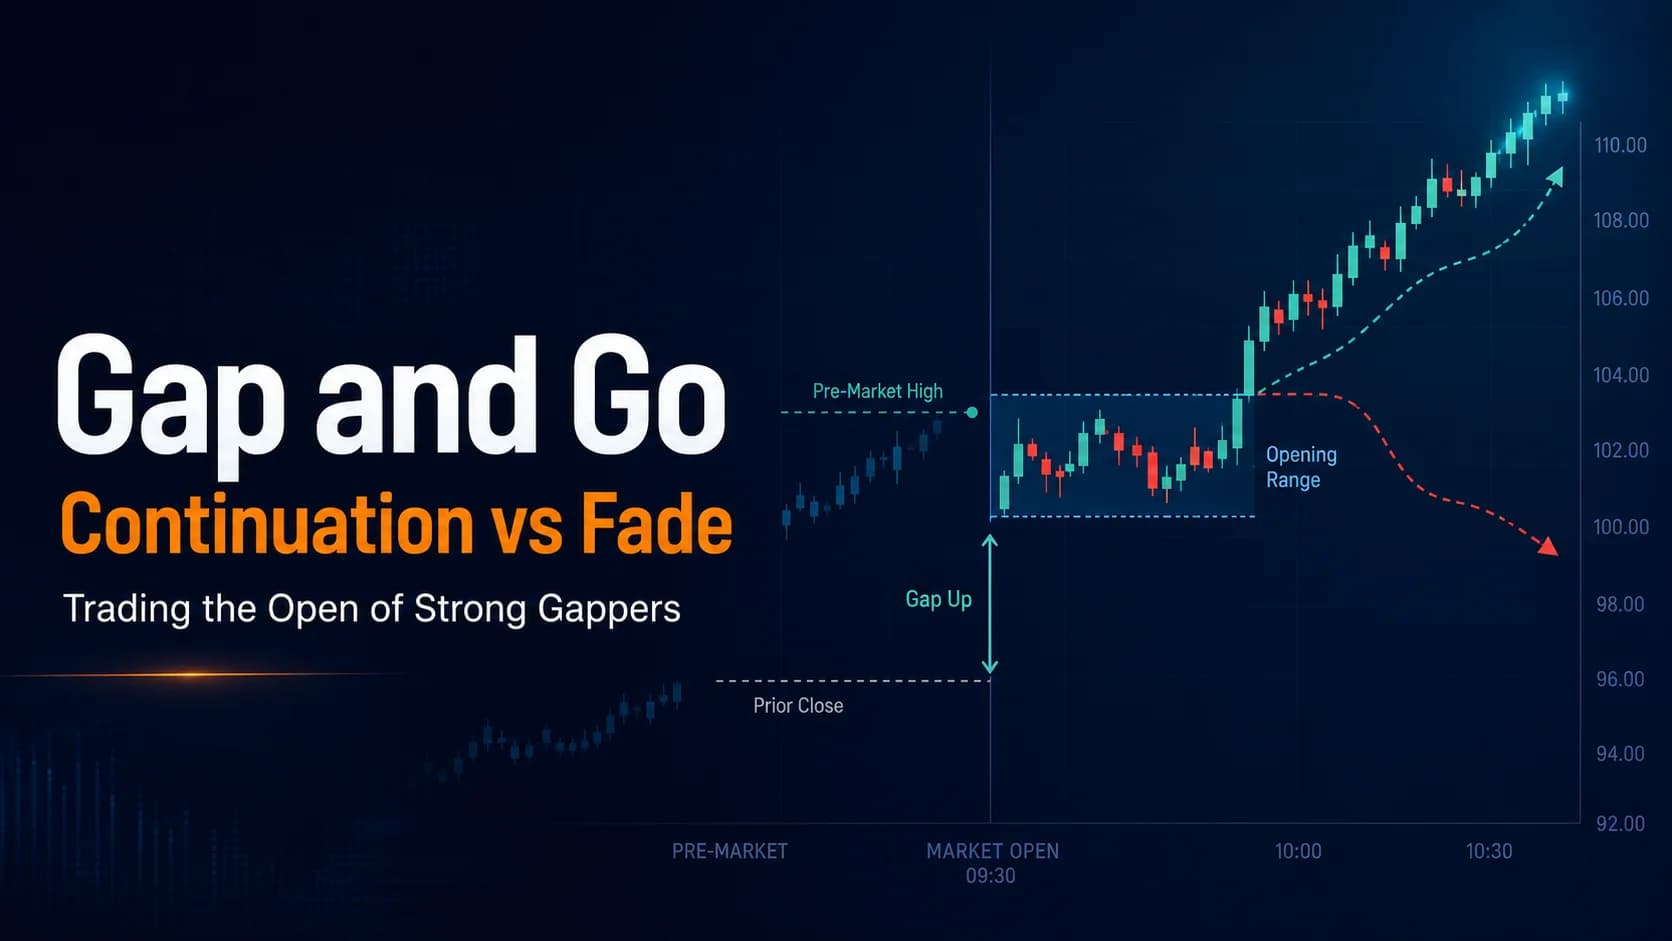
The Gap and Go Strategy: Trading the Open of Strong Gappers
Research shows most gaps reverse during the day, not continue. This guide covers how to spot the ones that genuinely keep going, and how to trade them.
Strategies
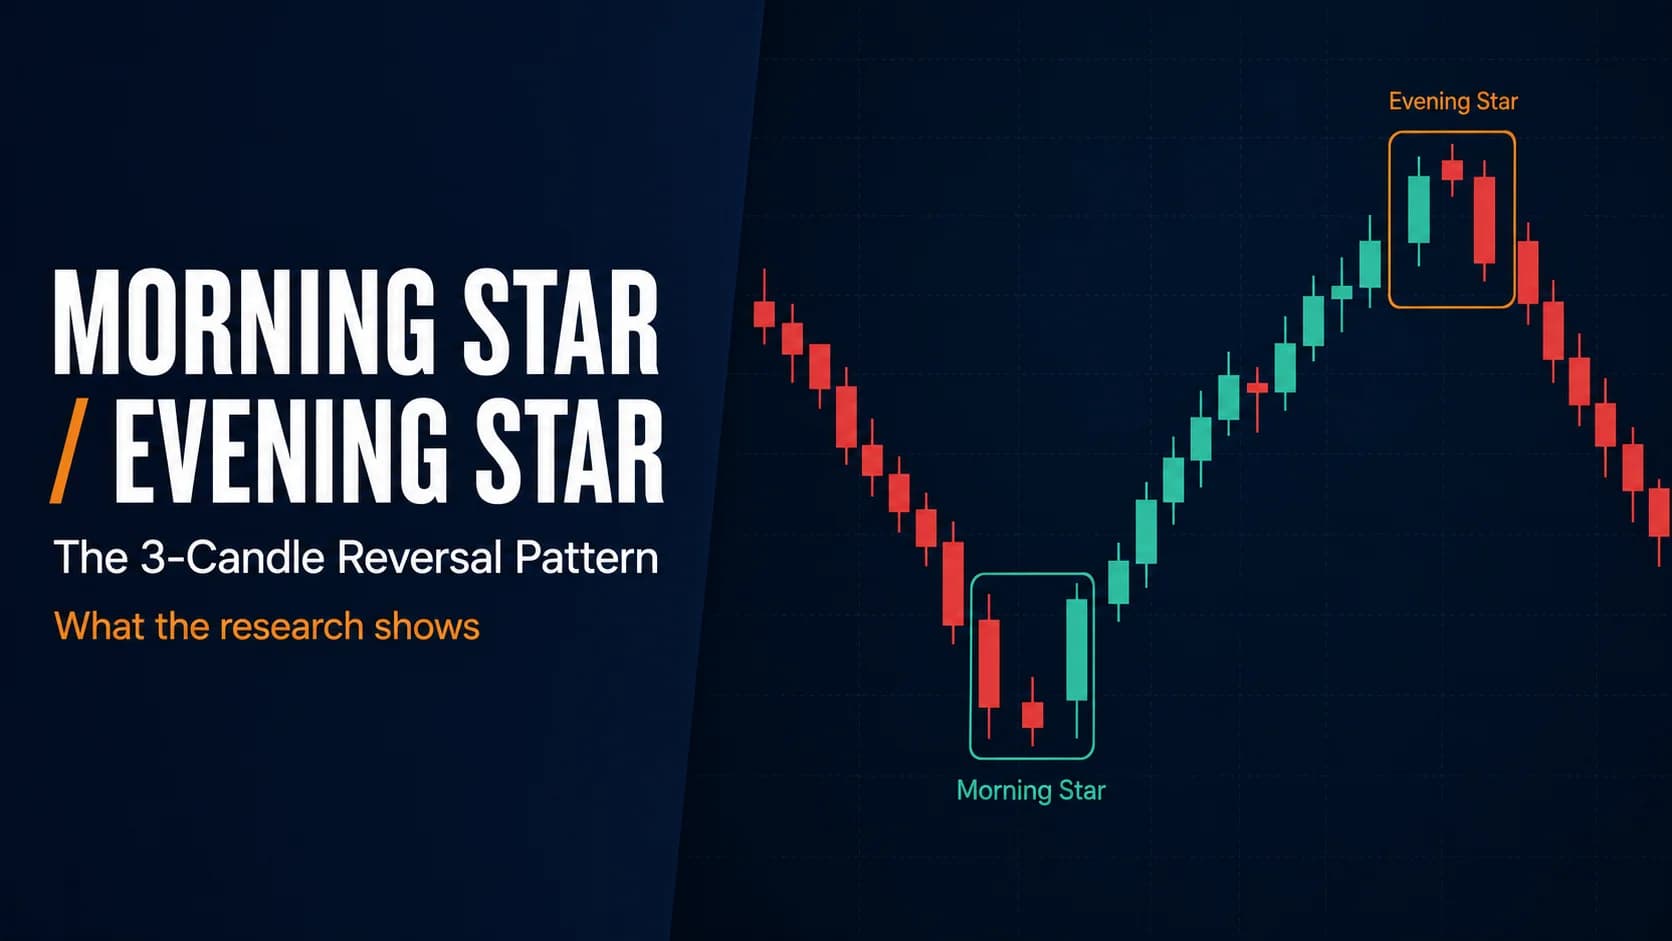
The Morning Star / Evening Star Reversal Strategy
Candlestick research is genuinely split on these patterns. This guide covers the classic 3-candle setup, the real evidence, and how to trade it honestly.
Strategies
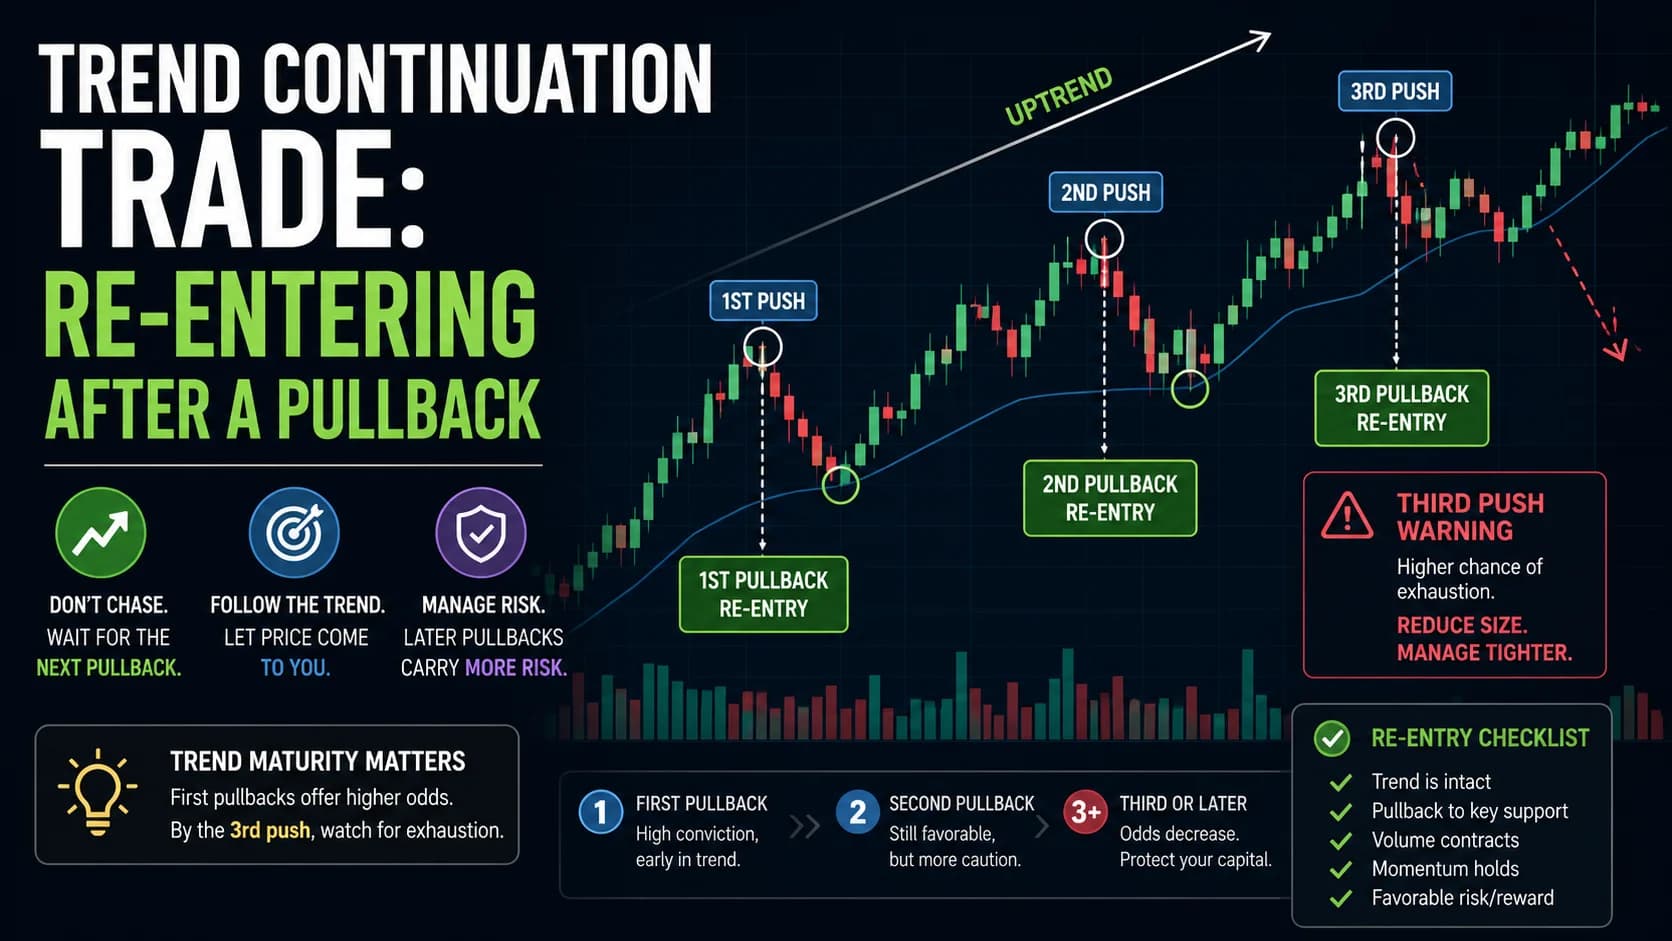
The Trend Continuation Trade: How to Re-Enter After a Pullback
A decision framework for re-entering a trend after the first pullback: track how many "pushes" a trend has made, size down as the well-documented three-pushes exhaustion pattern becomes a real risk, and stop chasing missed entries.
Strategies
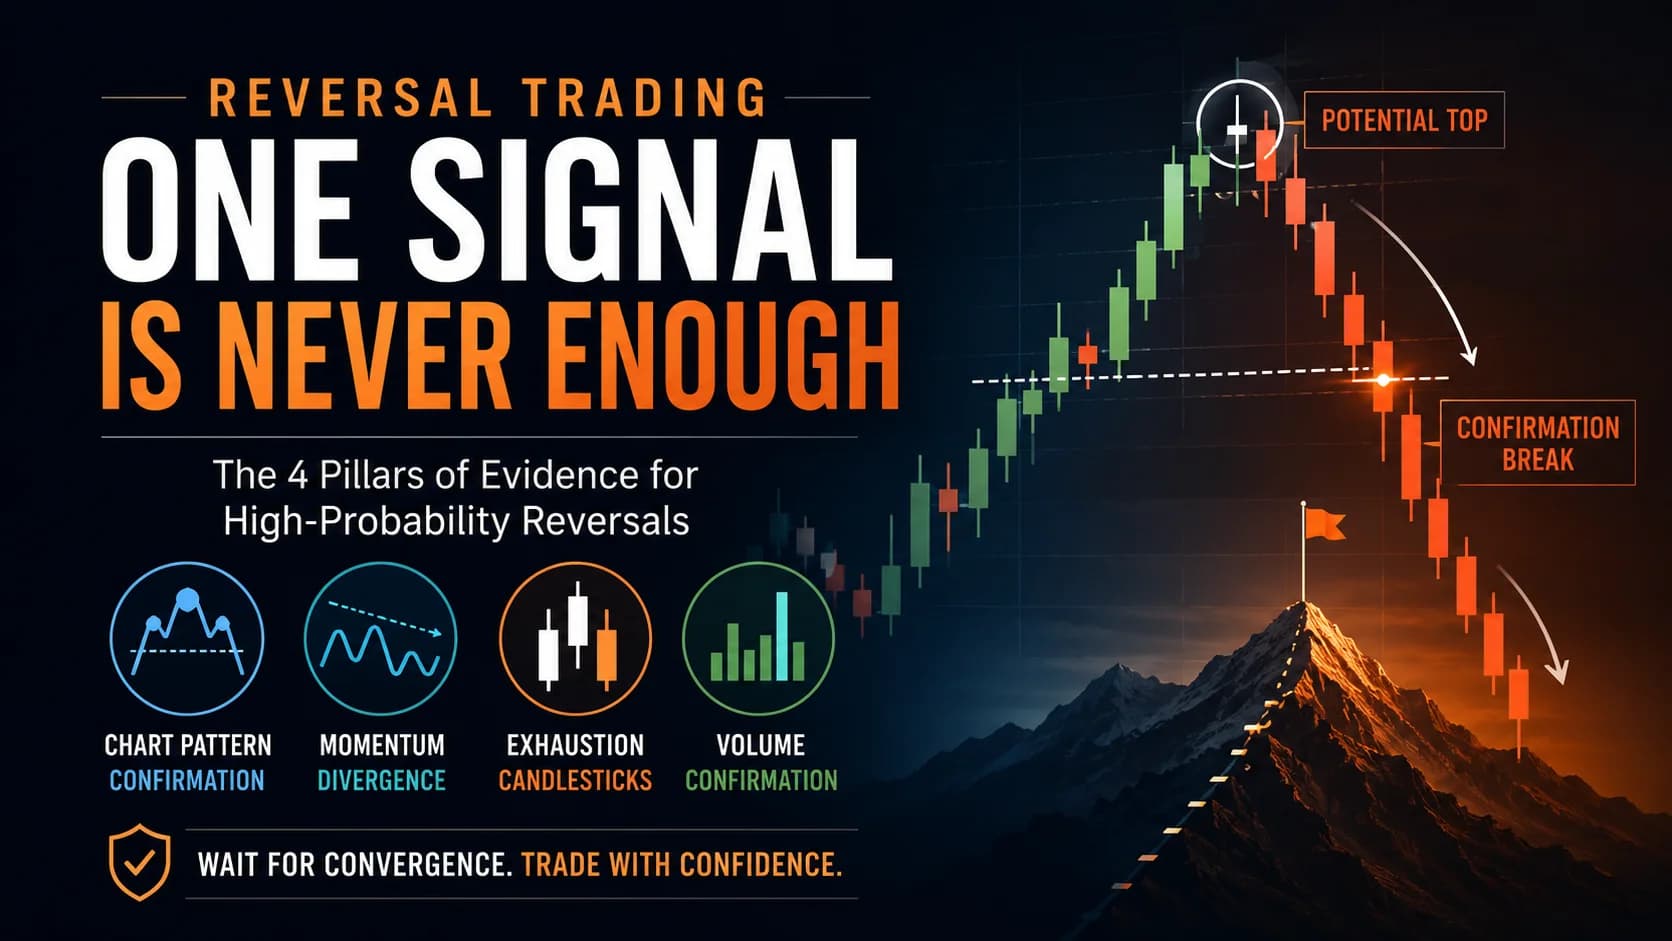
The Reversal Trading Playbook: How to Call a Market Turn
No single indicator calls a top or bottom. This guide covers the four pillars of reversal evidence and how many need to align before a trade is justified.
Comments
No comments yet. Be the first to share your thoughts.