Every trading educator says the same thing: backtest before you trade. Almost nobody does it. The reason isn't laziness — it's that BacktestingThe process of running a defined trading strategy against historical price data to evaluate how it would have performed before risking real capital. A well-constructed backtest gives you a statistical baseline — win rate, profit factor, maxRead definition → has historically demanded either programming skills or hours of manual chart archaeology, and most retail traders have neither to spare. So strategies get "tested" by trading them, which is the most expensive testing methodology ever devised.
OddsMaker is Trade Ideas' answer: an event-based backtester that turns any alert window into a testable strategy with a right-click — no code, no scripting, no data wrangling. It's arguably the most underrated feature on the platform, and also one whose results are dangerously easy to misread if you don't understand what it's actually measuring. This review covers both sides honestly: how it works, how to read what it tells you, the optimization loop that makes it genuinely powerful, and the documented limits — several stated plainly by Trade Ideas itself — that determine when its answers can be trusted.
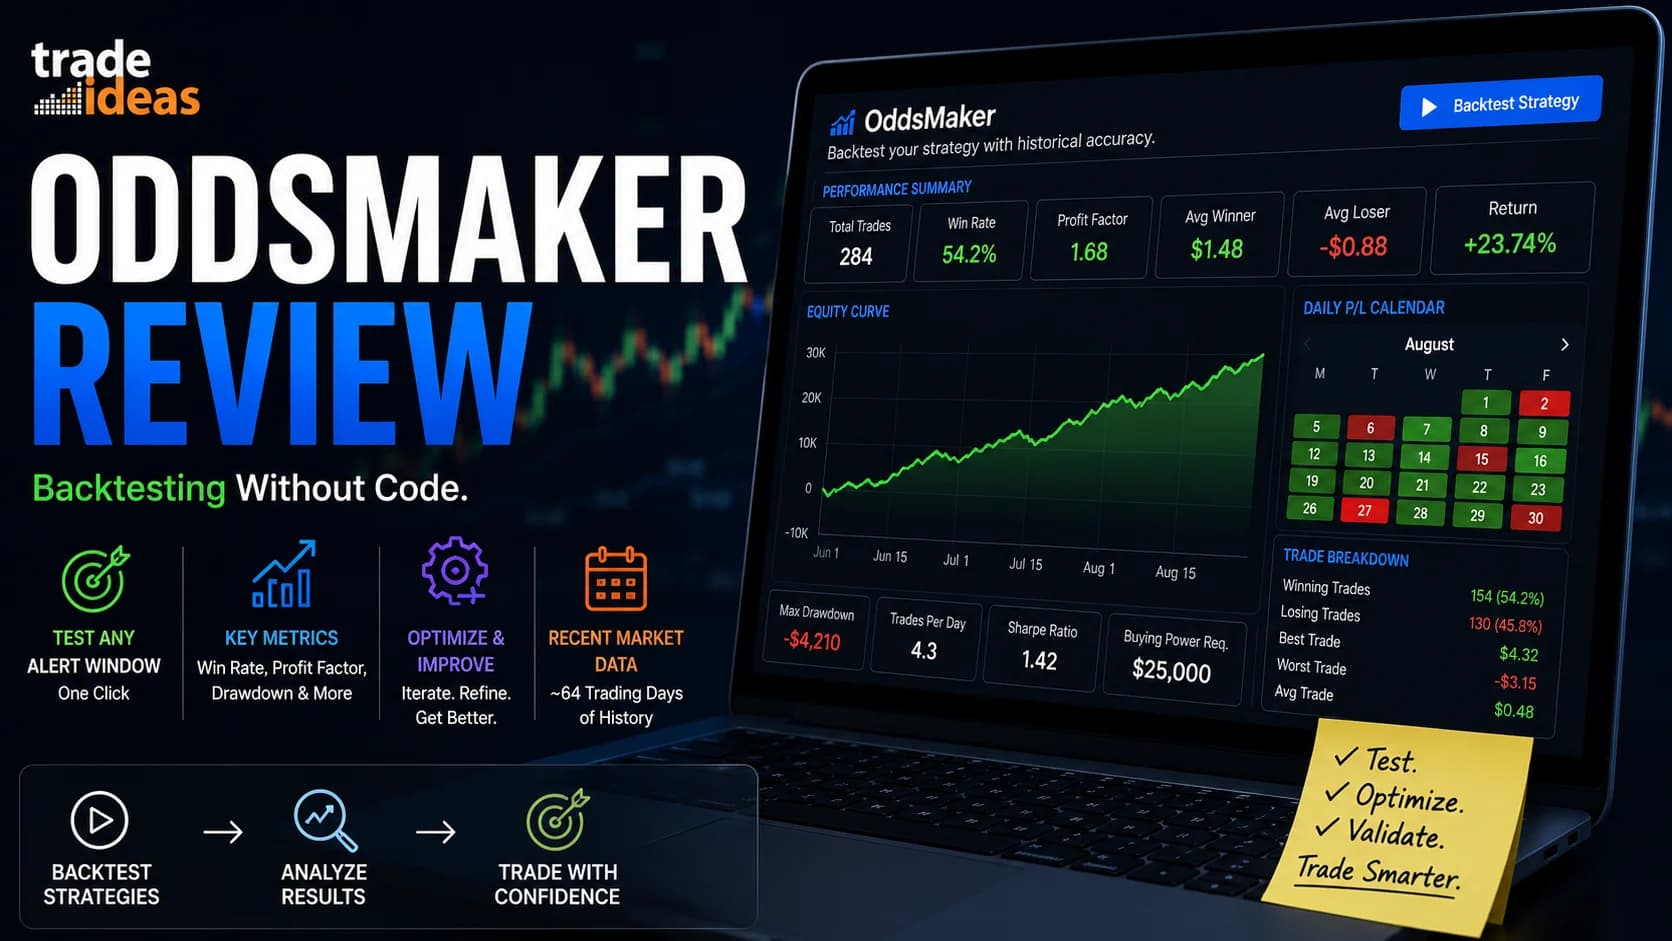
What is the Trade Ideas OddsMaker? OddsMaker is the no-code backtesting engine inside Trade Ideas. It tests any alert-window strategy against roughly the past 64 trading days of historical data, reporting Win RateWin rate is the percentage of your trades that result in a profit — calculated as (number of winning trades ÷ total trades) × 100 — and while commonly cited as a measure of trading success, it means very little without also knowing the averRead definition →, Profit FactorProfit factor is the ratio of total gross profit to total gross loss across a set of trades — a profit factor above 1.0 means you're profitable overall, and a ratio of 2.0 means for every $1 lost, you've made $2, giving you a clear, single-Read definition →, Average WinnerAverage winner is the mean profit across all your winning trades — the number you compare against average loser to know whether your strategy actually has an edge.Read definition → versus loser, equity curve, and maximum DrawdownA drawdown is the peak-to-trough decline in account equity — it measures how far you've fallen from your high-water mark, either from a single losing trade or a series of losing trades.Read definition → — so a scan can be evaluated statistically before it's traded with real capital. It's included in the Premium tier.
What Makes OddsMaker Different: Event-Based Testing
Most backtesting tools are time-series machines: they march through historical bars and evaluate a rule at fixed intervals. OddsMaker works the way day trading setups actually work — it tests events. The question it answers is: every time this specific thing happened (a 15-minute range break, a volume-confirmed surge, a stock crossing a moving average), what happened next, and would trading it under my rules have made money?
That's the right shape of question for scanner-driven trading, because your alert window already is an event definition. OddsMaker simply replays it: it takes the exact alerts and filters in your window, finds every historical occurrence in its database, applies your entry and exit rules to each one, and aggregates the results. The strategy you test is literally the strategy you'd trade — same alerts, same filters, same window — which eliminates the translation errors that plague code-it-yourself backtesting.
Access is deliberately trivial: right-click any alert window and select Backtest Strategy. Every scan in our momentum scan recipes is one right-click away from its own report card, and the same works per-strategy inside a Multi-Strategy window.
Running Your First Backtest
The configuration menu asks you to define what "taking the trade" means, and each setting is a real trading decision in miniature:
Direction — long or short: are you buying these alerts or fading them? (Testing both directions on the same alert is legitimately informative; some events are better faded than followed.)
Entry and exit rules — when the position opens after the alert and what closes it: a profit target, a time-based exit (hold for 30 minutes, exit at close), a stop loss, or combinations.
The stop worth knowing about: among the stop options is Trade Ideas' proprietary Wiggle — a volatility-adjusted stop calculated from the stock's recent 15-minute volatility scaled by its relative volume at alert time. In plain terms, every stock gets its own statistically sized stop instead of an arbitrary flat amount, which prevents the classic backtest distortion where a fixed ten-cent stop strangles volatile names and barely registers on quiet ones.
Account realism — starting equity, position size, and broker commission, so the output reflects your actual trading scale rather than abstract percentages.
Hit Backtest, and the engine chews through its historical database — typically about 64 trading days, roughly three months of recent market behavior — and returns the verdict in seconds to minutes depending on how often your event fires.
One design choice worth understanding: that ~64-day window is short by traditional backtesting standards, and it's partly a feature. Day trading setups live and die by recent market character — a scan that worked beautifully in last year's regime may be irrelevant in this one. OddsMaker is asking "does this work now," which is usually the day trader's actual question. The cost is that it cannot tell you how a strategy behaves across regimes, crashes, or different volatility eras — a limit to hold onto for later.
Reading the Results (And the Casino Principle)
The results window reports the numbers that matter: win rate, profit factor, average winner versus average loser, projected return, the equity curve your strategy would have produced, daily profit and loss, trades per day, maximum drawdown, and the buying power the strategy would have required. A color-coded calendar shows each day's outcome, and double-clicking any day reveals the individual trades behind it — which is where the real learning usually hides.
Three reading disciplines separate useful interpretation from self-deception:
Win rate means nothing alone. A 70% win rate with winners half the size of losers is a losing strategy; a 40% win rate with 3:1 winners is a good one. Read win rate and the winner/loser ratio as a pair, and let profit factor summarize the marriage. Our backtesting guide covers the metric relationships in depth.
Sample size is the credibility test. OddsMaker's own documentation explains this with a casino analogy worth internalizing: a casino owner can't predict any single spin of the roulette wheel, but across thousands of spins, the outcome is nearly certain. The engine's statistical confidence works the same way — it strengthens with the number of trades, and with too few results, OddsMaker won't even attempt the confidence analysis. A dazzling result built on nine trades is an anecdote wearing a lab coat. Look for strategies that fire enough to mean something.
Drawdown is the livability test. The equity curve and max drawdown tell you what holding this strategy would have felt like. A profitable strategy with a drawdown you'd have abandoned mid-slump is, in practice, a losing strategy — because you would have quit it at the bottom.
And read the individual trades. The calendar drill-down is underused: scanning the actual entries — which stocks, what times, what the wins and losses have in common — routinely reveals things the aggregates hide, like a strategy whose entire profit came from two outlier trades, or one that only wins before 10:30 AM.
The Optimization Loop: Power and Poison
Here's where OddsMaker becomes genuinely powerful, and where it becomes dangerous, in the same feature.
The loop: run a backtest, examine how each filter impacts the results, adjust a value — tighten the relative volume floor, raise the price minimum, narrow the time window — and re-run. The platform surfaces which filters are adding edge and which are dragging performance, making refinement a data-driven conversation instead of guesswork. Iterating a mediocre scan into a sharp one in an afternoon is a real and legitimately valuable workflow — this loop is how vague ideas become specified, testable setups.
The poison is overfitting, and it deserves the bluntest warning in this review. Iterate enough times against the same 64 days of history and you will eventually produce a strategy that scores brilliantly — because you've stopped discovering an edge and started memorizing the past. The historical data will happily reward parameters tuned to its accidents. The result backtests like genius and trades like a coin flip, minus commissions.
Practical defenses: prefer round, defensible parameter values over suspiciously precise ones (a relative volume floor of 2 is a thesis; 2.35 is a memory); demand that the logic of each filter makes trading sense independent of the score it produces; be suspicious when small parameter changes swing results wildly, which signals fragility rather than edge; and treat any optimized strategy as unproven until it survives the out-of-sample test that matters — forward performance in the simulator. Backtest hygiene is a discipline of its own, and our strategy development guide covers the fuller framework.
The Documented Limits (Trade Ideas' Own Fine Print)
To its credit, Trade Ideas documents OddsMaker's limitations with unusual candor. They matter enormously for interpreting results, so here they are, plainly:
It tests on 1-minute candles, not ticks. The engine works from open/high/low/close data of 1-minute bars, and the documentation states directly that you should expect discrepancies between test results and actual trading. Consequence: the faster your strategy, the less accurate the test — and the docs are explicit that OddsMaker is not designed for high-frequency or rapid scalping strategies. If your edge lives inside the one-minute bar, this tool can't see it.
It doesn't model the spread. Exit prices come from historical data with no bid-ask spread applied, and live trading offers no guarantee of those prices. Consequence: results are systematically optimistic, and the optimism scales with how wide-spread and illiquid your candidates are. A low-float scan's backtest deserves a heavier mental discount than a large-cap one's.
History is ~64 days, regular hours only. No pre-market, no post-market, no current-day data, and no deep history. Gap-and-go entries at 9:28 AM can't be tested; neither can regime durability.
Entry rules are mechanical and specific. The engine processes alerts earliest to latest, takes one position per symbol per day (fresh each day), and caps at 100 positions daily — the same discipline structure the auto-trading layer uses. Your live behavior will differ from this mechanical taker-of-every-alert, which is another quiet source of test-versus-live divergence.
None of these limits makes OddsMaker weak — they make it scoped. Within its scope (intraday event strategies on liquid stocks, held minutes to hours, evaluated on recent market character) it's a legitimately excellent instrument. Outside that scope, its numbers deserve escalating skepticism.
The Workflow That Makes It All Work
Trade Ideas' documentation prescribes the sequence itself, and it's the right one: backtest and optimize first, then paper trade under real market conditions, and only then go live.
OddsMaker is deliberately the first gate, not the only one. The simulator — running the identical strategy against live data through Brokerage Plus — is the out-of-sample test that catches what the backtest can't: the spread, the fills, the current market's mood, and your own behavior. A strategy that survives both gates has earned real consideration; a strategy that only survived the first has earned a paper-trading account. The handoff is built in: a backtested alert window loads directly into Brokerage Plus for simulated (and eventually automated) execution, with settings importing from the backtest.
That pipeline — scan, backtest, simulate, automate — is, frankly, the strongest argument for the platform as a system rather than a collection of features. It's the retail version of the discipline quantitative firms institutionalize: no strategy touches capital until the data has voted on it twice.
Who OddsMaker Is For (And the Cost Question)
OddsMaker requires the Premium tier — it's part of the AI-and-testing stack alongside Holly rather than the base scanning package. That makes the cost question really a question about your process: if you build or modify your own scans (which describes most serious platform users within a few months), the backtester is what separates "I built a scan" from "I built a scan and know whether it's worth trading" — arguably the highest-value discipline the platform enables. If you exclusively trade pre-built channels or Holly's already-backtested signals, you'll touch it rarely, and it shouldn't drive your tier decision alone.
The evaluation path is the usual one: the periodic low-cost Test Drive includes full Premium access — enough time to backtest every scan you'd actually trade — current pricing and codes live on the deals page, and the full platform verdict is in our Trade Ideas review. You can explore Trade Ideas here.
Frequently Asked Questions
How accurate is the Trade Ideas OddsMaker?
Trade Ideas' own documentation states you should expect discrepancies between backtest results and live trading. The two structural sources of optimism are candle-based pricing (real fills happen inside the bar, not at its printed prices) and the absent spread, which costs you on every round trip in live trading. Both distortions grow as your stocks get thinner and your holds get shorter.
Key Takeaway: Treat OddsMaker results as an upper bound, and discount them more heavily for low-float and fast-scalping strategies.
Can OddsMaker backtest scalping strategies?
Because the engine works from 1-minute OHLC data, any strategy whose entries and exits live inside the one-minute bar is invisible to it at the resolution that matters. Strategies with holds measured in many minutes to hours test meaningfully; strategies measured in seconds don't. For scalping approaches, the built-in simulator on live data is the honest testing ground.
Key Takeaway: Minutes-to-hours strategies backtest well; seconds-scale strategies need the simulator instead.
How much history does OddsMaker test against?
The short window is a deliberate trade-off: it answers "does this setup work in the current market character," which is usually the day trader's real question, at the cost of saying nothing about durability across regimes. A strategy validated on 64 days of a quiet bull tape carries no warranty for a high-VIX regime — re-testing when market character shifts is part of using the tool properly.
Key Takeaway: OddsMaker measures now, not forever — re-run your strategies when the market's personality changes.
What is the Wiggle stop in OddsMaker?
The problem it solves is real: a flat stop amount is simultaneously too tight for volatile stocks (stopping out on noise) and too loose for quiet ones (risking more than needed). Testing with the Wiggle produces more honest results across a mixed universe of stocks, and it's worth comparing the same strategy tested with a flat stop versus the Wiggle — the difference itself is informative about how volatility-sensitive your setup is.
Key Takeaway: Volatility-adjusted stops make backtests across diverse stocks meaningfully more realistic than any flat-stop assumption.
What's a good win rate in OddsMaker results?
A 45% win rate with winners twice the size of losers is comfortably profitable; a 70% win rate with losers twice the size of winners bleeds money. Profit factor summarizes the pair, the equity curve and max drawdown tell you whether you could psychologically survive holding the strategy, and the sample size determines whether any of it is statistically believable at all.
Key Takeaway: Judge the metric ensemble, never the win rate alone — and distrust any result built on a small handful of trades.
How do I avoid overfitting when optimizing in OddsMaker?
The optimization loop rewards iteration, and unlimited iteration against a fixed 64 days of history eventually produces a strategy that has memorized that history rather than found an edge. The tell-tale signs are hyper-specific parameters, fragility to small adjustments, and performance concentrated in a few outlier trades — all visible if you look for them in the calendar drill-down.
Key Takeaway: The simulator is your out-of-sample test — no optimized strategy is real until it survives forward performance on live data.
Is OddsMaker included in the Basic plan?
The tier placement effectively decides itself by trader type: if you build or modify your own scans, the backtester is the discipline layer that makes those scans trustworthy, and it's a core reason to be on Premium. If you trade only pre-built channels or Holly's signals — which arrive already backtested nightly by the platform — you'd use OddsMaker rarely.
Key Takeaway: Scan-builders should count OddsMaker in the Premium value math; signal-followers can weight it lightly — current tier pricing is on the deals page.
Does a good backtest mean the strategy will make money?
Between a green backtest and live profits sit the untested factors: the spread and slippage the engine doesn't model, market regime changes the 64-day window can't see, the difference between the mechanical take-every-alert tester and your actual behavior, and plain statistical luck in small samples. That's precisely why Trade Ideas itself prescribes the three-gate sequence — backtest, then paper trade in real conditions, then live.
Key Takeaway: A backtest earns a strategy a simulator audition, not a capital allocation — no testing tool guarantees profits.
Disclaimer
Article Sources
- Trade Ideas User Guide — OddsMaker Backtesting - official documentation of the metrics reported, configuration options, 1-minute candle basis, spread limitation, and the recommended backtest-simulate-live sequence.trade-ideas.com
- Trade Ideas User Guide — Backtest Strategy - the entry rules, ~64-day history window, regular-hours-only scope, and per-symbol position mechanics.trade-ideas.com
- Trade Ideas — OddsMaker User's Manual - the statistical confidence ("Casino Factor") methodology, alert processing order, and the 100-position daily cap.trade-ideas.com
- Trade Ideas — Backtesting Features Overview - the event-based testing approach and filter optimization capabilities.trade-ideas.com
- Technical Analysis of Stocks & Commodities — Trade Ideas Traders' Tips - the Wiggle stop methodology (15-minute volatility scaled by relative volume).trade-ideas.com