A stock that breaks its high of day once might just be having a good morning. A stock that breaks it, consolidates, and breaks it again — repeatedly, through the session — is showing something more specific: a pattern of genuine buyers stepping in every time a prior ceiling gives way. This guide covers trading that specific, repeatable signature rather than the vaguer instinct to buy any stock making a new high.
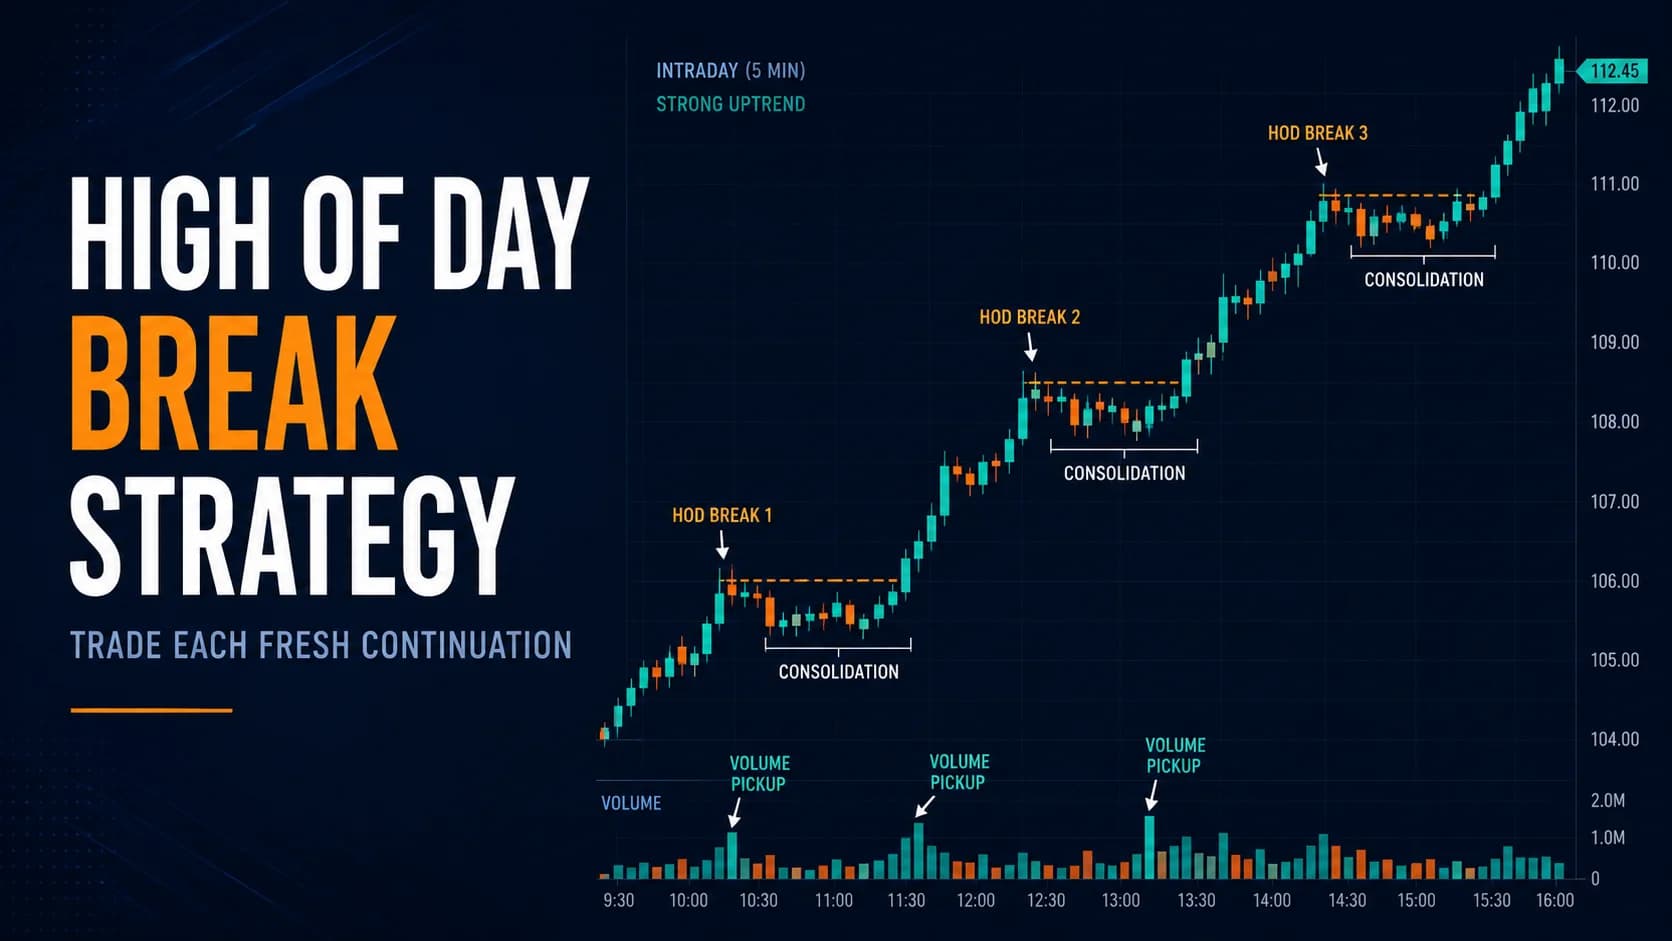
What is the high of day break strategy? The high of day break strategy involves entering a stock as it breaks above its prior intraday high following a period of ConsolidationConsolidation is a period where price moves sideways within a relatively tight range after a directional move — it reflects a temporary equilibrium between buyers and sellers before the next move.Read definition →, betting that the break signals genuine continuation rather than a temporary spike. A single trending session can produce several tradable HODHOD stands for High of Day — the highest price a stock has reached in the current regular trading session, often used as a key breakout level for momentum traders.Read definition → breaks in sequence, each treated as its own discrete signal.
Why This Is a Specific Trigger, Not a General Breakout Tutorial
This hub covers BreakoutA breakout is when price moves decisively beyond a defined level — a resistance zone, a consolidation boundary, a chart pattern boundary, or a prior high — suggesting that the previous supply at that level has been overcome.Read definition → mechanics broadly elsewhere — how to tell a genuine breakout from a FakeoutA fakeout is when price briefly breaks through a key level — appearing to confirm a breakout or breakdown — but immediately reverses, trapping traders who entered on the apparent move.Read definition →, why VolumeVolume is the total number of shares (or contracts) traded during a given time period — it's the primary confirmation tool for all price action, because a price move accompanied by high volume indicates genuine market participation, while tRead definition → confirmation matters, and how a retest of a broken level works. Readers who need that foundation should start with this hub's dedicated breakout versus fakeout guide before this deeper treatment, since this guide assumes that groundwork and focuses specifically on one trigger: the stock's own intraday high.
What makes the high of day a distinct level worth its own setup is that it's the single most visible, unambiguous reference point on an intraday chart. Unlike a support or resistance level requiring some judgment to identify, the high of day is an objective number every participant watching the stock can see identically, which is part of why breaking it tends to draw in fresh buying rather than just marking an arbitrary price. Readers who need the basics on support and resistance should start there before this deeper treatment.
The Research Behind Trading a Fresh High
Academic research on intraday momentum is directly relevant here. Gao, Han, Li, and Zhou's 2018 study, covered in more depth in this hub's general momentum guide, found that strong early-session returns carry genuine predictive information about the rest of the session, particularly on higher-volume, higher-volatility days — consistent with a stock that's already shown strength by breaking one high having a real, measurable tendency to keep showing it.
A related but distinct body of research covers a much longer timescale worth understanding honestly rather than overstating. George and Hwang's landmark 2004 study found that a stock's proximity to its 52-week high — a single, widely visible reference point — explains a large share of momentum profits over subsequent months, more so than past returns alone, because a visible price level serves as a psychological anchor that traders underreact to. That finding has been broadly replicated internationally. It's also been tested with mixed results in some markets and periods — one study on the Australian market found the effect worked only among genuinely liquid stocks and reversed sign among illiquid ones, and a partial U.S. replication using more recent data than the original study found weaker results, plausibly because faster information diffusion in modern markets has eroded some of the original anchoring effect.
The honest takeaway: the 52-week-high version of this idea operates on a monthly timescale and has a mixed, evolving replication record, so it should be read as a related analog for why a visible high acts as an anchor — not as direct proof that an intraday high of day behaves identically. The core mechanism (a visible reference level draws attention and trading activity once broken) is a reasonable basis for this setup; the specific monthly-horizon statistics are not.
What Separates a Genuine HOD Break From a Random Spike
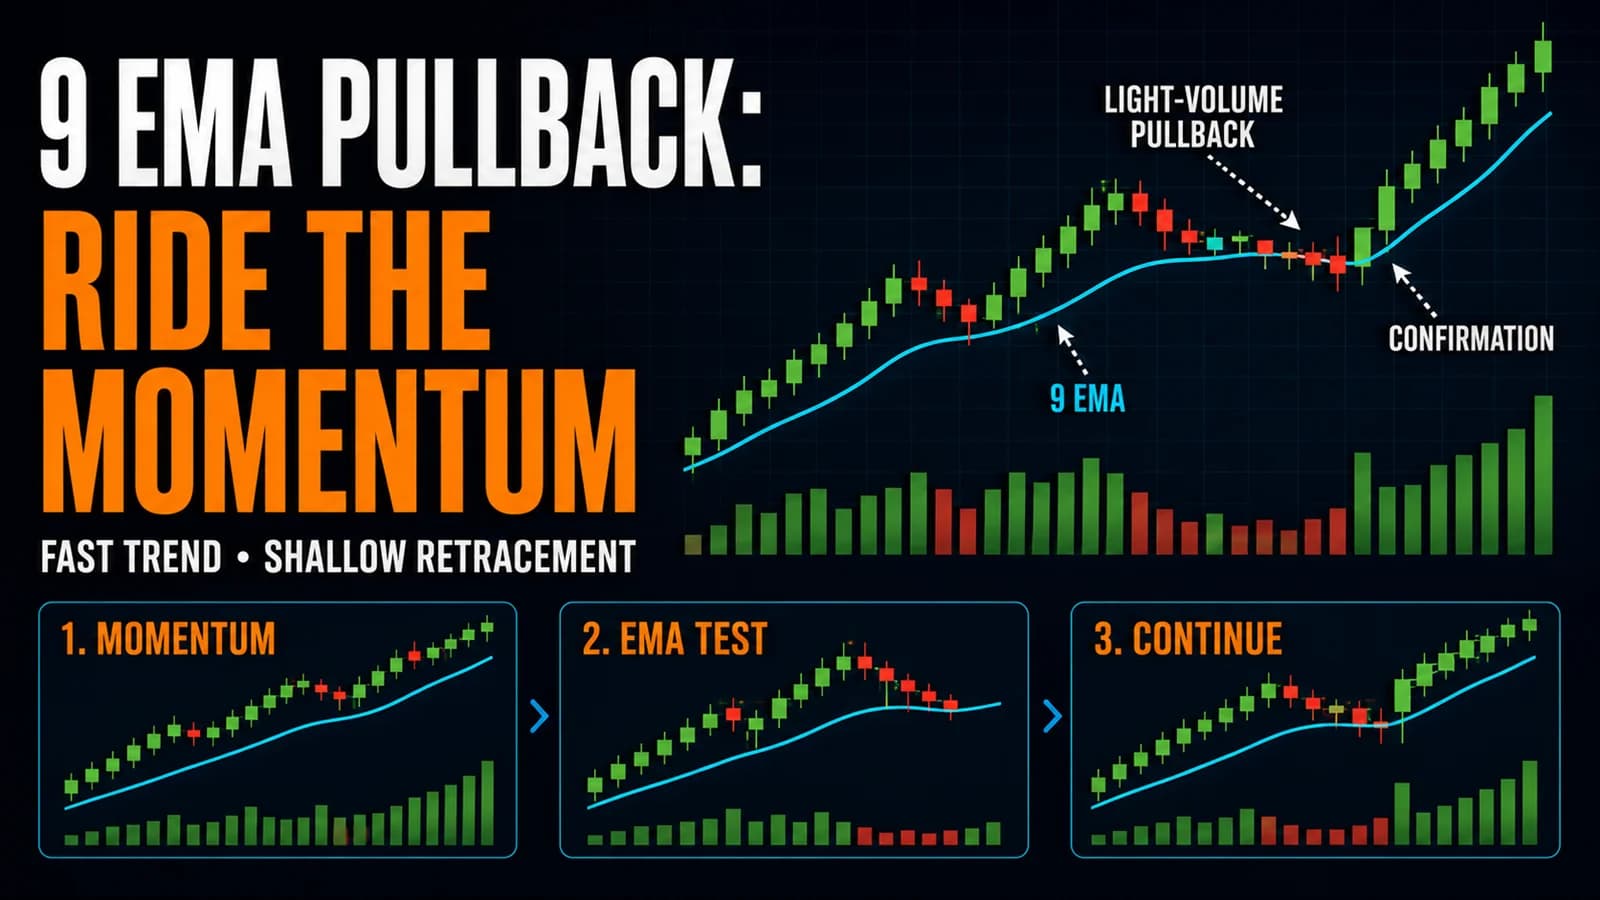
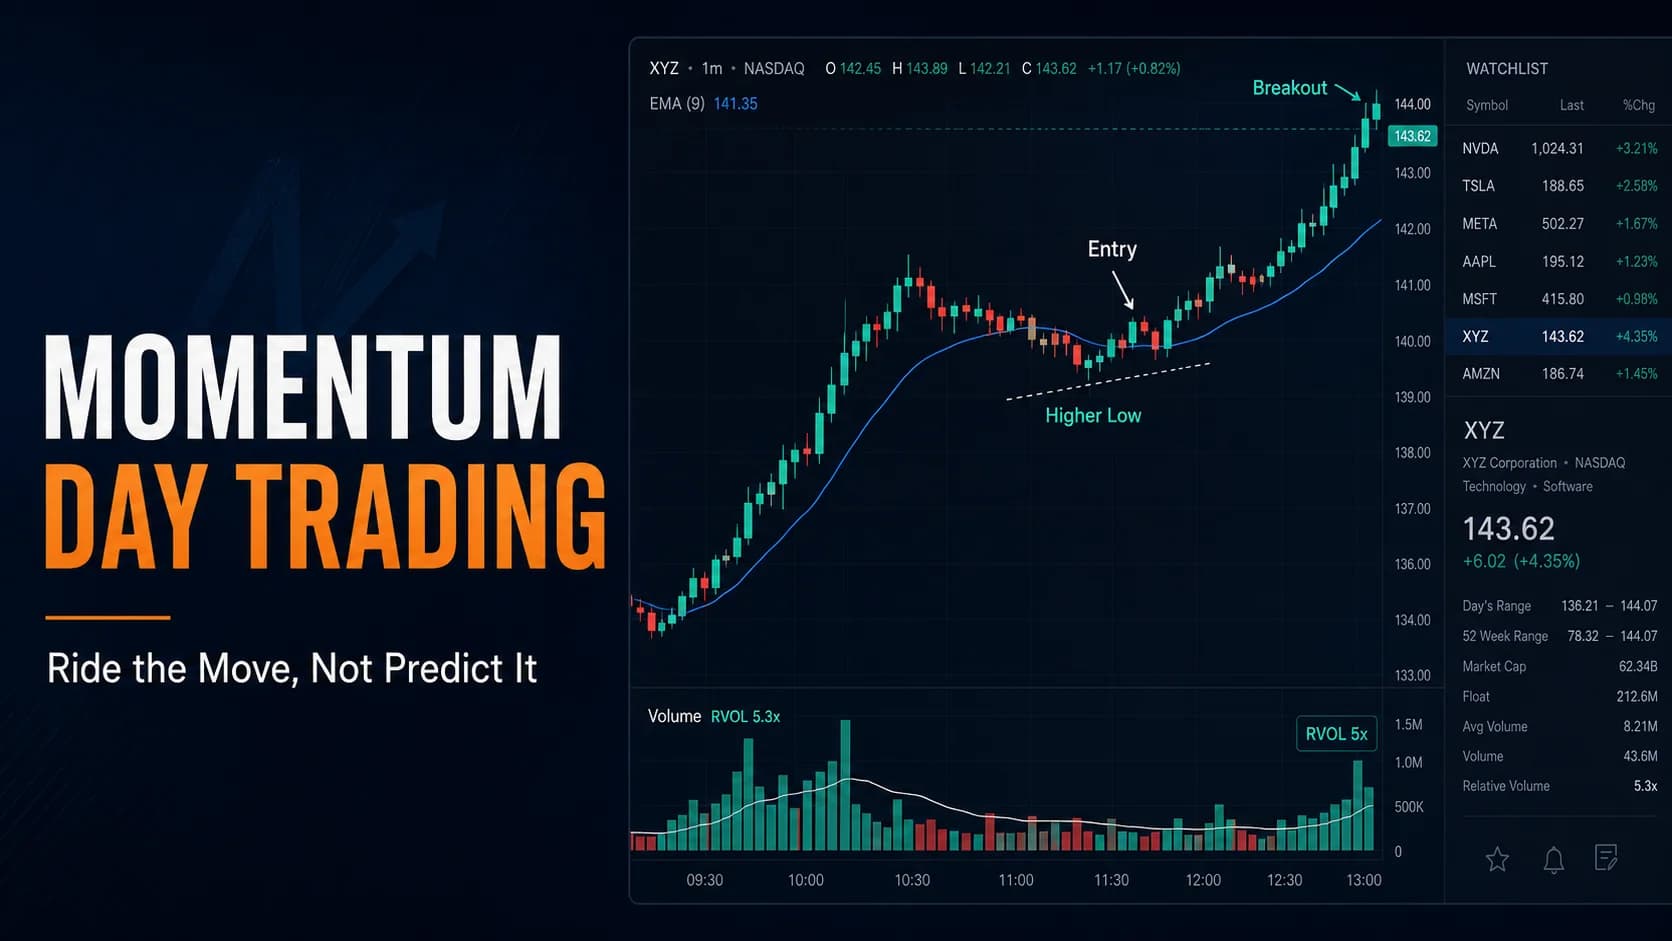
A break of the high of day means little on its own if it isn't preceded by a real consolidation — a period where price paused, built a base, and held above a reasonable level rather than simply spiking once and immediately giving the move back. That consolidation is what creates the actual "break" for a fresh set of buyers to react to; a stock that never pauses doesn't have a clean level for this setup to trigger against in the first place.
Volume confirmation matters as much here as in any other breakout context this hub covers. A break of the high of day on volume that's actually declining relative to the move that created the original high is a weaker signal than a break accompanied by a fresh pickup in volume — consistent with the broader price-volume relationship this hub applies throughout its reversal and momentum content alike. This distinction matters more with each successive break in a session: the first break often comes on the session's freshest, most enthusiastic volume, while later attempts need their own independent volume confirmation rather than borrowing credibility from the earlier, genuinely strong move.
The Setup Specification: Eight Rules for Trading the Break
Every component below is a hard rule for identifying and trading a genuine HOD break rather than chasing an arbitrary new high.
- Component
- Market Conditions Required
- Rule
- An established intraday uptrend with at least one prior push to a high, followed by a real consolidation that holds well above the base of that move rather than round-tripping it.
- Component
- Time of Day
- Rule
- Can develop at any point in the session; particularly reliable in the first two hours, though a strongly trending day can produce repeated HOD breaks well into the afternoon.
- Component
- Stock Selection Criteria
- Rule
- Elevated relative volume, a real catalyst or clearly sustained buying interest, and a genuine tightening consolidation — not just a random pause — before the break.
- Component
- Entry Trigger
- Rule
- Enter as price breaks and holds above the prior high of day on a fresh volume pickup, or more conservatively on the first pullback afterward that holds above the old high, now acting as support.
- Component
- Stop Loss
- Rule
- Below the low of the consolidation that preceded the break, or below the reclaimed prior high for the retest version of the entry.
- Component
- Initial Profit Target + Scaling
- Rule
- A measured-move target — the height of the prior consolidation added to the breakout level — as a first reference, scaling into continued strength beyond that.
- Component
- Trade Management
- Rule
- Trail the stop behind each new consolidation low; treat every subsequent HOD break during the same session as a fresh, independent continuation signal.
- Component
- Invalidation Criteria
- Rule
- A failure to hold above the just-broken prior high — price falling back into the range it just escaped invalidates the setup immediately.
| Component | Rule |
|---|---|
| Market Conditions Required | An established intraday uptrend with at least one prior push to a high, followed by a real consolidation that holds well above the base of that move rather than round-tripping it. |
| Time of Day | Can develop at any point in the session; particularly reliable in the first two hours, though a strongly trending day can produce repeated HOD breaks well into the afternoon. |
| Stock Selection Criteria | Elevated relative volume, a real catalyst or clearly sustained buying interest, and a genuine tightening consolidation — not just a random pause — before the break. |
| Entry Trigger | Enter as price breaks and holds above the prior high of day on a fresh volume pickup, or more conservatively on the first pullback afterward that holds above the old high, now acting as support. |
| Stop Loss | Below the low of the consolidation that preceded the break, or below the reclaimed prior high for the retest version of the entry. |
| Initial Profit Target + Scaling | A measured-move target — the height of the prior consolidation added to the breakout level — as a first reference, scaling into continued strength beyond that. |
| Trade Management | Trail the stop behind each new consolidation low; treat every subsequent HOD break during the same session as a fresh, independent continuation signal. |
| Invalidation Criteria | A failure to hold above the just-broken prior high — price falling back into the range it just escaped invalidates the setup immediately. |
The "every subsequent break is a fresh signal" component of trade management is what separates this setup from a one-time breakout trade. A strongly trending session can produce a first HOD break, a consolidation, a second break, another consolidation, and a third — each one is a legitimate opportunity to enter or add, evaluated against the same criteria as the first, rather than assuming the trend is exhausted just because it already broke out once.
The invalidation rule is intentionally strict. A genuine break holds; a break that immediately fails and falls back into the prior range is showing exactly the opposite of what this setup requires, and treating that failure as a minor pullback to hold through is how a clean, disciplined setup turns into an open-ended loss.
A Minute-by-Minute Walk-Through: Trading Consecutive Breaks in a Hypothetical Stock
Consider a hypothetical mid-cap stock, ticker BCD, with no overnight gap, beginning an intraday move on a mid-morning analyst upgrade. None of the prices or events below are real; they're constructed to show the mechanics in action.
BCD opens at $20.00 and trades in a quiet range through the first 45 minutes. At 10:15 AM, the upgrade hits, and BCD jumps to $21.50 on a clear pickup in volume — the session's first high of day. From 10:20 to 10:40, BCD consolidates in a tight $21.20 to $21.50 range, holding well above where the move began rather than giving it back.
At 10:41, BCD breaks above $21.50 on renewed volume, running to $22.30. An entry triggers on that break around $21.55, or more conservatively on a pullback that holds $21.50 as support, with a stop below the $21.20 consolidation low.
BCD consolidates again between $21.90 and $22.30 through 11:00 to 11:20 — a second base. At 11:21, it breaks above $22.30 on another volume pickup, running to $23.50. That second break is treated as its own fresh signal: a trader already in the position can add here, and a trader who missed the first break has a legitimate second entry point, evaluated against the same consolidation-and-volume criteria as the first.
In the early afternoon, BCD attempts a third break above $23.50, briefly touching $23.80 — but volume fails to pick up meaningfully, and price falls back into the prior $22.90 to $23.50 range within minutes. That failure invalidates the third attempt specifically; a position still open from the first two breaks trails its stop behind the most recent consolidation low rather than assuming the third failed attempt dooms the whole trade.
Managing the Position Across Multiple Breaks
Trail the stop behind each new consolidation low as the session develops, treating a failed break as a reason to tighten management on the current position rather than necessarily exiting entirely — the difference depends on whether the stop from an earlier, successful break has already been protected.
The clearest discipline this setup demands: evaluate each new HOD break attempt on its own mechanical merits — real consolidation, volume pickup, a clean hold above the prior high — rather than assuming momentum alone guarantees the next attempt succeeds just because the last two did.
Where This Strategy Fails: The Break That Doesn't Hold
The dominant failure mode is treating a spike through the high of day as confirmation when it hasn't actually held. A stock can tag a new intraday high for a moment, on thin volume, and fall right back into its prior range within the same candle — that's not a genuine break, and entering on the tag alone rather than waiting for it to hold is how this setup produces its most avoidable losses.
A second failure mode is chasing a break that's already extended well past a reasonable entry, well after the volume pickup that would have justified it. This hub's general momentum framework covers this same trap directly — the entry belongs at the break or its retest, not well after the move has already run.
A third, more structural risk: a session that's produced two or three genuine HOD breaks has, by definition, already moved a meaningful distance, and each subsequent attempt has a smaller pool of remaining buyers behind it in principle. This is precisely why the setup's own invalidation rule — a clean, unhesitating exit on a failed hold — matters more with each successive attempt, not less.
Adapting the Setup Across Timeframes and Instruments
The core logic scales across timeframes: a 1-minute or 5-minute chart suits fast-moving, more volatile names, while a 15-minute chart smooths out noise for steadier movers, with the consolidation-and-break structure translating directly regardless of which timeframe is in use.
This setup applies in mirror image to a low of day break for a short position — a stock consolidating below a prior low, then breaking further down on renewed volume, using the identical entry, stop, and invalidation logic. It also pairs naturally with this hub's Gap and Go strategy when a stock has gapped: the pre-market high often becomes the first high of day tested at the open, and subsequent breaks above that level follow the exact mechanics covered here.
Scanning for Active HOD Break Candidates
Manually watching a broad list of stocks for a consolidation-then-break pattern in real time isn't practical without a scanning tool built for the job. A useful scan filters for stocks showing elevated relative volume and a recent tightening range near their intraday high, flagging candidates worth watching closely for the actual break.
Trade Ideas is built to run this kind of real-time scan as a comprehensive scanning and research platform, surfacing momentum names with volume and consolidation characteristics alongside built-in charting to confirm the setup visually. The scan narrows the field to genuine candidates; confirming the actual break and its volume still governs the entry.
Sizing the HOD Break Trade Inside a Broader Plan
This setup inherits the same sizing discipline as the rest of this hub's momentum-adjacent content: risk defined in R-multiples against the actual stop level — the consolidation low or reclaimed prior high — rather than a fixed share count applied regardless of the setup.
The psychological challenge scales with each successive break in a session: after two or three successful HOD breaks, it's tempting to treat every subsequent attempt as equally likely to succeed, when in fact each one deserves the same fresh scrutiny as the first. This hub's guide to trading discipline covers the broader habit of evaluating each trade on its own merits rather than riding a streak of confidence into a weaker setup. This strategy belongs on the Strategies Hub as a specific, level-based application of momentum trading — useful precisely because it gives a single, visible price level to organize entries around, rather than a vaguer sense that a stock is "still going."
Common Questions About Trading the High of Day Break
How is this different from the general breakout content covered elsewhere on this hub?
The mechanics of confirming a genuine break — volume, a real consolidation, a clean hold — are shared with this hub's broader breakout content. What's specific here is treating the high of day as a repeatable, session-long reference level rather than a single one-time event.
Key Takeaway: This guide is a specific application built on the broader breakout principles covered elsewhere, not a replacement for that foundational content.
Why does the high of day work as a trigger better than an arbitrary price level?
That shared visibility is part of why breaking it tends to draw in fresh buying interest specifically, rather than just marking a price that happens to look significant to one particular trader's chart.
Key Takeaway: The high of day's power as a trigger comes partly from how universally visible and unambiguous it is, not just from the price level itself.
Can a stock produce more than one tradable HOD break in a single session?
A session with two or three genuine, volume-confirmed breaks is showing a different, more durable pattern than a single spike that never repeats, though each successive attempt deserves the same fresh scrutiny rather than assumed success.
Key Takeaway: Treat each HOD break as its own trade, not as automatic proof the next one will work the same way.
What's the most common reason a HOD break trade fails?
This is exactly why the entry rule requires the break to hold, either through the initial move itself continuing on volume or through a retest that holds the old high as new support, rather than acting on the tag alone.
Key Takeaway: A momentary spike above the high of day isn't the signal — a held break, confirmed by volume, is.
Does this setup require a specific news catalyst?
Consistent with this hub's broader momentum research, a catalyst-driven break generally deserves somewhat more confidence than a purely technical one, though both can produce the same consolidation-and-break signature in the moment.
Key Takeaway: A catalyst is a confidence booster, not a strict requirement for this setup to apply.
How does volume confirm a genuine HOD break specifically?
This is the same price-volume relationship this hub applies throughout its momentum and reversal content, applied specifically to the moment a prior high gives way rather than to a broader climax or exhaustion signature.
Key Takeaway: Check whether volume is actually picking up at the break, not just assume it is because price is moving.
Does the strength of the 52-week-high research actually apply to an intraday high of day?
The more directly relevant research is work specifically on intraday momentum, which operates on the same compressed timescale this setup actually trades.
Key Takeaway: Treat the 52-week-high literature as background context for why visible levels matter, not as a direct statistical basis for the intraday version of the idea.
How is this different from trading a prior day's high or low?
Both are legitimate reference levels this hub covers, but they serve different roles — one as a pre-session planning level, the other as a live, evolving trigger throughout the day.
Key Takeaway: The high of day is a moving target that resets with every new high, unlike a fixed level set before the session began.
Can this setup be combined with the Gap and Go strategy covered elsewhere on this hub?
The two setups aren't competing frameworks in that scenario; Gap and Go covers the specific opening-bell entry, and this guide's mechanics take over for any further breaks that develop as the session continues.
Key Takeaway: A gapping stock can transition directly from a Gap and Go setup into a HOD break setup as the session develops past the open.
Should position size stay the same across a first, second, and third HOD break in the same session?
This isn't a hard rule so much as a reasonable adjustment: the mechanical criteria (consolidation, volume, a held break) still have to be met for any attempt to qualify, but sizing more conservatively on a third or fourth break in the same session reflects the genuinely different risk profile of chasing a move that's already extended further than the first one did.
Key Takeaway: Apply the same entry criteria to every break, but consider reducing size as a session's cumulative move grows larger.
Disclaimer
Article Sources
- Gao, Han, Li & Zhou (2018), "Market Intraday Momentum", Journal of Financial Economics - documents that strong early-session returns carry genuine predictive information about the rest of the sessionsciencedirect.com
- George & Hwang (2004), "The 52-Week High and Momentum Investing", The Journal of Finance - establishes the underlying anchoring mechanism behind why a visible high draws trading activity once broken, on a monthly timescale distinct from this guide's intraday applicationonlinelibrary.wiley.com
- Karpoff (1987), "The Relation Between Price Changes and Trading Volume: A Survey", Journal of Financial and Quantitative Analysis - the empirical basis for reading a volume pickup as confirmation alongside a genuine price breakcambridge.org