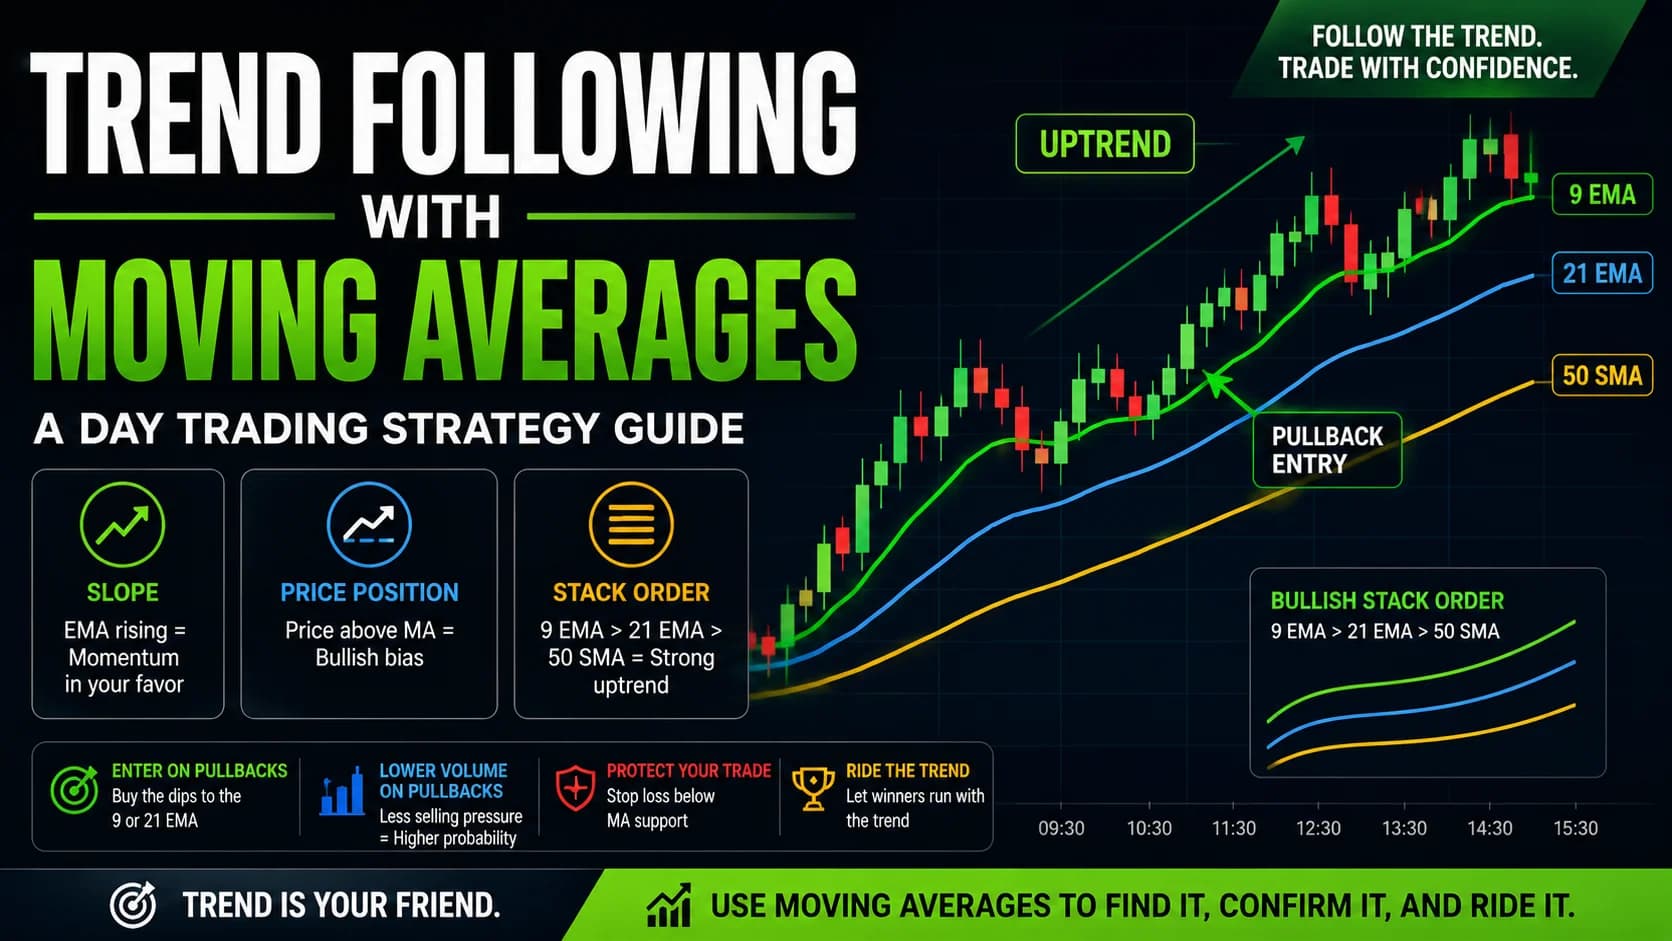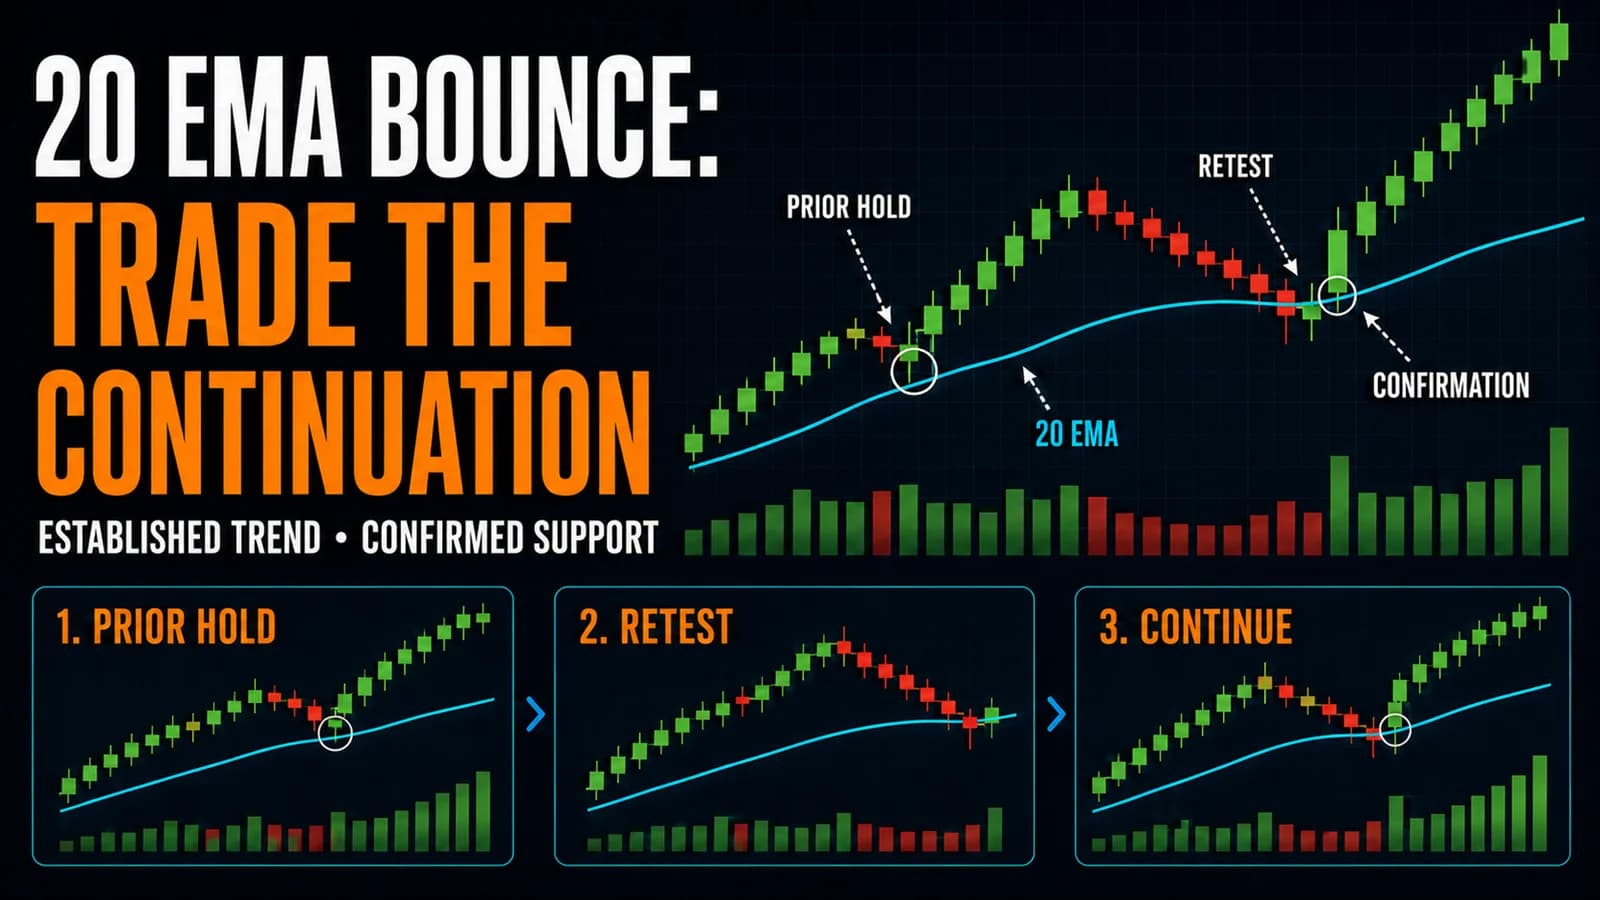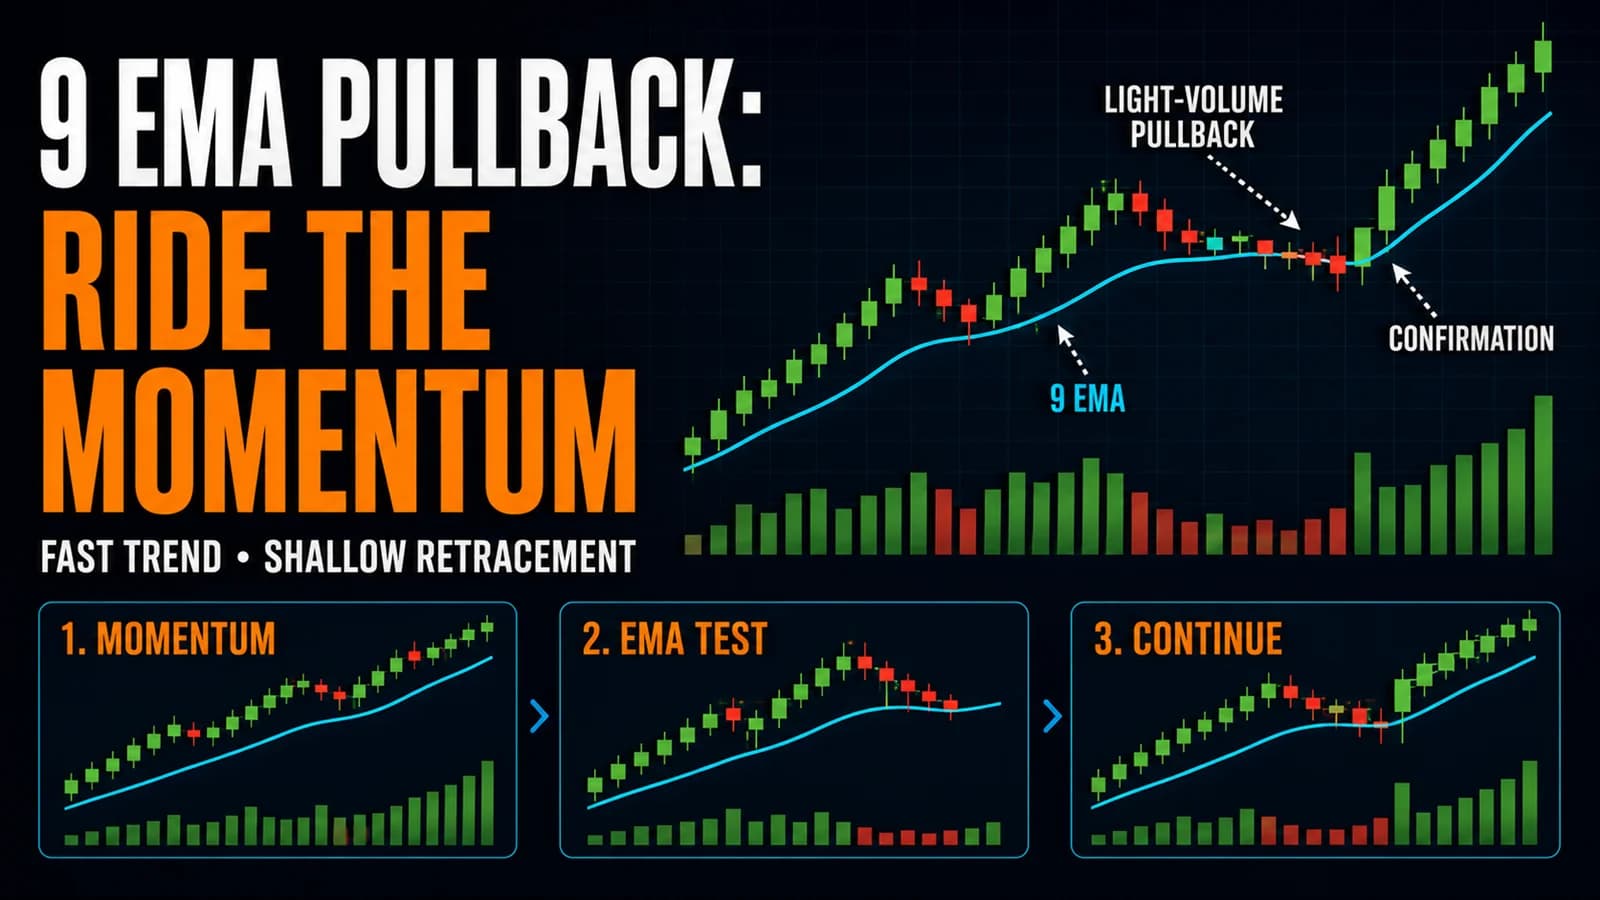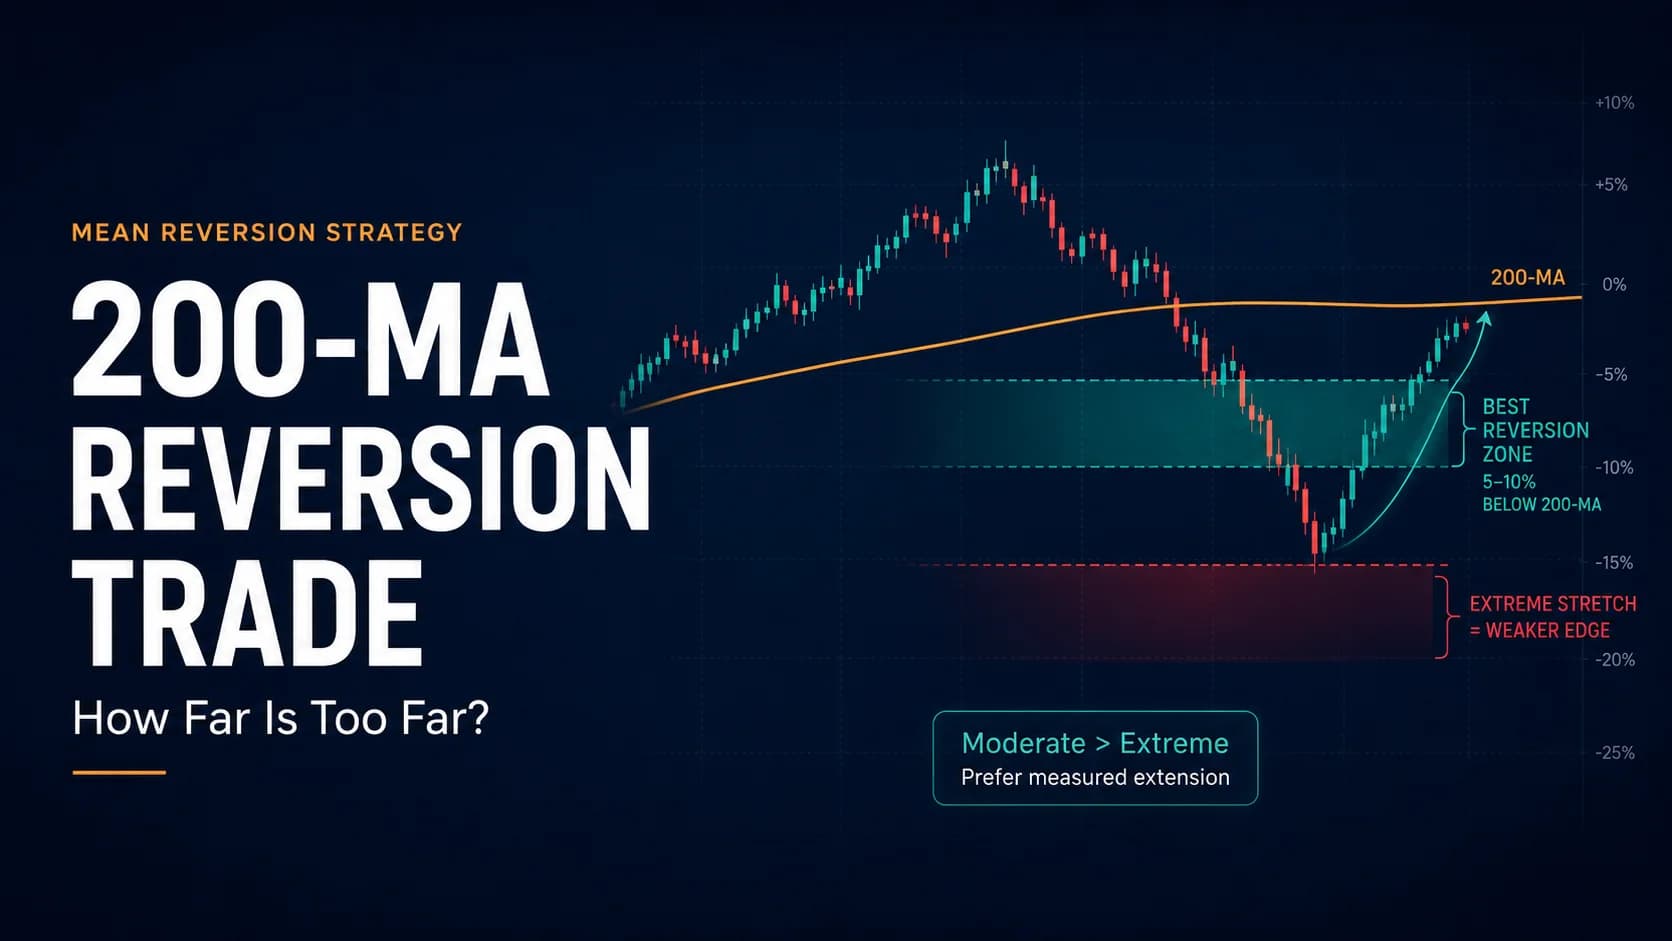
Most traders assume the further a stock stretches from its 200-day Moving AverageA moving average smooths out price data by calculating the average closing price over a set number of periods — it filters out noise and identifies the trend direction, with the stock above the MA interpreted as bullish and below as bearishRead definition →, the bigger the eventual snapback. The actual research says close to the opposite: stocks trading modestly below their 200-day average have historically produced the strongest subsequent returns, while the most extreme stretches — the ones that look like the most dramatic opportunities — have produced the worst. That single finding changes how this classic setup should actually be traded.
What is the 200-MA reversion trade? The 200-MA reversion trade involves buying (or shorting) a stock once it has stretched a meaningful but not extreme distance from its 200-day moving average, on the premise that price tends to drift back toward that long-term reference level after becoming overextended. Unlike a TrendA trend is a sustained directional movement in price over time — an uptrend is characterized by a sequence of higher highs and higher lows, a downtrend by lower highs and lower lows — and correctly identifying the current trend direction isRead definition →-following signal, it bets on a snapback toward the average, not continuation away from it.
Why This Is a Distance Trade, Not a Golden Cross Signal
The 200-day moving average shows up in two completely different kinds of trading logic, and this hub's setup is only one of them. The far more commonly discussed version is the Golden CrossA golden cross is a bullish technical signal that occurs when a shorter-term moving average (typically the 50-day SMA) crosses above a longer-term moving average (typically the 200-day SMA) — it signals a potential shift from bearish to bulRead definition → and Death CrossA bearish technical signal that occurs when a shorter-term moving average crosses below a longer-term moving average — most commonly when the 50-day moving average crosses below the 200-day moving average. It signals that intermediate-term Read definition → — watching for a shorter moving average (often the 50-day) to cross above or below the 200-day as a trend-following signal. That's a statement about direction: the crossover argues the trend has changed and price should continue in the new direction.
This strategy asks a completely different question. Readers who need a refresher on moving averages generally should start there before this section. This setup doesn't care whether a crossover has happened at all. It asks how far current price has stretched away from the 200-day average itself, and treats that distance — not a crossover, not a candle shape, not a VolumeVolume is the total number of shares (or contracts) traded during a given time period — it's the primary confirmation tool for all price action, because a price move accompanied by high volume indicates genuine market participation, while tRead definition → statistic — as the entire signal. A stock can be nowhere near a golden cross or death cross and still qualify for this setup, simply by drifting too far above or below its own long-term average.
That makes this hub's final reversal setup in this module a fitting bookend to the reversal trading playbook that opened it: after covering climax candles, statistical volume spikes, daily classifications, and candlestick shapes, this is the version built entirely around distance from a single, widely-watched reference line.
What Counts as Genuinely Overextended From the 200-MA
Here's where the honest research complicates the popular version of this trade. A 2017 study by Alajbeg, Bubaš, and Vasić specifically tested the relationship between a stock's distance from its moving averages and its subsequent returns. The finding: the highest returns came from buying stocks trading a modest 0% to 10% below their 100-day or 200-day average — not from buying the most extreme, furthest-stretched names. Buying very far below the average, across nearly every moving average and holding period the study tested, produced the worst returns of all.
That's the opposite of the instinct most traders bring to this setup. A stock 30% below its 200-day average doesn't automatically represent a bigger opportunity than one 8% below it — often it represents something that's genuinely broken, not just statistically stretched. Real business deterioration, a permanent change in the story, or a structural decline doesn't revert just because a chart looks extended. The stocks that snap back reliably tend to be the ones that wandered a reasonable distance from their average, not the ones that fell off a cliff.
Genuinely overextended, for the purposes of this setup, means a real but moderate distance from the average — commonly in the mid-single-digit to low-double-digit percentage range below (for a long) or above (for a short) — alongside a real, checkable reason to expect reversion rather than continued deterioration: a stabilizing trend in the decline itself, no fresh negative catalyst on the trade day, and ideally a broader market or sector that isn't also falling apart at the same time.
The Setup Specification: Eight Rules for Trading the Distance
Every component below is a hard rule, because this setup's entire premise — trading distance from a specific number — only works if that distance is measured and bounded consistently.
- Component
- Market Conditions Required
- Rule
- Price trading a moderate distance from its 200-day average — commonly mid-single digits to low double digits as a percentage — without a fresh, severe negative catalyst on the trade day itself.
- Component
- Time of Day
- Rule
- The setup is identified using the daily 200-day average as a swing-level reference, but entry, stop, and initial management happen intraday, often closing the same day.
- Component
- Stock Selection Criteria
- Rule
- Avoid the most extreme stretches — per the research above, distances well beyond the moderate range have historically produced the weakest results, not the strongest.
- Component
- Entry Trigger
- Rule
- Wait for an intraday reversal candle confirming that the day's selling (or buying, for a short) has stalled, rather than entering purely because the daily distance from the average looks large.
- Component
- Stop Loss
- Rule
- Below the intraday low that formed the confirming candle for a long; above the intraday high for a short.
- Component
- Initial Profit Target + Scaling
- Rule
- First scale-out partway back toward the 200-day average itself; the average is the natural full target, not a level beyond it.
- Component
- Trade Management
- Rule
- Trail the stop behind new intraday higher lows (long) or lower highs (short) as the move develops toward the average.
- Component
- Invalidation Criteria
- Rule
- A new low below the confirming candle (long) or new high above it (short) invalidates the setup; so does a fresh, material negative catalyst suggesting genuine deterioration rather than overreaction.
| Component | Rule |
|---|---|
| Market Conditions Required | Price trading a moderate distance from its 200-day average — commonly mid-single digits to low double digits as a percentage — without a fresh, severe negative catalyst on the trade day itself. |
| Time of Day | The setup is identified using the daily 200-day average as a swing-level reference, but entry, stop, and initial management happen intraday, often closing the same day. |
| Stock Selection Criteria | Avoid the most extreme stretches — per the research above, distances well beyond the moderate range have historically produced the weakest results, not the strongest. |
| Entry Trigger | Wait for an intraday reversal candle confirming that the day's selling (or buying, for a short) has stalled, rather than entering purely because the daily distance from the average looks large. |
| Stop Loss | Below the intraday low that formed the confirming candle for a long; above the intraday high for a short. |
| Initial Profit Target + Scaling | First scale-out partway back toward the 200-day average itself; the average is the natural full target, not a level beyond it. |
| Trade Management | Trail the stop behind new intraday higher lows (long) or lower highs (short) as the move develops toward the average. |
| Invalidation Criteria | A new low below the confirming candle (long) or new high above it (short) invalidates the setup; so does a fresh, material negative catalyst suggesting genuine deterioration rather than overreaction. |
The hybrid nature of this setup is worth being direct about. Unlike this hub's more purely intraday reversal setups, identifying a genuine 200-MA distance opportunity requires the daily chart — a 200-period calculation on a 5-minute chart represents only a few days of data, not the multi-month reference the classical version relies on. The practical version day traders use borrows the level from the daily chart and executes the actual trade — entry, stop, management — intraday, often closing the position the same session even though the setup itself was identified using swing-level context.
A Walk-Through: Trading the Distance in a Hypothetical Decline
Consider a hypothetical mid-cap stock, ticker MNO, whose 200-day simple moving average sits at $50.00. None of the prices or events below are real; they're constructed to show the mechanics in action.
Over several weeks, MNO drifts down to $45.50 — about 9% below its 200-day average, squarely in the moderate range the research above associates with the strongest historical returns, not an extreme, structurally-broken-looking decline. On the trade day, MNO gaps down further to $44.50 on a minor, non-catastrophic piece of news — roughly 11% below the average — and probes intraday to a low of $44.00 before stabilizing.
Through the morning, MNO builds a base and closes a 15-minute candle back at $45.80, confirming that the day's selling has stalled rather than accelerating. A long position is initiated around $45.80 to $46.00, with a stop below the day's low at $44.00 (with a small buffer).
The first scale-out sits partway back toward the average — say $47.50, roughly the midpoint of the remaining distance — with the remainder of the position targeting the 200-day average itself at $50.00. The stop trails behind each new intraday higher low as the move develops. If MNO reaches $47.50 within the same session and continues higher without giving back the gain, a second partial scale-out near $49.00 locks in most of the move while leaving a smaller runner position to test whether price actually reaches the average itself before the session ends.
Managing the Position as Price Approaches the Average
Treat the 200-day average itself as the natural full target, not a launching pad for a bigger move. This is a reversion trade, not a breakout trade — the setup's premise is that price closes the gap to its long-term reference, not that it powers through and keeps running. Scaling out as price approaches that level, rather than assuming continuation beyond it, respects what the trade was actually betting on.
The one rule that overrides the others: treat a fresh, material negative catalyst appearing after entry as a reason to exit, not a reason to hold through it. A stock reversing back toward its average because of a stalled decline is a different situation than a stock that keeps finding new reasons to fall — and the second one is exactly the "genuinely deteriorating" case the research above warns produces the worst outcomes for this setup.
Where This Strategy Fails: When Extension Is Deterioration, Not Overreaction
The dominant failure mode here is mistaking a structurally broken stock for a statistically stretched one. A name trading 40% below its 200-day average isn't necessarily due for a bigger bounce than one trading 8% below — it may simply reflect that the market has correctly repriced the business to a lower long-term value, and the average itself will eventually drift down to meet the new price rather than price reverting up to meet the average.
This is precisely what the Alajbeg, Bubaš, and Vasić research found in aggregate: the most extreme distances underperformed the moderate ones across nearly every moving average and holding period tested. The lesson isn't that extension never reverts — it's that extreme extension is disproportionately likely to reflect real deterioration rather than pure overreaction, which is exactly the population of trades this setup should screen out rather than chase.
There's a second, more structural risk worth naming honestly. Brock, Lakonishok, and LeBaron's landmark 1992 study found strong statistical support for moving-average-based trading rules using Dow Jones data spanning 1897 to 1986. But in a later paper revisiting the same question, Blake LeBaron — one of that original study's own authors — found that the predictive power of those same rules had changed meaningfully in the years following the original study period, even as the rules continued to track volatility in a similar way. Markets that become aware of an edge, and gain the computing power and participants to exploit it, tend to see that edge shrink over time. Treating this setup as a permanent, guaranteed feature of markets rather than a historically-documented tendency that can weaken is the more structural version of the same overconfidence trap.
Simple moving averages and exponential moving averages both work with this logic, though they measure distance slightly differently — an EMA weights recent price more heavily, so a stock's distance from its 200-day EMA can differ meaningfully from its distance to the 200-day SMA during a fast-moving stretch. Neither version is definitively superior; the research summarized above found somewhat stronger, more consistent relationships for EMAs than SMAs in some of the holding periods tested, though the results for the 200-day specifically were mixed enough not to treat either as clearly superior.
Bollinger Bands apply a closely related idea with one meaningful improvement: instead of measuring distance from a moving average in raw percentage terms, they measure it in standard deviations, which automatically adjusts for how volatile a given stock normally is. A stock that's historically calm trading 10% below its average may be far more statistically stretched than a historically wild stock trading 20% below its own average — a distinction Bollinger Bands capture directly and a flat percentage distance doesn't.
This setup can also be traded purely intraday without the overnight hold, closing the position the same session once it reaches the first scale-out level, for traders who prefer to avoid carrying risk past the close entirely. The tradeoff is giving up the portion of the reversion that develops after the entry session, in exchange for eliminating overnight gap risk.
Scanning for Overextended Stocks Relative to Their 200-MA
Manually calculating every stock's percentage distance from its 200-day average across a broad watchlist isn't practical by hand. A useful scan filters for stocks trading a moderate percentage below (or above) their 200-day average — deliberately excluding the most extreme outliers per the research above — combined with a check for the absence of a fresh, severe negative catalyst on the scan day.
Trade Ideas is built to run this kind of multi-condition scan as a comprehensive scanning and research platform, filtering by moving-average distance alongside built-in charting to review each candidate's daily and intraday structure without switching tools. The scan narrows a broad market down to genuine candidates; confirming the actual intraday reversal still governs the entry.
Sizing the 200-MA Reversion Trade Inside a Broader Plan
This setup works best as a selective, moderate-distance trade rather than a hunt for the most dramatic-looking chart on the screen — precisely the opposite instinct many traders bring to it. That instinct is worth naming directly: the most extended, most dramatic-looking chart draws the eye first, and resisting that pull in favor of a moderate, less visually exciting setup takes real, deliberate patience. This hub's guide to staying patient and objective covers that discipline in more depth. Position size should reflect the same R-multiple discipline this hub applies throughout, anchored to the intraday confirming candle's low or high rather than the full daily distance to the average.
Given the honest research record — real historical support in aggregate data, a documented decline in that edge over time, and evidence that the most extreme version of the trade actually underperforms the moderate one — this strategy earns its place as a well-understood classic rather than a guaranteed edge. It closes out this hub's tour through reversal setups the same way it opened: with the reminder that every one of these tools works because of a specific, checkable signature, not because a chart simply looks dramatic. This strategy belongs on the Strategies Hub alongside the rest of this module's reversal playbooks, reached for when a stock's distance from its own long-term average — not its distance from a headline-grabbing extreme — actually fits the setup.
Common Questions About the 200-MA Reversion Trade
How is this different from a golden cross or death cross signal?
A stock can be nowhere near a 50-day/200-day crossover and still qualify for this setup simply by trading a meaningful distance from its own 200-day line. The two concepts both use the 200-day average, but they're built on opposite premises — one bets on continuation, the other bets on reversion.
Key Takeaway: Don't confuse a crossover-based trend signal with a distance-based reversion signal just because both reference the same moving average.
How far from the 200-MA does a stock need to be before this setup applies?
This runs against the common assumption that a bigger stretch means a bigger opportunity. Research specifically testing distance-to-moving-average against subsequent returns found the highest returns came from moderate distances, not extreme ones, likely because extreme distances more often reflect genuine deterioration rather than a pure statistical overreaction.
Key Takeaway: Treat extreme distance as a reason for more caution, not more conviction.
Does the 200-day moving average actually have the best mean-reversion evidence, or do shorter moving averages work better?
The 200-day is the most widely watched and discussed version of this trade, which isn't the same thing as being the version with the strongest supporting evidence. Shorter moving averages showed a more consistent distance-to-return relationship in that research, worth knowing honestly rather than assuming the most famous version is automatically the best one.
Key Takeaway: Popularity and statistical strength aren't the same thing — the 200-day earns its fame from visibility, not necessarily from having the cleanest evidence behind it.
What's the biggest risk in fading an extreme move away from the 200-MA?
A stock 30% below its average may never revert if the business itself is worth meaningfully less than it used to be; in that case, the average will eventually drift down to meet the new, lower price rather than price reverting up to meet the old average.
Key Takeaway: Ask whether the story has genuinely changed before assuming distance alone means a bounce is coming.
Should I use the 200-day SMA or EMA?
Pick one and apply it consistently, since switching between SMA and EMA depending on which one currently supports the trade you want to make is a way of fooling yourself into seeing a stronger signal than actually exists.
Key Takeaway: Consistency in which version you use matters more than which specific version you pick.
Has this edge held up in more recent market history?
That's consistent with a broader pattern in market-efficiency research: edges that become widely known and easy to exploit with modern computing tend to shrink as more participants trade against them. It doesn't mean the tendency has vanished entirely, but it argues against treating this as a permanent, guaranteed feature of markets.
Key Takeaway: Respect the historical evidence without assuming it applies with the same strength today as it did in the original studies.
Can this be traded purely intraday, or does it require holding overnight?
The setup is identified using the daily 200-day average as a reference level, but nothing about the entry, stop, or initial target requires holding past the close. Traders who prefer to avoid overnight gap risk can treat the daily level purely as an intraday reference point.
Key Takeaway: The daily-chart reference doesn't obligate a multi-day hold — treat the overnight decision as a separate choice from the setup itself.
How does this relate to Bollinger Bands?
A flat percentage distance treats a historically calm stock and a historically wild stock the same way; Bollinger Bands don't, since a calm stock reaching two standard deviations away represents a much smaller raw percentage move than a volatile stock reaching the same statistical extreme.
Key Takeaway: Consider Bollinger Bands as a volatility-adjusted alternative when comparing overextension across stocks with very different typical volatility.
Does this work the same way for both long and short setups?
The entry, stop, and target logic all translate directly; only the direction changes, along with the same caution against chasing the most extreme distance rather than a moderate one.
Key Takeaway: Apply the identical distance discipline in both directions — moderate extension, not the most extreme chart on the screen.
Does a real support or resistance level near the 200-MA make the trade stronger?
The 200-day average is itself just one reference point among several a stock's price history offers. When it lines up with a level the market has already respected in the past, that alignment is a genuinely independent confirmation rather than another way of measuring the same underlying price data.
Key Takeaway: Look for the 200-day average and a real prior support or resistance level to converge before treating the setup as high-confidence.
Disclaimer
Article Sources
- Brock, Lakonishok & LeBaron (1992), "Simple Technical Trading Rules and the Stochastic Properties of Stock Returns", The Journal of Finance - a landmark bootstrap-methodology study finding strong historical support for moving-average trading rules on Dow Jones data from 1897 to 1986onlinelibrary.wiley.com
- LeBaron, "The Stability of Moving Average Technical Trading Rules on the Dow Jones Index", Derivatives Use, Trading and Regulation - a follow-up by one of the original study's authors, finding the predictive power of these rules changed meaningfully in more recent datapapers.ssrn.com
- Alajbeg, Bubaš & Vasić, "Price Distance to Moving Averages and Subsequent Returns", International Journal of Economics, Commerce and Management - finds that moderate distance from a moving average historically outperformed extreme distance, with a weaker relationship for the 200-day average specifically than for shorter onesijecm.co.uk