
Why August Trading Volume Drops (But Volatility Doesn't)

In this article6 sections
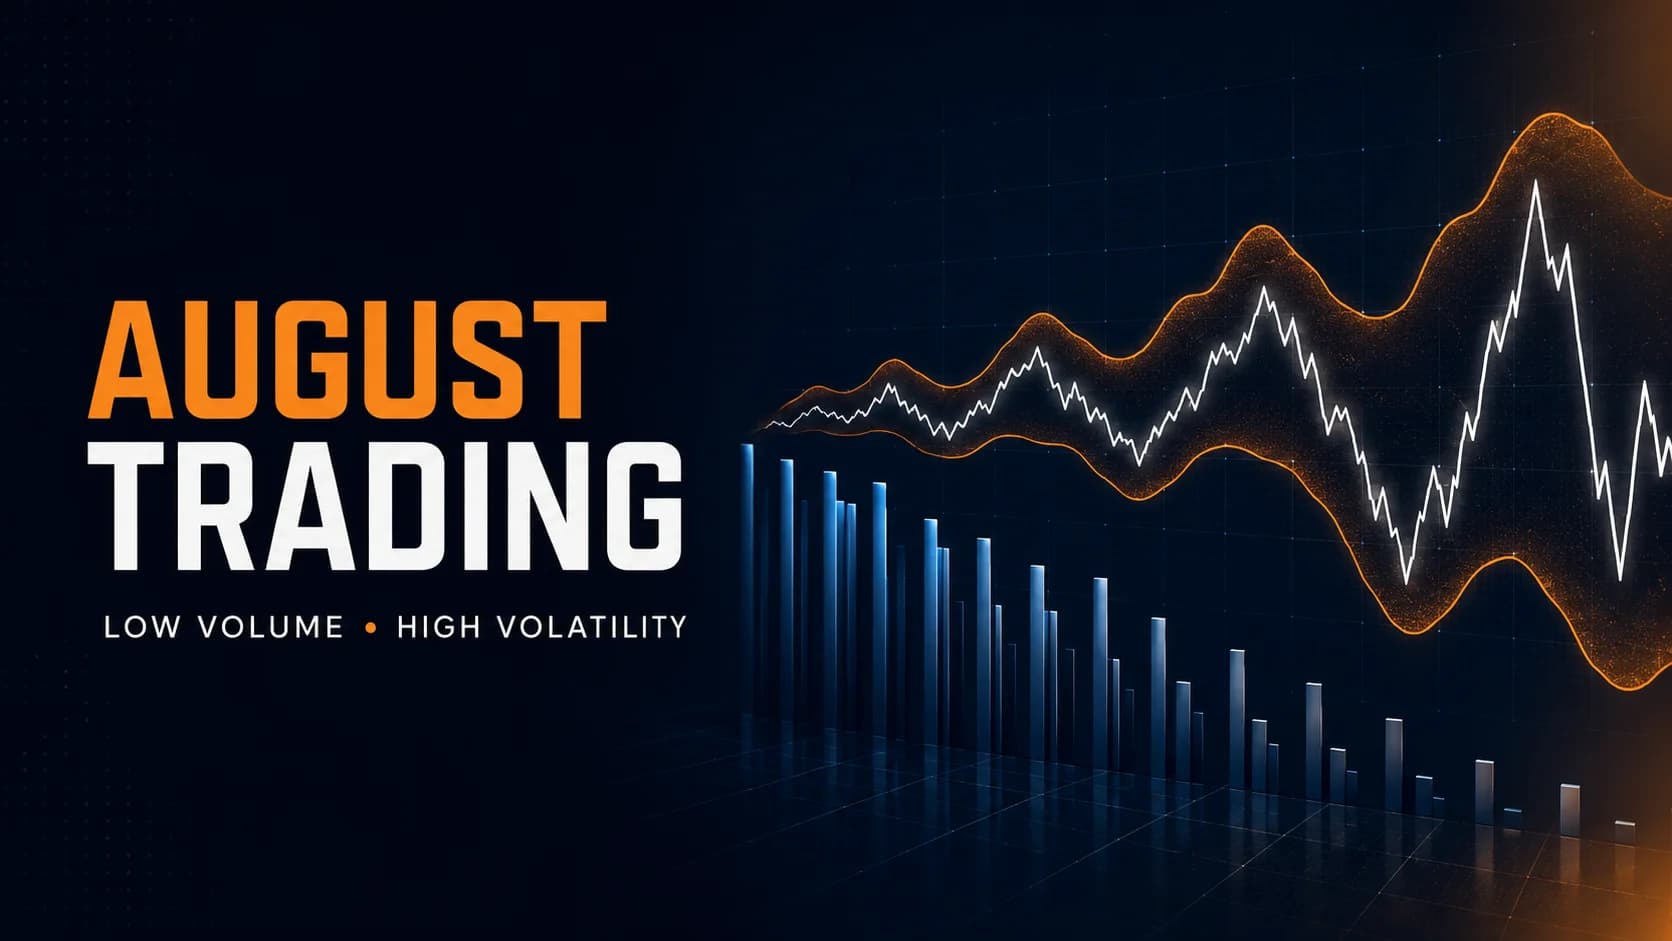
Two things are true about August at the same time, and they seem to contradict each other until you understand why they don't. Trading volume drops — institutional desks thin out, European markets empty for the summer, retail attention wanders. And the CBOE Volatility Index (VIX) has, over the past 15+ years, historically climbed through August on its way to an autumn peak that usually lands in October. Low volume and rising volatility aren't a contradiction. They're cause and effect.
Why the Two Trends Aren't Actually in Conflict
Volume and volatility measure different things. Volume is how many shares change hands. Volatility is how much price moves. In a market with deep, consistent participation, a large order gets absorbed by a wide pool of buyers and sellers without moving price much — that's what liquidity does. Pull a meaningful share of that participation out of the market, and the same-sized order has fewer counterparties to absorb it. Price has to move further to find a new equilibrium.
That's the August mechanism in one sentence: less liquidity means every dollar of order flow has an outsized effect on price. It's not that more bad news happens in August. It's that whatever news does happen — a jobs report miss, a surprise policy move, a single large fund unwinding a position — gets amplified because there are fewer participants standing ready to take the other side.
The data backs this up cleanly. VIX has historically posted its seasonal low in late July or early August, then climbed steadily into an autumn peak, most often in October. August and September also happen to be, on average, the two weakest-performing months of the year for the S&P 500 — which lines up with the idea that thin summer liquidity leaves the market more exposed to whatever shock shows up first.
The Case Study Every Trader Should Know: August 5, 2024
If you want to see the mechanism in its most extreme form, look at what happened on August 5, 2024. The Bank of Japan raised interest rates by 15 basis points on July 31 — a small move on paper — which triggered a violent unwind of the "yen carry trade," a strategy where funds borrowed cheaply in yen to invest in higher-yielding assets elsewhere. Two days later, a weaker-than-expected U.S. jobs report (114,000 jobs added versus 175,000 expected) added fuel by raising the odds of a Fed rate cut, which would shrink the very rate gap the carry trade depended on.
By August 5, JPMorgan estimated that 65–75% of global carry trade positions had unwound. Japan's Nikkei 225 fell more than 12% in a single session — its steepest drop since 1987. The S&P 500 fell 3% the same day. The VIX spiked to 65, a level last seen during the 2020 pandemic crash and the 2008 financial crisis.
None of the underlying news was, by itself, crisis-scale. A 15-basis-point rate hike and a soft-but-not-catastrophic jobs report don't normally produce a 1987-style single-day crash. What turned ordinary news into an extreme move was the illiquid, thinly-populated August market it landed on, combined with heavy leverage that had nowhere to unwind gently. That combination — thin liquidity plus a leveraged position needing to unwind — is the specific pattern worth remembering, because it's not unique to 2024. It's the standing risk every August carries.

What Actually Changes About Market Structure in August
A few concrete things shift, and each one matters for how you should trade.
Institutional participation drops. A large share of European trading desks effectively empty out in August as much of the continent takes its traditional summer holiday. Since European institutional flow contributes meaningfully to U.S. market liquidity during overlapping hours, its absence thins the order book even for U.S.-listed names.
Algorithmic and retail flow make up a larger share of total volume. With fewer large institutional orders working the tape, a bigger proportion of the volume that does trade comes from algorithmic strategies and retail participation — both of which can behave differently than institutional flow, sometimes amplifying moves rather than smoothing them.
Bid-ask spreads widen, especially in smaller-cap and lower-float names. Less competition for the other side of a trade means market makers demand more compensation for providing liquidity. This shows up directly in your execution costs if you're not paying attention to it.
Gaps become more common and more violent. With less continuous two-way flow, price can jump between levels rather than trading through them cleanly, particularly around news releases or economic data prints.
How to Adjust Your Approach
Size down, not up. The same position size that felt appropriately risky in June can produce a materially larger dollar swing in a thinner August market, simply because the stock's realized range has widened. If your position sizing isn't dynamically adjusted for volatility, August is when a static approach gets exposed.
Watch relative volume (RVOL), not just volume. Absolute volume numbers are naturally lower across the board in August, which makes them a poor standalone signal. What matters is volume relative to what's normal for that specific stock at that specific time of day. A scanner built for this — something like Trade Ideas' relative volume and real-time scanning — does this comparison automatically rather than asking you to eyeball raw share counts against memory.
Widen your stops, but not your position size. If volatility is genuinely elevated, a stop placed at your normal distance is more likely to get clipped by noise rather than a real reversal. The fix isn't to ignore your stop discipline — it's to size the position smaller so that a wider, more appropriate stop still risks the same dollar amount.
Be more selective about what you trade. Thin liquidity punishes low-float, illiquid names disproportionately, since they have the least depth to absorb any given order. This is a month to lean toward names with genuinely deep participation rather than reaching for a low-float mover that looked fine in a more liquid month.
Respect economic data days more than usual. A jobs report or CPI print that would move markets moderately in a normal-liquidity month can produce an outsized reaction in August precisely because of the mechanism above — thin markets amplify whatever catalyst shows up. The August 2024 episode is the clearest possible illustration: a soft-but-unremarkable jobs report became one ingredient in a historic single-day move because of what the market's liquidity looked like at the time.
Where Traders Get This Wrong
The most common mistake is assuming "low volume" means "low risk" — a quiet, sleepy month where nothing much happens. The data says the opposite: August and September are, on average, two of the weakest-performing months of the year, and volatility has historically trended higher through this stretch, not lower. Confusing quiet order flow with a quiet market is exactly backwards.
The second mistake is holding position sizing constant while market conditions change underneath it. A trader who sizes the same in August as they did in a high-liquidity April month is implicitly taking on more risk per trade without realizing it, because the same percentage move now represents a bigger structural shock relative to available liquidity.
The third mistake, specific to event risk like the 2024 carry-trade unwind: assuming that because a piece of news looks small on its own, it can't matter much. A 15-basis-point rate move from a central bank most U.S. day traders don't watch closely triggered a chain reaction that produced the VIX's highest reading since the pandemic. The lesson isn't "watch the Bank of Japan every day" — it's that thin-liquidity months are exactly when a seemingly minor catalyst has room to cascade, because there's less market depth standing in the way.
FAQ
Why does trading volume drop in August specifically?
Since U.S. market hours overlap with European trading for part of the day, reduced European participation directly thins the liquidity available during that overlap. Combined with lighter U.S. institutional activity, the result is measurably lower average daily volume across both the NYSE and Nasdaq compared to spring and fall months.
Key Takeaway: Lower volume isn't a U.S.-only phenomenon — it's a global seasonal pattern that directly affects U.S. market depth.
If volume is lower, why does the VIX historically rise during August?
Historical VIX data shows a seasonal low in late July or early August, followed by a steady climb into an autumn peak that most often lands in October. This isn't a coincidence — thinner markets are structurally more prone to amplified moves, which is exactly what elevated implied volatility reflects.
Key Takeaway: Volume and volatility aren't the same measurement, and in August they typically move in opposite directions for a specific, mechanical reason.
What happened on August 5, 2024, and why does it matter for 2026?
It matters going forward because the underlying pattern — thin August liquidity plus a leveraged position that needs to unwind — isn't unique to 2024. Any August carries some version of this risk: a catalyst that would be manageable in a higher-liquidity month landing on a market with less depth to absorb it.
Key Takeaway: Treat August as a month where a seemingly small catalyst has more room to cascade than it would in April or November.
How should I adjust my position sizing for August specifically?
A position sized for a calmer month, held through a month with structurally wider ranges, risks more per trade than you intend even if the share count looks identical. Adjusting the stop without adjusting size just trades one problem for another.
Key Takeaway: For a full framework on sizing stops to a stock's actual volatility rather than a fixed percentage, see How to Place a Stop Loss Correctly.
Is low trading volume in August the same everywhere, or does it vary by stock?
Mega-cap, high-float names have enough baseline participation that August's seasonal thinning is a modest effect. Illiquid small caps can see spreads widen enough to meaningfully affect entry and exit prices, on top of the wider price swings themselves.
Key Takeaway: Bias toward more liquid names in August specifically, and treat thin small-cap setups with extra caution.
Does August's low-volume pattern mean I should avoid trading altogether this month?
Some of the market's largest single-day moves have happened in August specifically because conditions were thin — which also means some of the best risk-adjusted opportunities show up for traders who adjust their process rather than ignore the seasonal pattern or avoid the market entirely.
Key Takeaway: The goal is adapting your process to the conditions, not abandoning it — see Adapting to Market Conditions: Trading in Bull, Bear & Choppy Markets for the broader framework this fits into.
How does the 2024 carry-trade unwind compare to a typical quiet August?
The typical August pattern is more modest: gradually rising implied volatility, lower average volume, and wider spreads, without a crisis-level event. The 2024 episode is useful precisely because it shows what the underlying mechanism looks like in its most visible form — the same dynamic is present in quieter years, just at a much smaller scale.
Key Takeaway: Prepare for the ordinary version of this pattern (thinner, choppier conditions) while understanding the tail risk the extreme version represents.
Should I change which economic data releases I pay attention to in August?
The August 2024 episode involved a routine (if disappointing) jobs report and a modest foreign central bank rate move — nothing exotic. The lesson is to respect standard catalysts more during this stretch, not to hunt for unusual ones.
Key Takeaway: For the standard framework on trading scheduled data releases, see How Economic Reports Move the Market: CPI, NFP, FOMC for Day Traders — it applies with extra weight during low-liquidity months.
Disclaimer
Article Sources
- Equity Clock: Volatility Index (VIX) Seasonal Chart - 15-year VIX seasonality data showing the August-through-October volatility climb
- CNBC: Carry Trades — A Major Unwinding Is Underway Amid a Stock Sell-Off - August 5, 2024 market reaction and carry-trade mechanics
- Avantis Investors: Lessons From August 2024 Market Panic - analysis of the VIX spike and market conditions during the episode
- Interactive Brokers: The Dog Days of Summer — How August Affects the Stock Market - historical August seasonality data on returns and volume
- Verdence: Stock Market Seasonality — Why August, September Are Historically Weak - average monthly performance data supporting the August/September weak-patch pattern
Was this helpful?
Be the first to weigh in

Written by
Kazi Mezanur RahmanFounder, independent researcher, and editor of DayTradingToolkit. A one-person publication focused on risk-first trading education and documented tool research. He trades his own capital as a retail trader and combines personal market experience with systematic primary-source research.
Keep Reading

Day Trading Basics
Position Sizing Strategies for Forex and Stocks
Learn how to calculate position size in forex and stocks with proven strategies. Discover the 1–2% rule, volatility-based sizing, and use our Position Size Calculator for accurate risk management.

Day Trading Basics
AI Trading Agents for Day Traders: What They Can Actually Do
Interactive Brokers and Robinhood both launched real AI trading agents in 2026 — built very differently. This guide covers what each actually does, what independent testing found when the return claims got checked, and how to evaluate any agent before connecting one to real money.
Day Trading Basics
Quarterly Estimated Taxes for Day Traders: Avoiding the Underpayment Penalty
A trader has a rough nine months, then an incredible six-week run that makes the whole year profitable. He pays his full tax bill by April 15 and still gets a penalty notice, because the IRS calculates underpayment quarter by quarter, not against the annual total. Here's the safe harbor rules, the fix for lumpy trading income, and exactly when payments are due.

Day Trading Basics
Nasdaq's Fast Entry Rule: Trading the Next Mega-IPO
Nasdaq's new Fast Entry rule lets qualifying mega-IPOs join the Nasdaq-100 in just 15 trading days. Here's how the mechanism actually works, why Nasdaq made the change, and how to spot the next company it happens to.
Comments
No comments yet. Be the first to share your thoughts.