
Stock Rover Review 2026: Best Research Tool for Investors?
Stock Rover is not a day trading platform. We want to say that upfront, clearly, because a lot of active traders land on Stock Rover reviews searching for a screener upgrade — and what they find is a tool built for a completely different workflow. That's not a criticism. It's the most useful thing this review can tell you.
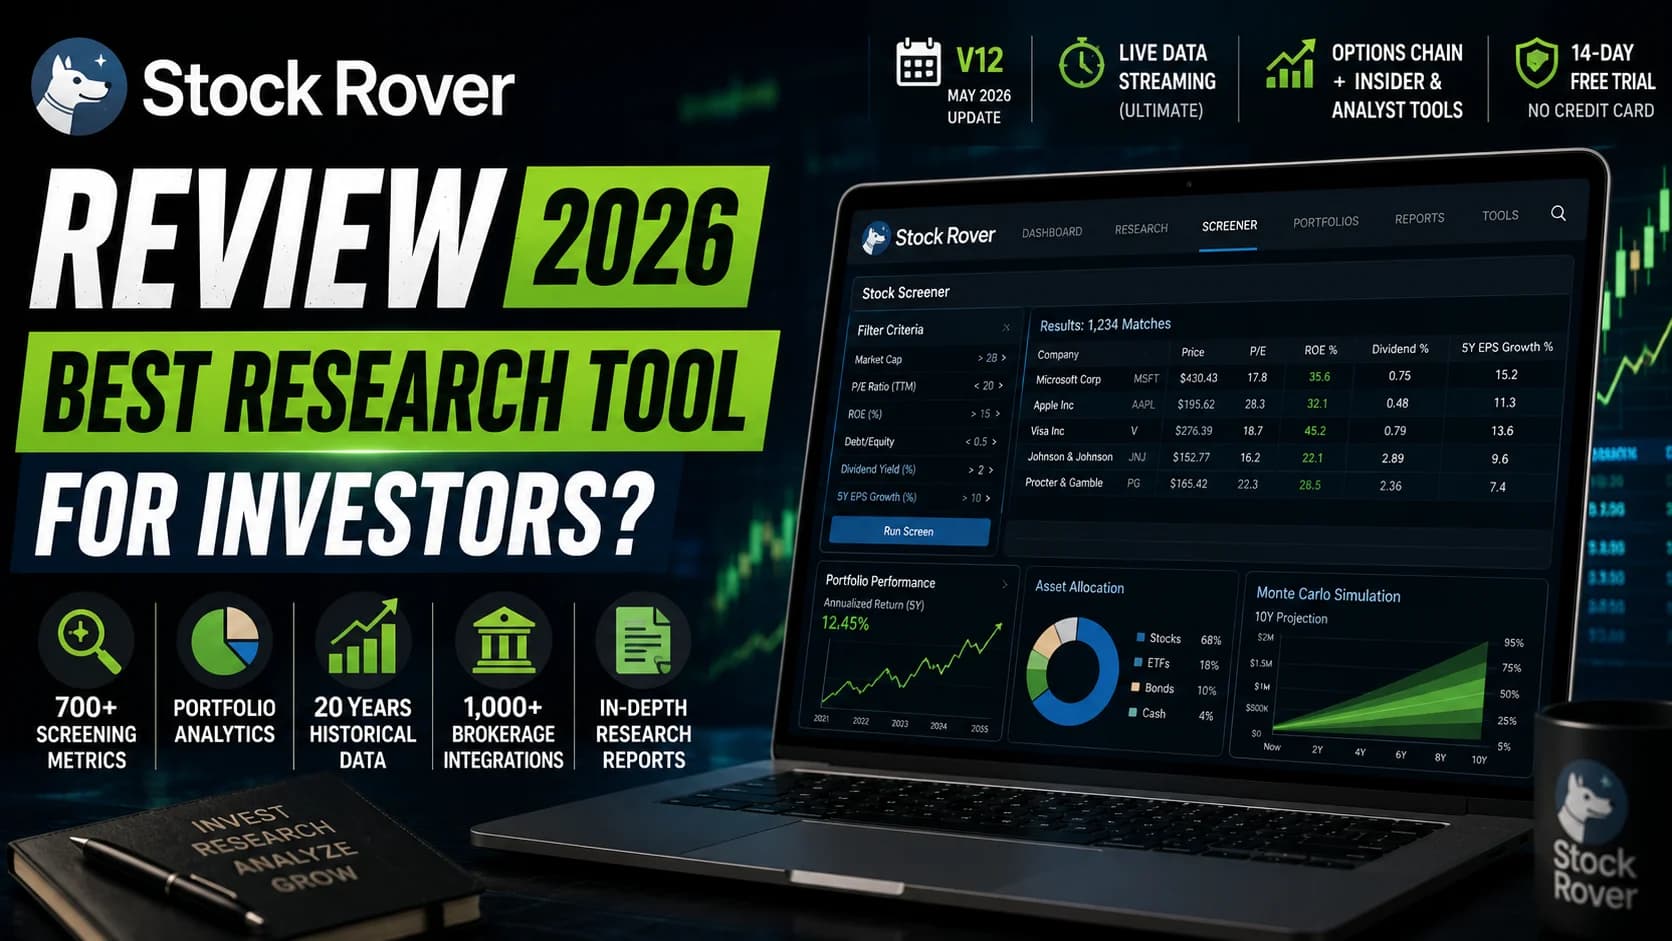
Stock Rover is a fundamental research and portfolio analytics platform, and in that category it's genuinely among the best available to retail investors. The May 2026 V12 update added institutional-grade features — 20 years of historical fundamentals, standalone analyst and insider research tools, an options chain, live data streaming, and nearly 80 new pre-built screeners. This independent review covers the full V12 platform across every tier — who benefits from the screener depth and portfolio analytics, and who should look elsewhere.
Stock Rover Review 2026
Stock Rover is the most capable fundamental research and portfolio analytics platform available to retail investors at its price point. The V12 update makes it even stronger for long-term investors. Its day trading limitations — delayed data, no intraday scanning, no execution — are structural, not incidental. Score reflects the platform's genuine excellence in its intended category and its genuine unsuitability for active intraday trading.
Pros
Strengths- 700+ screening metrics covering valuation, growth, profitability, dividends, and analyst ratings — one of the deepest fundamental screeners in retail investing
- Portfolio analytics suite includes Monte Carlo simulation, correlation analysis, and brokerage integration across 1,000+ institutions — tools that typically cost far more elsewhere
- V12 (May 2026) adds 20 years of historical fundamentals, standalone insider/analyst research tools, options chain, and live data streaming for Ultimate subscribers
- 150+ pre-built screeners covering strategies from dividend growth to value investing, with guru-style screens based on documented investment frameworks
- 14-day free trial with no credit card required — one of the cleanest trial setups in this category
Cons
Trade-offs- Data is delayed 15-20 minutes at most plan tiers — not suitable for real-time intraday decisions
- No dedicated mobile app — browser-based only, with a steep learning curve on smaller screens
- No trade execution capability — Stock Rover is research-only; you execute at your broker separately
- North American stocks only (US and Canadian exchanges) — no international equities, no forex, no futures
- V12 pricing is significantly higher than the previous plan lineup; the entry-level Essentials tier has been retired
What Is Stock Rover?
What is Stock Rover? Stock Rover is a browser-based stock research and portfolio analytics platform founded in 2008 by Howard Reisman and Andrew Martin. It provides over 700 fundamental screening metrics, deep portfolio analysis including Monte Carlo simulations and correlation analysis, brokerage integration across 1,000+ institutions, and research reports for 7,000+ North American stocks — all designed for self-directed investors who want institutional-depth research tools without institutional price tags.
The V12 update, launched May 31, 2026, is the platform's most significant release. It introduced new professional tiers (Ultimate and Ultimate Pro), expanded the dashboard for all users, added 20 years of historical fundamental data, and brought an options chain and standalone analyst/insider research tools to the highest subscription levels. The Essentials entry-level plan was retired in the process, moving the platform's pricing structure upmarket.
Stock Rover covers 8,500+ North American stocks, 4,000 ETFs, and 40,000+ mutual funds across US and Canadian exchanges plus OTC markets. Financial data is sourced primarily from Morningstar, with additional data partners including Zacks, Intrinio, and IEX. The platform is web-based — no download required — and integrates portfolio data via Yodlee, which supports automatic syncing from over 1,000 financial institutions.
What Stock Rover is not: a trading terminal, a real-time scanner, or an intraday alert system. Understanding that distinction before evaluating the platform will save you significant time.
Stock Rover Key Features
The Screener is what most users come for, and it earns the attention. At the Premium Plus and above tiers, you have access to over 700 fundamental metrics — valuation ratios (P/E, P/B, P/S, EV/EBITDA), growth metrics (revenue growth, EPS growth, earnings surprise history), profitability measures (ROE, ROIC, gross and operating margins), financial health indicators (debt-to-equity, interest coverage, current ratio), and dividend data (yield, payout ratio, 5-year dividend growth). That depth isn't just a feature list — it's the ability to build screens that most research platforms literally cannot replicate.
The 150+ pre-built screeners cover the documented investment strategies of well-known investors and frameworks — screens based on valuation principles associated with Buffett, Graham, Lynch, and Greenblatt, plus income-focused, growth-focused, and quality-factor screens. For investors who want a systematic starting point rather than building from scratch, these are genuinely useful templates rather than marketing filler.
The equation screener (Premium Plus and above) is the standout feature within the screener. Instead of selecting from a dropdown of available metrics, you type a condition in plain language — "stocks where EPS growth over 3 years exceeds 20% and P/E is below sector median" — and Stock Rover translates that into a working screen. It's the closest retail investors get to the kind of ad hoc quantitative screening that institutional research desks run.
V12's Percentile Screening (Ultimate) adds another layer: you can filter for stocks in the top quartile of a metric within their sector or the broader index, rather than just filtering by absolute values. This is meaningful because a P/E of 15 means different things in healthcare than in utilities — percentile filtering accounts for that context automatically.
Portfolio Analytics is where Stock Rover does its most distinctive work and where the gap with other retail platforms is widest. Three tools in particular stand out:
Correlation Analysis scores every pair of positions in your portfolio on price-movement correlation. The practical value: two companies in different sectors can have highly correlated returns if they share the same sensitivity to interest rates, commodity prices, or economic cycles. Most portfolio management tools that flag concentration risk do so by sector label alone, which misses this kind of cross-sector correlation. Stock Rover catches it.
Monte Carlo Simulation runs thousands of probabilistic forward paths on your portfolio based on historical return distributions, producing a realistic range of best- and worst-case outcomes for a defined time horizon. This is a planning tool you'd normally find in paid financial planning software — at Stock Rover's Premium tier pricing, it's the clearest example of the platform punching well above its price point.
Brokerage Integration connects to 1,000+ financial institutions via Yodlee, automatically syncing your holdings into the portfolio analytics environment. You don't need to manually update positions — your actual portfolio populates the correlation analysis, Monte Carlo simulator, and dividend forecasting tools in real time.
Dividend Forecasting projects future income from your holdings based on current yield and payout history, with Monte Carlo-based income simulations available at higher tiers. For income-focused investors managing a dividend portfolio, this is a workflow that would otherwise require spreadsheet work.
Charting in Stock Rover is designed for fundamental visualization, not technical trading. You can chart virtually any metric over time — plot a company's gross margin trend, overlay revenue growth, or compare EPS against its 10-year average. Comparative charting lets you normalize multiple stocks to a common starting point and compare performance trajectories.
What the charting is not built for: technical analysis in the way active traders use it. Drawing tools exist in V12 for Ultimate users, but the overall charting experience is clearly secondary to the screener and analytics tools. Technical indicators are limited compared to dedicated charting platforms. If chart-based technical analysis drives your entry and exit decisions, Stock Rover's charting is a supplement at best.
Research Reports (separate add-on, $49.99/year with subscription) compile fundamental analysis for 7,000+ tracked stocks into a structured research summary format. These include earnings trend commentary, valuation context with historical comparison, profitability analysis, and forward estimates. The contextual presentation is what makes them useful — rather than showing a P/E of 22 in isolation, the report shows how that 22 compares to the stock's 5-year average, its sector median, and the broader index.
Investor Warnings is a proprietary feature that scans for potential red flags in a company's financial statements — declining margins, deteriorating balance sheet ratios, revenue quality concerns — and surfaces them alongside the screener results. It's a defensive research layer that helps avoid overlooking warning signs that pure screening metrics might not immediately surface.
Dashboard (V12) expanded for all users to include dedicated sections for Analyst Ratings, Insider Transactions, and a Crypto price summary. The Analyst Ratings view aggregates institutional coverage and consensus ratings; the Insider Transactions section tracks Form 4 filings for significant buying and selling activity. For Ultimate subscribers, both of these become standalone research environments with live data streaming.
Finviz
For active traders who need real-time screening with technical filters, heat maps, and intraday data — Finviz is the natural complement to Stock Rover's fundamental depth.

Who Stock Rover Is Best For
Value investors, dividend investors, and quality-focused long-term investors. Stock Rover was built for people who analyze companies rather than price action. If your process involves reading financial statements, comparing valuation ratios across sectors, projecting dividend income, and stress-testing portfolio correlations, Stock Rover is the most capable tool in its price range. The 700+ metric library and equation screener give you genuine depth that most retail platforms don't offer.
Self-directed investors managing multi-position portfolios. The correlation analysis and Monte Carlo simulation tools are particularly valuable for investors running 15–30+ position portfolios where understanding risk interactions matters. Knowing that two positions you thought were uncorrelated are actually moving together is the kind of insight that prevents concentration risk from blindsiding you in a sector rotation or rate shock.
Investors who want institutional-depth research without institutional pricing. Stock Rover's Ultimate tier at $99/month competes on feature depth with research products that charge multiples of that. For serious self-directed investors who would otherwise use a combination of a Bloomberg terminal, a financial data service, and a separate screener, consolidating into Stock Rover is a meaningful cost reduction.
Stock Rover is not built for intraday day traders. The data is delayed 15–20 minutes at most tiers. There is no intraday auto-refresh scanning for stocks moving in real time. There are no real-time alerts for price triggers during a live session in the way active trading tools deliver them. There is no execution capability — all trading happens at your broker separately. If your trading day involves finding fast-moving stocks during market hours, Stock Rover's analytical environment does not support that workflow. Our introduction to stock screener filters for day trading covers what active screeners actually require for intraday work.
Stock Rover is also not built for swing traders whose entries are primarily technical. The charting tools are functional for fundamental visualization but limited for technical analysis. If your entries and exits are driven by moving averages, volume patterns, support and resistance levels, and indicator signals rather than fundamental screens, Stock Rover's technical environment won't give you what you need.
Stock Rover Pricing (V12, 2026)
V12 restructured Stock Rover's pricing significantly. The Essentials entry-level tier has been retired, and the platform has moved upmarket with a focus on premium-tier positioning. As of mid-2026, the plan structure is:
Free: Permanent access to a news and watchlist dashboard with basic price charts and limited financial data. Screener, portfolio analytics, and dividend tools are not included. Display ads throughout. Useful for keeping an eye on a small watchlist; not useful for serious research.
Premium: Approximately $34/month (monthly billing) with meaningful discounts for annual and 2-year commitments. Includes the screener with core fundamental metrics, correlation analysis, Monte Carlo simulation, dividend forecasting, brokerage integration, and charting tools. This is the tier where Stock Rover's most differentiated value starts — the Monte Carlo and correlation tools alone justify the step up from free.
Premium Plus: Approximately $70/month, unlocking the full 700+ metric library, equation screener, analyst-rating filters (EPS revision trends, consensus target prices), and historical data screening. For investors who run multiple sophisticated screens per week and need the complete metric library and analyst data layer, this is the natural home.
Ultimate: Approximately $99/month, the V12 flagship tier. Adds 20 years of historical fundamental data, standalone Analyst Ratings and Insider Transactions research environments, Percentile Screening, an integrated Options Chain, live data streaming for portfolio holdings, chart drawing tools, analyst overlays on charts, and priority support. Research Reports are also included at this tier. For professional-grade research depth, this is where Stock Rover now competes with platforms that charge two to three times the price.
Ultimate Pro: Approximately $199/month, identical feature set to Ultimate but with significantly higher limits for portfolios, table rows, and data exports. Designed for professional investors, investment clubs, or advisors managing large portfolios.
Annual billing reduces monthly costs by approximately 25–30%; two-year billing offers the deepest discount. A 14-day free trial of all paid plans is available with no credit card required. Stock Rover's refund policy is strict — no refunds on paid subscriptions outside the trial window — so using the trial period is important before committing.
Research Reports remain a separate add-on at $49.99/year with an active subscription. For current exact pricing and any active promotions, check our deals page.
What Works Well
The screener depth is genuinely unmatched at this price point. Seven hundred metrics is not a number for a feature table — it's what you need to run sophisticated multi-factor screens that isolate exactly the companies matching a specific investment thesis. The pre-built guru screens give investors a documented starting framework; the equation screener gives advanced users the ability to build anything they can articulate. Very few retail platforms offer both.
Monte Carlo simulation and correlation analysis punch well above the tier price. These are tools you'd find in professional financial planning software and institutional risk analytics. Having them available at $34/month on the Premium plan is the clearest evidence of what Stock Rover prioritizes: giving serious investors research infrastructure they'd otherwise have to assemble from multiple expensive tools.
Brokerage integration across 1,000+ institutions is seamless. Automatic portfolio syncing via Yodlee means your actual holdings feed directly into the analytics environment without manual updating. Running correlation analysis on a real portfolio versus a manually entered placeholder portfolio is a different experience — the real-time sync makes that possible across virtually every major broker.
V12 represents a genuine upgrade, not incremental polish. Twenty years of historical fundamental data, standalone insider research tools, percentile screening, and an options chain are substantive additions. The expansion of the dashboard for all users — analyst ratings, insider transactions, crypto monitoring — adds information layers that previously required separate research sources.
Limitations
The 15-20 minute data delay is a fundamental constraint for active traders. This is not a tier-based limitation you can upgrade past on most plans — it's how the platform is architected for most use cases. Ultimate subscribers get live data streaming for portfolio holdings in the dashboard. But the screener itself runs on delayed data. If your investment process involves using real-time price triggers to time entries or identify intraday setups, Stock Rover is not the right infrastructure. This isn't a criticism of the platform — it's correctly built for its intended audience, which doesn't need second-by-second price data for a research workflow.
No mobile app means desktop-dependent research. Stock Rover is browser-based, and while it loads on mobile browsers, the experience on a phone is suboptimal for a platform designed around wide data tables, multi-panel layouts, and complex screener construction. The absence of a dedicated app matters for investors who want to monitor their portfolios on the go. Tracking a position's fundamental health or receiving an alert mid-day is functional on mobile; running a complex multi-factor screen is not.
V12 pricing is a meaningful step up from the previous lineup. The retirement of the Essentials tier removes the entry-level access point many users relied on. The current lowest paid tier (Premium at ~$34/month) delivers excellent value for what it includes, but it's a different conversation for cost-sensitive investors than a $7.99/month Essentials plan. Investors who primarily need basic screener access should evaluate whether Premium's full feature set is what they actually use.
North American coverage only is a structural limitation for globally-minded investors. US and Canadian markets are covered in depth. International equities, ADRs from non-North American companies, European or Asian market securities, forex, futures, and crypto (beyond the V12 dashboard monitoring layer) are not in scope. For a globally diversified investor, Stock Rover covers only part of the portfolio.
The learning curve is real. Seven hundred metrics is power and complexity in the same package. New users unfamiliar with financial statement analysis, valuation ratios, and portfolio risk metrics will find the platform disorienting before finding it useful. Stock Rover's educational resources help, but this is a platform that rewards investors who already have a research framework and are looking for better tools to execute it — not investors still building foundational financial literacy.
How It Fits a Day Trader's Workflow
The direct answer: Stock Rover doesn't fit into an active day trading workflow. Not because of a specific missing feature, but because the whole platform is oriented around a different time horizon and research approach. Day trading requires real-time data, intraday scanning, technical analysis infrastructure, and fast execution — none of which are what Stock Rover was built to provide.
Where Stock Rover does connect with active traders is in the broader research layer that sits behind any informed trading approach. Understanding a sector's rotation dynamics, identifying which stocks within an index have the strongest fundamental momentum before screening for technical setups, or running correlation analysis on a swing portfolio to ensure positions aren't duplicating risk — these are applications where fundamental research depth adds value even for shorter-term traders.
For day traders who want a screener that delivers real-time technical and fundamental filters together, our Finviz review covers how Finviz Elite addresses that workflow — real-time data, heat maps, technical pattern filtering, and intraday alerting in a platform built specifically for active market participants. For fundamental context behind a catalyst trade, our guide to understanding what makes stocks move covers the research layer that precedes a trade setup.
Investors who want to understand the full comparison between Stock Rover's fundamental research depth and a dedicated active trading platform can find that breakdown in our Trade Ideas vs. Stock Rover comparison, which maps exactly where each tool's strengths apply.
Best Fundamental Research Platform at Its Price — Not for Day Traders
Frequently Asked Questions
Is Stock Rover good for day trading?
The platform's data is delayed 15–20 minutes on most tiers, the screener has no intraday auto-refresh, and there is no execution capability. Day trading requires real-time price data, continuous scanning for stocks moving during the session, and fast execution infrastructure — none of which Stock Rover provides. It's excellent for the research that happens before you decide which stocks to focus on, but it doesn't replace the tools needed to actually trade them intraday. For real-time screening and scanning tools built specifically for active trading, see our reviews hub.
Key Takeaway: Stock Rover is built for fundamental investors, not active day traders — the delayed data and lack of intraday scanning make it the wrong tool for momentum or technical day trading strategies.
What happened with Stock Rover V12?
V12 is the platform's largest release in its history. The Ultimate tier is now the flagship — it adds substantial institutional-depth features including 20-year historical fundamentals, standalone analyst rating and insider transaction research environments, percentile-based screening, and an integrated options chain. The dashboard expansion benefits all users, adding Analyst Ratings, Insider Transactions summaries, and Crypto monitoring as standard sections. The Essentials tier being retired moved the platform's entry price meaningfully upward, which matters for cost-sensitive investors.
Key Takeaway: V12 makes Stock Rover significantly more capable for serious long-term investors, particularly at the new Ultimate tier — but the pricing restructure requires existing and new users to reassess their tier fit.
What are Stock Rover's pricing tiers in 2026?
The Free tier is a watchlist and news tool — it doesn't include the screener or portfolio analytics. Premium is where the meaningful platform begins, with core fundamental screening, Monte Carlo simulation, correlation analysis, and brokerage integration. Premium Plus adds the full 700+ metric library, equation screener, and analyst filters. Ultimate (V12's new flagship tier) adds 20-year historical data, options chain, standalone research tools, and live data streaming. Annual billing discounts run approximately 25–30% versus monthly. A 14-day free trial with no credit card covers all paid plans. Check current pricing at our deals page.
Key Takeaway: The Premium plan is the natural entry point for serious investors; Premium Plus suits those who need the full metric library and analyst filters; Ultimate is for professional-grade research depth with V12's newest capabilities.
Does Stock Rover offer real-time data?
The screener itself runs on delayed data across all tiers. The live data streaming in Ultimate applies to portfolio holdings shown in the V12 dashboard — meaning your real holdings update in near-real-time, but you're not running real-time scans for new positions. For investment research purposes — building screens based on fundamental metrics, comparing companies, or monitoring a portfolio — 15–20 minute delay is generally acceptable. For active trading decisions based on price action, it is not.
Key Takeaway: Stock Rover is not a real-time data platform for trading decisions — delayed quotes are standard across most tiers, with limited live streaming for portfolio monitoring added in V12 Ultimate.
What is the Stock Rover equation screener?
Rather than selecting from dropdown menus of available metrics, you describe what you're looking for: "stocks with revenue growth above 20% and P/E below industry median" or "dividend payers where payout ratio has been under 60% for five consecutive years." Stock Rover interprets the plain-language input and surfaces relevant screening conditions. It dramatically reduces the friction of building sophisticated multi-factor screens and makes the platform's full metric depth accessible to users who don't want to manually construct complex filter logic. It's the most distinctive single feature in the screener.
Key Takeaway: The equation screener is what separates Stock Rover's screening experience from dropdown-based alternatives — available on Premium Plus and above, it translates investment thesis into working screens without requiring you to know every metric name.
How does Stock Rover compare to Finviz?
The two platforms solve different problems. Stock Rover's 700+ fundamental metrics, Monte Carlo simulation, and correlation analysis serve investors who evaluate companies based on financial health, valuation, and business fundamentals. Finviz Elite's real-time technical screening, heat maps, and technical chart filtering serve traders who identify setups based on price action, volume, and technical patterns. For a day trader who needs both fundamental context and real-time technical filtering, these are complementary tools rather than alternatives. See our full Finviz review for a complete breakdown of what Finviz Elite delivers for active trading workflows.
Key Takeaway: Stock Rover and Finviz serve different research needs and different trader profiles — fundamental investors benefit from Stock Rover; active technical traders benefit from Finviz; serious traders often use both as a research stack.
Is there a free trial for Stock Rover?
The trial structure is one of the cleaner setups in the research platform category: full access to whichever tier you select for 14 days, no payment information required to start. After the trial, your account drops to the Free tier if you don't subscribe. The Free plan doesn't include the screener or analytics tools — it's a news and watchlist dashboard. Stock Rover's no-refund policy on paid subscriptions makes it worth genuinely using the trial period across different plan features before committing to a billing cycle. The trial is the right time to run the equation screener, test correlation analysis on your real holdings, and evaluate whether Premium or Premium Plus covers your actual research workflow.
Key Takeaway: The 14-day free trial (no credit card) is genuinely useful — plan to specifically test the screener and portfolio analytics features during that window, as the Free plan after trial doesn't include them.
Does Stock Rover have a mobile app?
The absence of a mobile app is a consistent user complaint and a meaningful limitation for investors who want to monitor portfolios, receive alerts, or run quick screens from a phone. The browser experience on mobile is functional for reading research and checking basic portfolio data, but the wide data tables, multi-panel screener layouts, and complex analytical tools are not optimized for small screens. For a platform used primarily as a desktop research environment during dedicated analysis sessions, this matters less. For investors who want to actively manage their portfolio from a phone, it's a real friction point that other research platforms have addressed.
Key Takeaway: No mobile app is a meaningful limitation — Stock Rover is a desktop-first research environment, and investors who need robust mobile access should factor this into their evaluation.
Disclaimer
Was this helpful?

Written by
Kazi Mezanur RahmanFounder, independent researcher, and editor of DayTradingToolkit, a one-person publication focused on risk-first trading education, documented tool research, and clear explanations.
Keep Reading
Reviews
Finviz Review 2025: Is Finviz Elite Worth It For Traders?
An independent research review of Finviz. We break down the stock screener, heat maps, and compare Finviz Free vs. Elite. See if it's worth it for you.

Reviews
Benzinga Pro Review 2026: An Independent Research Review
This guide evaluates Benzinga Pro's news speed, squawk box, and screener for day trading. Here's our honest verdict on who should subscribe — and who should skip it.

Reviews
StocksToTrade Review 2026: Worth It for Penny Stocks?
StocksToTrade review: we tested its penny-stock scanners, Oracle AI, and $179.95/mo price. See whether it earns its cost — and who should pass.

Reviews
StockCharts Review 2026: Is It Worth It for Day Traders?
This guide evaluates StockCharts for day trading — charting depth, scan speed, the 15-second refresh problem, and pricing. Here's who it actually fits, and who should skip it.
Comments
No comments yet. Be the first to share your thoughts.