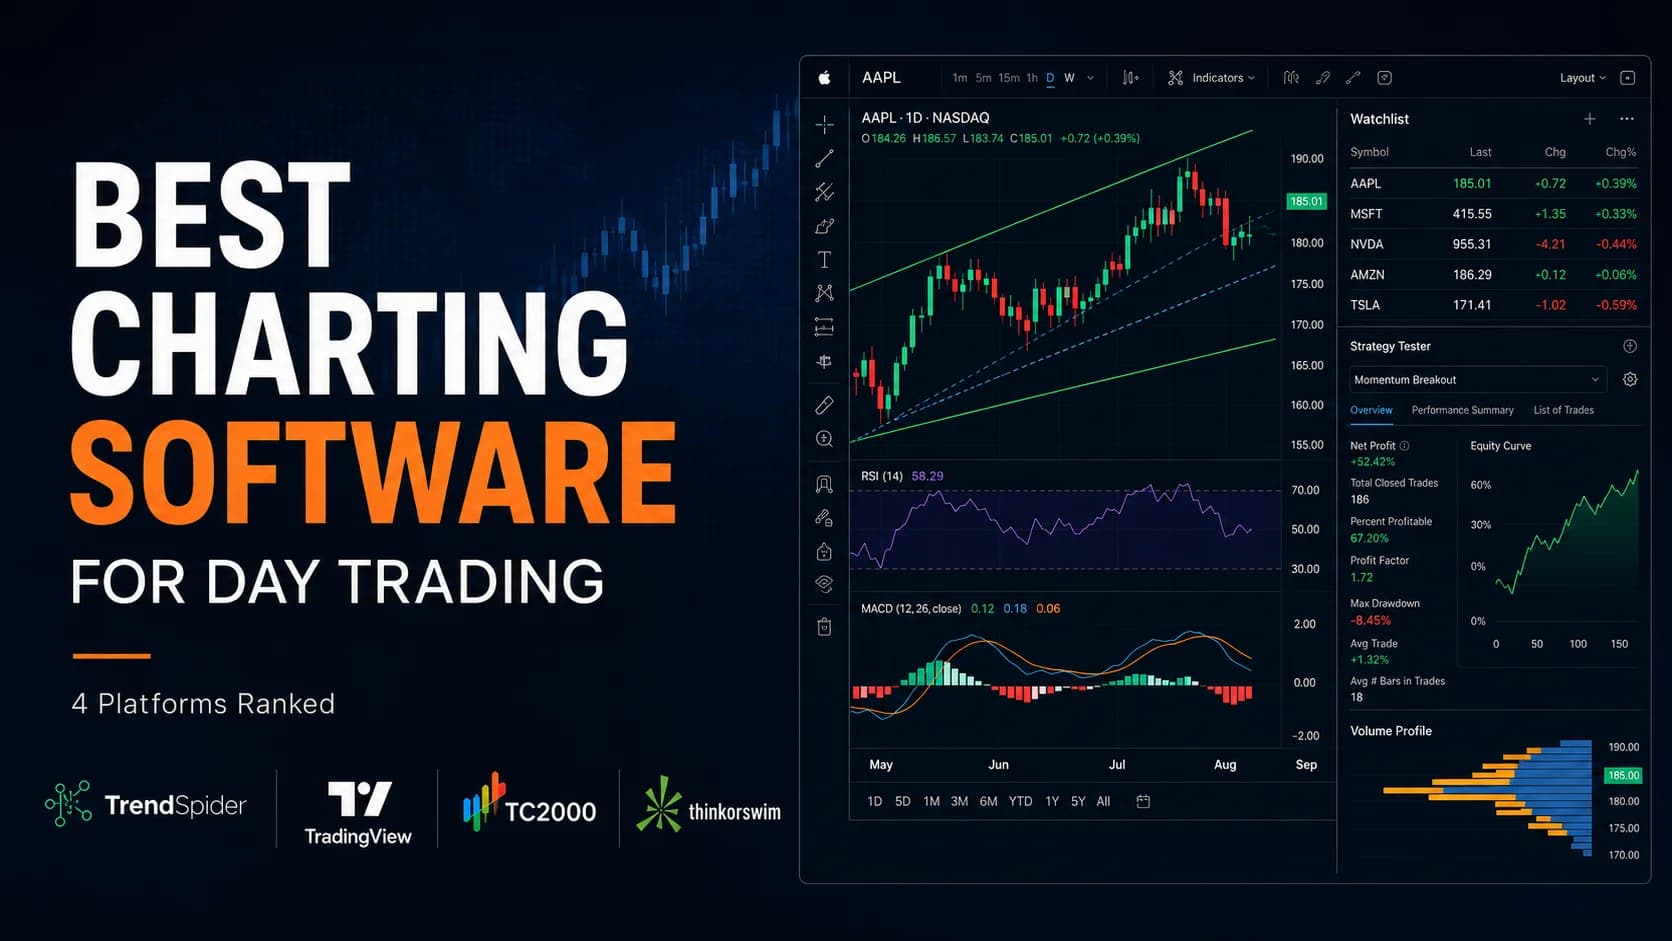
A great chart doesn't find you a trade. It tells you whether the trade you already found is any good — and increasingly, it can test that idea against years of history before you risk a dollar on it. That's a different job than scanning, and it's why the tools that do it well look nothing like a stock scanner.
This guide ranks four of the best charting software for day trading options on the market right now — TrendSpider, TradingView, TC2000, and thinkorswim — on automation depth, indicator library, real BacktestingThe process of running a defined trading strategy against historical price data to evaluate how it would have performed before risking real capital. A well-constructed backtest gives you a statistical baseline — win rate, profit factor, maxRead definition →, and price. Where a platform earns its reputation, that gets said plainly. Where it's the wrong fit for a specific kind of trader, that gets said just as plainly.
What is charting software? Charting software is a platform that displays price and VolumeVolume is the total number of shares (or contracts) traded during a given time period — it's the primary confirmation tool for all price action, because a price move accompanied by high volume indicates genuine market participation, while tRead definition → data visually, with tools to draw trendlines, apply technical indicators, and test trading ideas against historical data. The best charting platforms for day trading go further, automating pattern and TrendlineA trendline is a straight line drawn connecting two or more swing highs (in a downtrend) or swing lows (in an uptrend) that defines the slope and trajectory of a price trend — price bouncing off a trendline is a potential entry signal, whilRead definition → detection and letting you backtest a rule-based strategy without writing code.
The short version: TrendSpider is the best charting software for day trading if you want automated trendline detection, multi-timeframe analysis, and no-code backtesting in one platform — see current TrendSpider pricing. TradingView is the pick if you want the best free, global charting platform with the largest community of shared indicators — read the full TradingView review. thinkorswim is the strongest choice if you already have, or plan to open, a Schwab brokerage account and want professional-grade charting at zero extra cost — read the full thinkorswim review. Keep reading for the full breakdown, including where TC2000 fits in.
Here's how all four stack up at a glance:
- Platform
- TrendSpider
- Best For
- Automation & no-code backtesting
- Starting Price
- ~$51/mo (current promo, annual)
- Key Strength
- 300+ indicators, automated trendlines, Strategy Tester
- Get It
- See Pricing →
- Platform
- TradingView
- Best For
- Free & global charting
- Starting Price
- Free–$59.95/mo
- Key Strength
- Largest chart community, Pine Script, multi-asset
- Get It
- Read Review →
- Platform
- TC2000
- Best For
- Scanning + charting value
- Starting Price
- Free–$49.99/mo
- Key Strength
- 240+ indicators, PCF formulas, EasyScan
- Get It
- Read Review →
- Platform
- thinkorswim
- Best For
- Broker-included charting
- Starting Price
- Free (Schwab account)
- Key Strength
- Professional desktop platform, paperMoney simulator
- Get It
- Read Review →
| Platform | Best For | Starting Price | Key Strength | Get It |
|---|---|---|---|---|
| TrendSpider | Automation & no-code backtesting | ~$51/mo (current promo, annual) | 300+ indicators, automated trendlines, Strategy Tester | See Pricing → |
| TradingView | Free & global charting | Free–$59.95/mo | Largest chart community, Pine Script, multi-asset | Read Review → |
| TC2000 | Scanning + charting value | Free–$49.99/mo | 240+ indicators, PCF formulas, EasyScan | Read Review → |
| thinkorswim | Broker-included charting | Free (Schwab account) | Professional desktop platform, paperMoney simulator | Read Review → |
How We Ranked the Best Charting Software for Day Trading
Four criteria decide where each platform lands: automation depth (does it draw trendlines and flag patterns for you, or is it all manual), indicator and drawing-tool depth, whether real backtesting exists or it's just a pretty chart, and value relative to what a trader actually needs. None of these four is "best" in a vacuum — a systematic trader who backtests every idea before risking money needs something completely different from a discretionary trader who just wants a clean chart and a broker connection.
That's the lens for everything below. Most searches for the best technical analysis software 2026 has to offer turn up the same four names — the comparison table above breaks down which of these platforms plays which role for your workflow.
TrendSpider: Best Charting Software for Automation and No-Code Backtesting
TrendSpider takes the top spot in this comparison for the same reason it topped the scanner comparison: nothing else on this list turns raw price data into a fully automated, backtested trading system without writing a line of code — which is exactly why this guide ranks it the best automated technical analysis tool for day trading, not just the deepest one.
The charting engine itself is the most feature-dense on this list — 300+ built-in indicators, Raindrop® charts (a proprietary volume-at-price chart type most competitors don't offer), and automated trendlines and Fibonacci retracements that draw themselves across any timeframe instead of requiring you to eyeball SupportSupport is a price level where buying pressure has historically overcome selling pressure, causing price to stop declining and reverse — it's the floor where demand enters the market, and when it holds, it's a potential long entry; when it Read definition → and ResistanceResistance is a price level where selling pressure has historically overcome buying pressure, causing price to stall, reverse, or consolidate — it's the ceiling where supply enters the market and where breakout traders watch for either a coRead definition → by hand. Multi-timeframe analysis lets you check whether a daily setup holds up on the hourly and five-minute charts without flipping between separate windows.
What makes this the best AI charting platform on this list, rather than just a chart with more buttons, is Sidekick, TrendSpider's built-in AI assistant. Describe a setup in plain English — "stocks holding above the 50-day moving average with a bullish MACD crossover" — and Sidekick builds it as a live chart study or scanner, no coding required. For traders who do want to code, the AI Coding Assistant writes custom JavaScript indicators from a prompt, and the platform's own indicator engine remains fully accessible underneath for anyone who wants full control.
Where TrendSpider pulls furthest ahead of a pure charting tool is backtesting. TrendSpider backtesting runs through the Strategy Tester, which checks a rule-based setup against years of historical data in seconds — no spreadsheet, no code, no manual bar-by-bar review. That's what makes this the best no-code backtesting platform on this list: build the rule, run the test, read the equity curve, adjust, repeat. If the backtest holds up, the same strategy can deploy as a live Strategy Bot that routes orders to 30+ brokers and crypto exchanges through SignalStack, with 5 free automated trades a month included on every plan.
The catch is price and ramp time. Current promotional pricing runs from around $51/month on the Standard plan up to roughly $118/month on Advanced, billed annually with a discount locked in for the first 12 months — check current TrendSpider pricing for the exact numbers, since promotions change regularly. A 14-day trial is available for $19–$49 depending on the tier, and it's worth budgeting two to four weeks before you're getting full value out of the automation tools. One fair note on trials: the trial fee itself is non-refundable, but if you convert to a full plan and change your mind within 72 hours, a refund minus the trial fee is available on request. The full TrendSpider review covers every tier and feature in more detail.
TradingView: Best Free and Global Charting Platform
TradingView wins this list's accessibility category for a reason that hasn't changed in years: the free tier is genuinely usable, the paid tiers are reasonably priced, and no other charting platform on this list comes close to its community of shared scripts, ideas, and indicators.
The free plan covers a real chart with basic indicators and a limited number of saved layouts — enough to learn on, not quite enough for a serious daily workflow. Paid tiers scale predictably: Essential runs $14.95/month with 2 charts and 5 indicators per layout, Plus runs $29.95/month with 4 charts, 10 indicators, and intraday timeframes down to 1 second, and Premium runs $59.95/month with 8 charts, 25 indicators, 400 alerts, and non-expiring alerts across 4 monitors. All three paid tiers include a 30-day free trial, longer than anything else on this list, and annual billing knocks 13–17% off the monthly rate on every tier.
TradingView's real differentiator isn't any single feature — it's Pine Script, the platform's own scripting language, and the enormous public library of community-built indicators and strategies built on top of it. If you can describe a technical condition, there's a good chance someone has already coded it and published it for free. That's also what makes TradingView's free tier the best charting platform for beginners who aren't ready to commit to a paid tool yet: you can learn on real charts, with real community indicators, without spending anything.
What TradingView isn't is an automation platform in TrendSpider's sense. Trendlines, support and resistance, and pattern recognition are manual unless you code them yourself in Pine Script or install a community script that does it — there's no Sidekick-style plain-English assistant building the analysis for you. If you're specifically researching tradingview alternatives for day traders because you want that automation built in rather than coded by hand, TrendSpider is the direct next comparison to make.
TC2000: Best Value for Scanning and Charting Together
TC2000 earns its spot on this list the same way it earned one in the scanner comparison: 25 consecutive years topping Stocks & Commodities Magazine's software rankings, a documented voting record rather than a marketing claim.
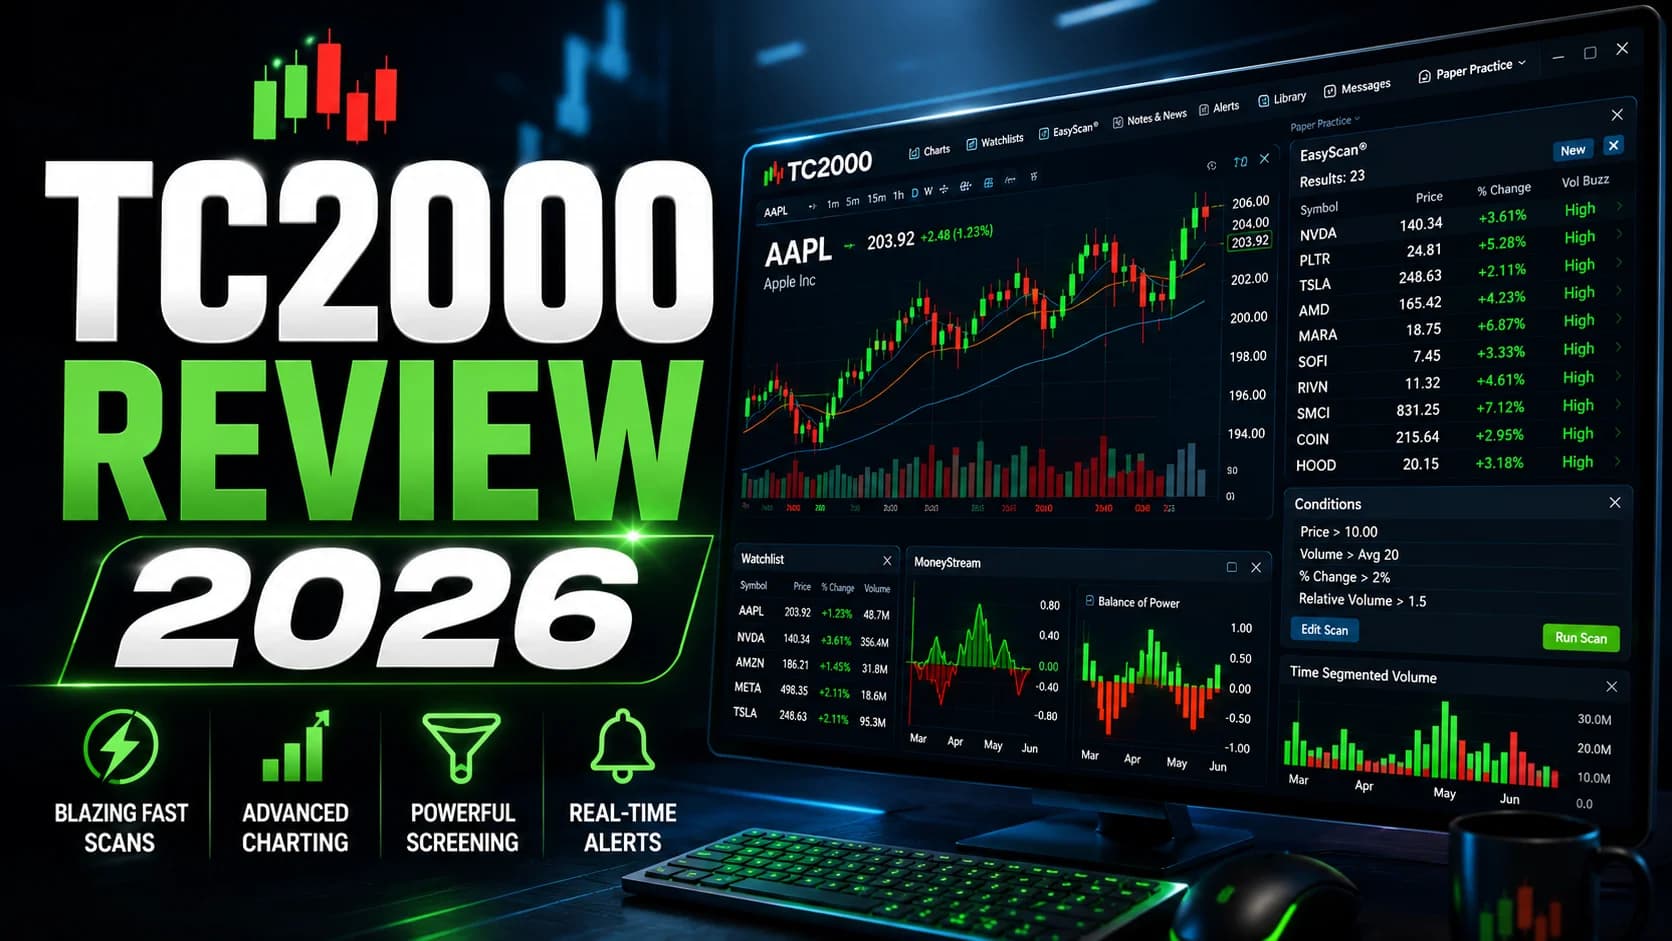
For charting specifically, TC2000 brings 240+ indicators and 129+ fundamental variables you can overlay directly on a price chart — a combination that lets you view technical and fundamental data side by side in a way pure technical-analysis platforms don't attempt. PCF (Personal Criteria Formula), TC2000's proprietary scripting language, lets you build custom indicators, alerts, and scans from the same formula engine, so a condition you define once becomes a chart study, an alert, or a scan without rebuilding it three separate times.
Where TC2000 pulls ahead of a pure charting platform is the scanning side bolted onto the same system: EasyScan processes the entire U.S. equity universe in roughly two seconds, fast enough that the S&P 500 alone scans in under 160 milliseconds. For a trader who wants one subscription that handles both charting and scanning reasonably well, rather than paying for two specialized tools, that combination is hard to beat on price.
The pricing structure needs a close read: base plans run free to about $49.99/month, but real-time equity data ($14.99/month) and real-time options data ($9.99/month) are separate add-ons most active traders will need. Budget $70–$100+/month total for a fully-featured setup, not the advertised base price. The full TC2000 review covers the PCF learning curve and every pricing tier in depth.
thinkorswim: Best Broker-Included Charting Platform
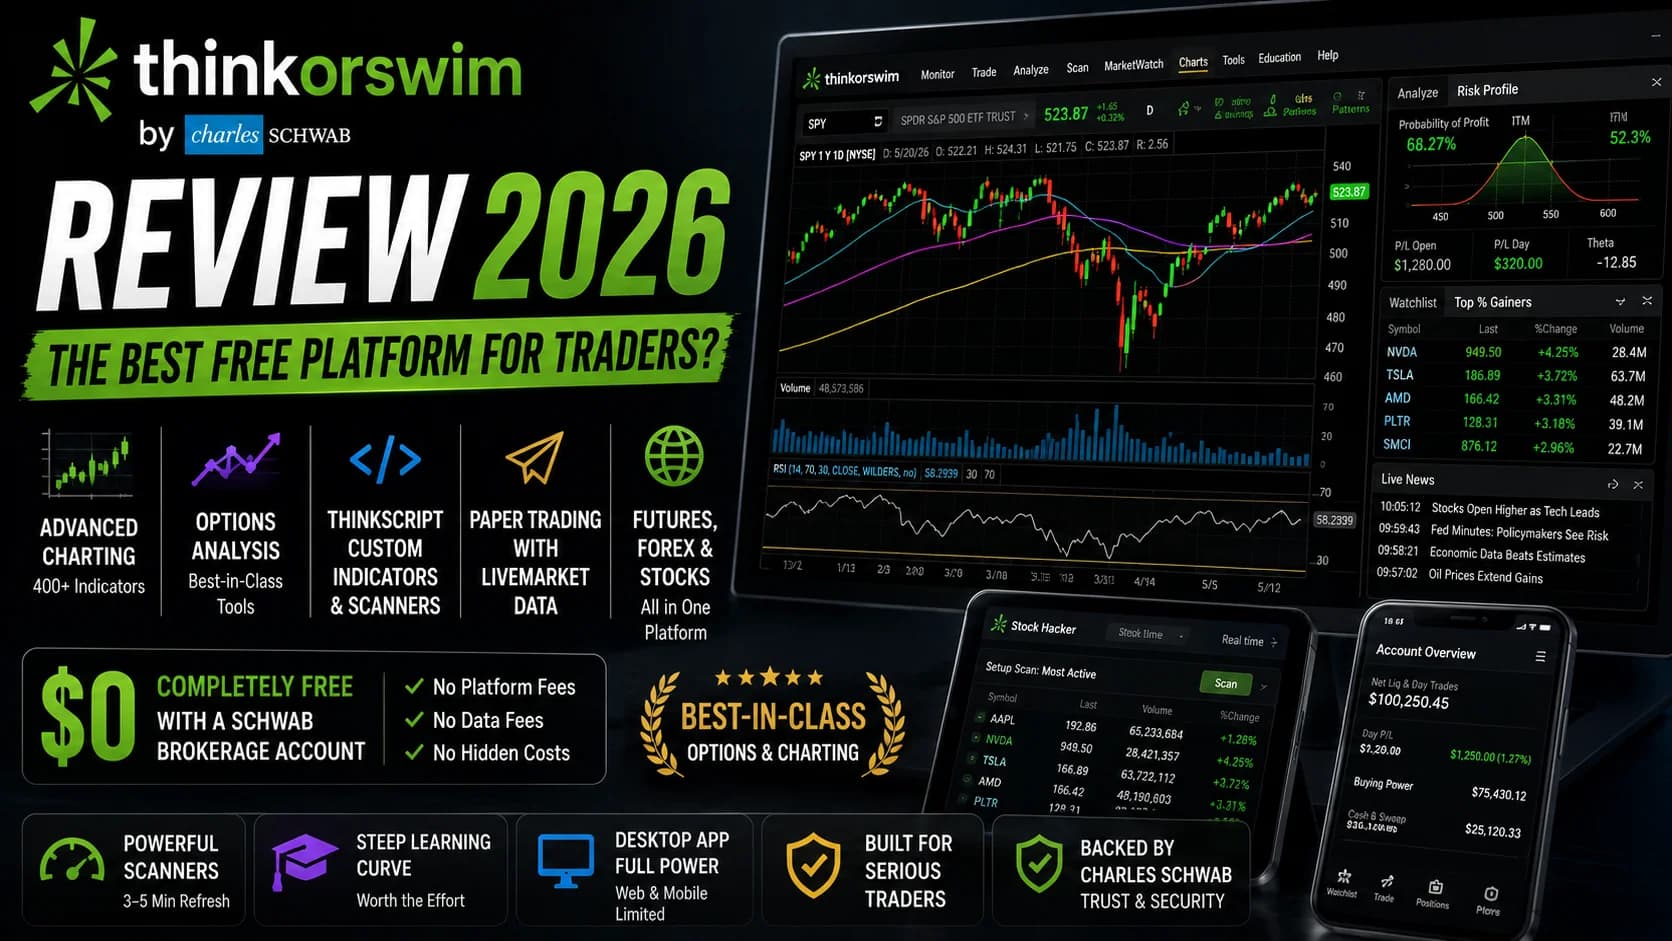
thinkorswim earns its spot here for a reason no independent platform can match: it's professional-grade charting and technical analysis included free with a Charles Schwab brokerage account, no separate subscription required.
The platform remains branded thinkorswim under Schwab's ownership, available as a full desktop application, a mobile app, and a lightweight web version, and Schwab continues actively developing it — including a 2026 rollout of extended trading on 1,100+ stocks and ETFs, a feature few competitors offer at any price. The desktop platform includes a deep technical indicator library, fully customizable chart layouts, and paperMoney, a genuinely full-featured paper trading simulator that lets you test strategies with real market data before risking a dollar.
What thinkorswim isn't is automated in TrendSpider's sense, or community-driven in TradingView's sense. Trendline and pattern analysis is manual, and there's no equivalent to Sidekick or Pine Script's shared script library. The tradeoff is straightforward: you give up automation and community tools, and in exchange you get a serious charting platform at zero incremental cost, provided you're already trading through Schwab or willing to open an account there. The full thinkorswim review covers the desktop platform, mobile app, and paperMoney simulator in complete detail.
Scanner vs. Charting Platform: Which Should You Buy First?
These two tool categories get confused constantly, and the confusion costs traders money — buying a $90-a-month charting platform when what they actually needed was a scanner, or the reverse.
A scanner's job is finding candidates: it watches the whole market and surfaces stocks that meet your criteria right now, before you've looked at a single chart. A charting platform's job starts after that — once you have a candidate, it's where you analyze the setup, check multiple timeframes, and decide whether the trade is actually good. Neither replaces the other, and confusing the two is why some traders end up paying for a feature-rich charting platform while still manually scrolling through a watchlist looking for ideas.
If you don't yet have a reliable way to find candidates each morning, a scanner solves that problem first — our comparison of the best stock scanners for day trading covers the top options. If you already have a watchlist or scanner in place and the gap is deciding whether a specific setup is worth taking, that's exactly what the four platforms in this guide are built for.
Which Charting Platform Should You Actually Choose
If you want the platform to do real analytical work for you — drawing trendlines, flagging patterns, and testing a strategy against years of data — TrendSpider is the strongest fit, and the automation is worth the price for anyone trading systematically enough to benefit from it.
If you want to learn on a genuinely capable free tool, tap into the largest library of community-built indicators anywhere, or trade multiple asset classes beyond U.S. equities, TradingView is the better starting point.
If you want one subscription that reasonably handles both scanning and charting without paying for two separate platforms, TC2000's combination is hard to beat on value. And if you already bank or trade through Schwab, thinkorswim gives you professional-grade charting at no incremental cost — there's little reason to pay for a separate platform until thinkorswim's manual, non-automated workflow genuinely becomes the bottleneck.
There's no universally correct best charting software for day trading. There's a correct pick for how you trade, and the four breakdowns above should make that call obvious.
TrendSpider Wins on Automation — TradingView Wins on Value
For traders who want charting and backtesting automated rather than done by hand, TrendSpider is the strongest platform on this list — 300+ indicators, automated trendlines, and no-code backtesting through the Strategy Tester. TradingView remains the best starting point for anyone who wants a genuinely capable free tool or the largest community of shared indicators, and TC2000 or thinkorswim are the stronger picks if scanning-plus-charting value or broker-included pricing matter more than automation.
Active day traders who want automated technical analysis and no-code backtesting instead of manually drawing trendlines and testing strategies by hand.
Frequently Asked Questions
Which charting platform should I use for day trading?
The right platform depends on how much of the analytical work you want automated versus doing by hand, and whether you're already paying for a broker platform that includes charting for free. Traders who backtest ideas systematically get the most out of TrendSpider specifically; traders who just want a clean, reliable chart do fine with TradingView or thinkorswim.
Key Takeaway: Match the platform to how much automation you actually need, not just which one has the most indicators.
Is TradingView enough for day trading?
Where TradingView falls short is automation: it won't draw trendlines or flag patterns for you the way TrendSpider does, and any custom logic has to be coded in Pine Script or borrowed from the community library. For a discretionary trader who reads charts manually, that's not a real gap. For a systematic trader who wants backtesting and automated pattern detection built in, it is.
Key Takeaway: TradingView covers charting fully — it's automation and no-code backtesting where it hands off to a platform like TrendSpider.
Scanner vs charting platform — which do I need first?
A scanner solves the "what should I look at" problem; a charting platform solves the "is this actually a good trade" problem. Most traders eventually need both, but the scanner comes first chronologically, since there's nothing to chart until the scanner (or a watchlist) has surfaced a candidate.
Key Takeaway: Start with a scanner if you're finding trades manually — see our best stock scanners comparison for the top options.
What is the best charting platform for beginners?
Beginners are usually still learning what a good setup even looks like, and a $90-a-month automation platform amplifies a process that doesn't exist yet rather than replacing the need to learn it. TradingView lets a beginner build real charting habits for free, with the option to upgrade once specific limits — chart count, alert count, real-time data — actually start costing them opportunities.
Key Takeaway: Start free on TradingView, then consider TrendSpider once you know exactly which parts of your analysis you want automated.
Is TrendSpider worth the price for charting alone?
TrendSpider's price is justified by what it replaces: automated technical analysis, a no-code backtesting engine, and broker automation that would otherwise require separate tools or custom code. If none of that matters to your workflow, you're paying for automation you won't use.
Key Takeaway: Pay for TrendSpider specifically for the automation and backtesting — not just for the charts themselves.
Does thinkorswim cost anything?
The only real cost is opening (or maintaining) a Schwab brokerage account, which has no account minimum required to access thinkorswim itself. That makes it one of the only genuinely professional-grade charting platforms on this list with zero incremental software cost.
Key Takeaway: If you already trade through Schwab, thinkorswim's charting is effectively free — there's no reason to pay for a separate platform until you need automation it doesn't offer.
What is the best AI charting platform for day trading?
TradingView has AI-adjacent features through community scripts and third-party add-ons, but nothing built natively into the platform that matches Sidekick's plain-English scan and chart-building workflow. TC2000 and thinkorswim don't offer a comparable AI layer at all.
Key Takeaway: For AI-assisted chart analysis specifically, TrendSpider is the clear pick on this list.
Can I use TradingView and TrendSpider together?
Because both platforms cover core charting fully, running both mainly makes sense if you specifically want TradingView's community script library alongside TrendSpider's automation, rather than needing both for the same task. For most traders, picking one based on how much automation you need is the more cost-effective route.
Key Takeaway: Running both is possible but usually redundant — choose based on whether automation or community and asset coverage matters more to you.
What is the best no-code backtesting platform?
TC2000 offers a form of backtesting through PCF formulas, but it requires learning TC2000's scripting syntax first, which isn't truly no-code. TradingView's backtesting (Pine Script strategies) also requires code. thinkorswim doesn't offer a dedicated no-code backtesting engine at all.
Key Takeaway: For backtesting without writing or learning any code, TrendSpider's Strategy Tester is the only real no-code option on this list.
How much does charting software cost?
TradingView runs $14.95–$59.95/month on paid tiers. TC2000's effective cost with real-time data add-ons lands around $70–$100+/month. TrendSpider runs roughly $51–$118/month depending on tier, with promotional annual pricing. Check the deals page for current discounts before subscribing to any of them.
Key Takeaway: Price scales with automation and data depth — decide what you actually need before comparing sticker prices.