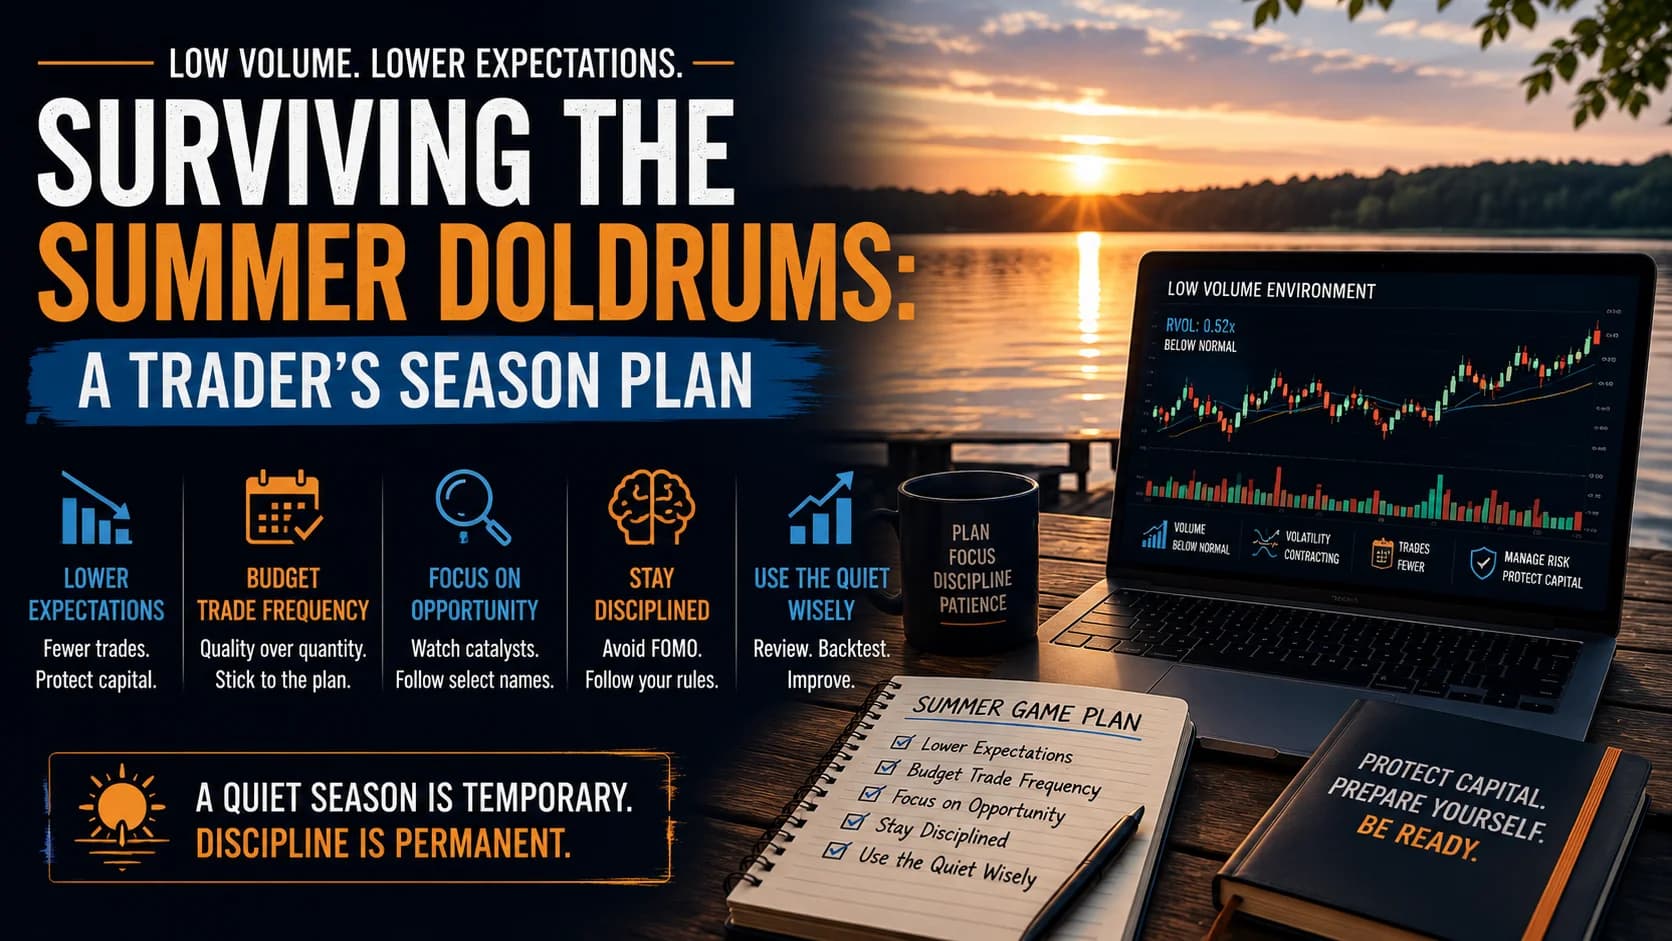
A single quiet session is a tactical problem — smaller size, tighter spreads to watch, maybe fewer setups that day. A six-week stretch of quiet sessions is a different kind of problem entirely. It's not about surviving one thin afternoon; it's about not slowly eroding an account, or a mindset, across an entire season where the market simply has less to offer than usual.
That's the GapA gap is a price discontinuity on a chart where a stock opens significantly higher or lower than the previous session's close, leaving a visible empty space — gap-ups are driven by overnight buying pressure or positive news; gap-downs by seRead definition → this guide fills. The Spread-Adjusted Range Scalp covers the mechanics of a single trade during a LiquidityLiquidity in trading refers to how easily you can enter and exit a position at a fair price — a liquid stock has high volume and a tight bid-ask spread, allowing large orders to be filled quickly without moving the price, while an illiquid Read definition → SqueezeA squeeze (short squeeze) occurs when a stock that is heavily shorted rises sharply, forcing short sellers to buy back shares to cover their losing positions — the forced buying adds fuel to the upward move, creating a feedback loop that caRead definition →. This guide covers what happens above that — the weekly and monthly decisions about frequency, goals, and where to look for opportunity — when the entire summer or holiday stretch, not just one session, turns quiet.
What is the doldrums survival strategy? It's a season-level framework for adjusting trading behavior — goals, trade frequency, watchlist focus, and daily routine — across the multi-week stretches (typically summer months and the weeks around major holidays) when broad market VolumeVolume is the total number of shares (or contracts) traded during a given time period — it's the primary confirmation tool for all price action, because a price move accompanied by high volume indicates genuine market participation, while tRead definition → and volatility are reliably lower than normal. Rather than one trade setup, it's the set of decisions that determine whether a trader comes out of a quiet season with their account and DisciplineTrading discipline is the consistent application of your predefined rules — entries, stops, targets, position sizing, maximum daily loss — regardless of what you're feeling in the moment.Read definition → intact.
Why This Season Has a Reputation, and What That Reputation Actually Means
"Sell in May and go away" is one of the oldest sayings in markets, and it has real academic backing behind it. Bouman and Jacobsen (2002), published in the American Economic Review, documented what they called the Halloween effect: stock returns from November through April have historically outperformed returns from May through October, and the pattern held across the large majority of the 37 countries they examined.
That research is worth knowing, but it needs a careful caveat: it's a study of buy-and-hold equity returns over six-month windows, not a statement about intraday liquidity or day-trading opportunity. The seasonal return pattern and the seasonal volume decline covered in the companion low-volume guide are related — both stem from reduced institutional participation over the summer — but they're not the same phenomenon, and conflating "stocks tend to return less in summer" with "there's nothing worth day trading in summer" overstates what the research actually shows.
Recalibrating What "Normal" Looks Like for the Season
The single most common mistake during a genuinely quiet season isn't a bad trade — it's holding onto a normal-season goal during an abnormal-season stretch. A trader who expects the same number of qualifying setups, the same monthly P&L, and the same trade frequency during the last two weeks of December that they'd expect in March is setting themselves up to force trades that wouldn't otherwise qualify.
The healthier framing: a quiet season with fewer trades and smaller gains isn't underperformance — it's the correct output of correctly reading the conditions. Trade count and P&L should be expected to compress during these windows, and treating that compression as a problem to fix by trading more, rather than a normal feature of the season, is where account damage tends to start.
The Season Adaptation Protocol: A Framework Specification
- Component
- Market Conditions Required
- Rule
- A recognized low-volume calendar window: the stretch from roughly Memorial Day through Labor Day, the two weeks surrounding Thanksgiving, or the final two weeks of December through the first week of January
- Component
- Time of Day
- Rule
- No change to normal session structure — the adjustment operates at the weekly and monthly level, not the intraday level
- Component
- Stock Selection Criteria
- Rule
- Rotate watchlist focus toward names with idiosyncratic catalysts (earnings, guidance updates, litigation, sector-specific news) rather than broad-tape momentum, since individual catalysts continue regardless of the broader market's seasonal volume
- Component
- Entry Trigger
- Rule
- Only take trades that already qualify under an existing intraday setup (such as the Spread-Adjusted Range Scalp) — this framework doesn't create new entry signals, it governs how often and under what conditions those signals get acted on
- Component
- Stop Loss / Profit Target
- Rule
- Unchanged from whichever underlying setup is being traded — the adjustment here is frequency and sizing, not trade mechanics
- Component
- Trade Management
- Rule
- Set a weekly trade-frequency cap in advance (for example, no more than half the normal weekly trade count) and a weekly checkpoint to review whether that cap is being respected
- Component
- Invalidation Criteria
- Rule
- Sustained RVOL returning above roughly 0.8x normal for several consecutive sessions signals the season-level adjustment is no longer needed — resume standard size and frequency rather than continuing reduced-season rules out of habit
| Component | Rule |
|---|---|
| Market Conditions Required | A recognized low-volume calendar window: the stretch from roughly Memorial Day through Labor Day, the two weeks surrounding Thanksgiving, or the final two weeks of December through the first week of January |
| Time of Day | No change to normal session structure — the adjustment operates at the weekly and monthly level, not the intraday level |
| Stock Selection Criteria | Rotate watchlist focus toward names with idiosyncratic catalysts (earnings, guidance updates, litigation, sector-specific news) rather than broad-tape momentum, since individual catalysts continue regardless of the broader market's seasonal volume |
| Entry Trigger | Only take trades that already qualify under an existing intraday setup (such as the Spread-Adjusted Range Scalp) — this framework doesn't create new entry signals, it governs how often and under what conditions those signals get acted on |
| Stop Loss / Profit Target | Unchanged from whichever underlying setup is being traded — the adjustment here is frequency and sizing, not trade mechanics |
| Trade Management | Set a weekly trade-frequency cap in advance (for example, no more than half the normal weekly trade count) and a weekly checkpoint to review whether that cap is being respected |
| Invalidation Criteria | Sustained RVOL returning above roughly 0.8x normal for several consecutive sessions signals the season-level adjustment is no longer needed — resume standard size and frequency rather than continuing reduced-season rules out of habit |
The Trade Management row is the actual core of this framework. Everything else is context; the weekly frequency cap and checkpoint is the mechanism that actually prevents a quiet season from turning into a habit of forcing marginal trades to hit a normal-season quota.
Using the Quiet Season Productively
A multi-week stretch with fewer qualifying setups is also a stretch with more available time, and that time has a better use than staring at a flat chart waiting for something to happen.
Backtesting and strategy review. A season with fewer live trades is a natural point to revisit whether a strategy's rules are actually being followed, and whether the rules themselves still hold up against recent data. This is deliberately not the time to invent a new strategy from scratch — it's the time to stress-test the ones already in use.
Trading journal review. Looking back over the trades from the busier months — which setups actually performed, which ones were taken on marginal signals, where rules were bent — tends to be a more honest exercise when there isn't a live position open at the same time demanding attention.
Process refinement over new signal-hunting. The temptation during a quiet stretch is to go looking for a new indicator or strategy to fill the gap left by fewer setups. The more productive use of the same time is usually refining execution on the setups already proven to work, since a quiet season is a poor environment to be testing something genuinely new for the first time.
Education and lower-stakes skill-building. Reviewing the mechanics of setups used less frequently, working through unfamiliar market conditions in a paper-trading environment, or simply reading deeper into the reasoning behind an existing strategy all carry lower opportunity cost during a season with fewer live setups to begin with. None of this replaces live trading experience, but a quiet season is a reasonable stretch to prioritize it over forcing trades that wouldn't otherwise qualify.
Where to Actually Look During a Quiet Broad Tape
The broad market being quiet doesn't mean every corner of it is. Individual stocks still report earnings, still issue guidance updates, still get caught up in company-specific news — none of which pauses because the S&P 500's average daily volume has dipped for the summer.
Shifting watchlist attention toward names with a specific, dated catalyst — rather than names expected to move simply because of broad-market momentum — tends to produce a higher hit rate during these stretches. A momentum scanner tuned for a normal, higher-volume market can produce a lot of noise during a genuinely quiet season; a catalyst-focused watchlist sidesteps that problem by looking for reasons a specific stock might move regardless of what the indices are doing.
This also means accepting a smaller, more curated watchlist rather than a wider one during these stretches. A broad scan run with normal-season filters during a quiet summer week will often surface names that technically match the criteria but lack any real catalyst behind the movement — the kind of low-conviction signal that's easy to mistake for a genuine setup precisely because there's less real competition for attention on a quiet day.
Where the Season Adaptation Protocol Breaks Down
The most common failure is ignoring the weekly frequency cap once it starts to feel restrictive. A trader who sets a cap in week one, hits it by Wednesday, and then keeps trading anyway on the reasoning that "this setup looks really clean" has abandoned the actual mechanism that makes this framework work. The cap only functions if it's respected specifically in the moments when it feels most inconvenient.
It also fails when a trader assumes the entire season is uniformly dead. Volume within a summer week, or a holiday stretch, isn't flat — a Tuesday morning after a long weekend can look very different from the Friday before it. Applying the same reduced-frequency assumption to every single session inside the window, rather than checking conditions session by session, misses genuine opportunities that occasionally surface even within a broadly quiet stretch.
And it fails when the productive use of downtime — backtesting, journal review — turns into an excuse to avoid trading altogether out of a vague sense that "nothing is worth trading right now." The framework calls for reduced frequency and tighter selectivity, not zero activity; a season with genuinely no qualifying setups at all across several weeks is unusual, and more often reflects an overly strict interpretation of the frequency cap than an accurate read of actual conditions.
Re-Engaging as Volume Returns
Labor Day and the first weeks of September are the conventional marker for the summer doldrums ending, though September itself has its own well-documented reputation as a historically weaker month for returns — a genuinely different issue from the volume question this guide focuses on, and worth not conflating with a simple "volume is back, so conditions are back to normal" assumption.
The more reliable signal is the RVOL and spread data itself, tracked the same way described in the companion low-volume guide, rather than the calendar alone. A sustained return of RVOL to something closer to typical levels across several consecutive sessions is the actual trigger for resuming standard size and frequency — not an assumption based purely on which week of the calendar it happens to be.
Where This Fits a Complete Trading Plan
A trading plan that only accounts for a single session's conditions is missing the layer this guide addresses — the weekly and monthly decisions that sit above any individual trade. Building known low-volume calendar windows into a plan in advance, alongside a pre-committed frequency cap for each one, turns a stretch that otherwise invites frustration-driven overtrading into a predictable, manageable part of the year.
For the specific intraday mechanics this framework governs the frequency of, the Spread-Adjusted Range Scalp covers the trade-level RVOL and spread rules in depth. For the discipline required to actually respect a pre-set limit once it starts to feel restrictive, developing patience and staying objective is worth reviewing alongside this guide. For the rest of the market-condition playbooks this framework complements, the Strategies Hub organizes the full library by regime.
Frequently Asked Questions About Surviving Low-Volume Seasons
How is this different from the Spread-Adjusted Range Scalp covered elsewhere in this hub?
This guide doesn't introduce a new entry signal — it assumes an underlying setup like the Spread-Adjusted Range Scalp is already being used, and adds a season-level layer of frequency budgeting and expectation management on top of it.
Key Takeaway: Use this framework to decide how often to trade during a quiet season; use the underlying setup to decide when to actually enter.
Does "sell in May and go away" mean day trading is pointless during the summer?
The academic finding supports a general seasonal pattern in longer-horizon returns, driven partly by the same reduced institutional participation that also drives the volume decline day traders experience. But a weaker average six-month return for buy-and-hold investors doesn't mean there's nothing tradeable intraday during that stretch — it means broad conditions are different, which is exactly what this guide is built to help navigate.
Key Takeaway: Treat the seasonal return research as context for why volume declines, not as a reason to stop looking for intraday setups entirely.
Why is a weekly trade-frequency cap more useful than a daily one during a quiet season?
A rigid daily cap can either sit unused on a genuinely dead session or get hit prematurely on a session that happened to produce more setups than usual, in both cases missing the point. A weekly cap, reviewed at a set checkpoint, absorbs that natural session-to-session variation more sensibly.
Key Takeaway: Set the frequency cap at the weekly level to accommodate normal variation between individual sessions.
What's the risk of using downtime to build an entirely new strategy?
Backtesting or refining an existing, already-proven approach is a better use of a quiet stretch than developing something new from scratch, precisely because the conditions during the test period are atypical. A strategy that appears to work during a low-volume window may behave completely differently once normal volume returns.
Key Takeaway: Use quiet-season downtime to refine existing strategies, not to validate brand-new ones under atypical conditions.
How can a trader tell when the low-volume season has actually ended?
Labor Day and early September are conventional markers for the summer doldrums ending, but actual volume doesn't always snap back to normal precisely on that date. Tracking RVOL directly, rather than assuming conditions have normalized simply because a particular week has arrived, avoids either extending reduced-size trading longer than necessary or resuming normal size before conditions have actually caught up.
Key Takeaway: Confirm the season has ended with actual RVOL data, not just the calendar.
Why does watchlist focus need to shift during a quiet broad market?
A scanner tuned for momentum in a normally active market can generate a lot of low-quality signals when overall participation is thin. Catalyst-driven names offer a reason for movement independent of the broader market's seasonal volume decline.
Key Takeaway: Prioritize stocks with a specific, dated catalyst over broad momentum scans during a quiet season.
Is it ever appropriate to stop trading entirely during a low-volume stretch?
Standing aside entirely is a valid response to a quiet season, provided it's chosen intentionally as part of the season plan rather than adopted reactively after a stretch of forced, marginal trades that already did some damage.
Key Takeaway: A full break from trading is a legitimate season-level choice if planned deliberately, not a fallback after frustration has already set in.
How should position sizing during the doldrums season compare to sizing during a single low-volume session?
This framework doesn't replace the spread-and-RVOL-based sizing rules from the underlying setup — it operates at a different layer, governing how many qualifying trades get taken across a week rather than how large any single qualifying trade should be.
Key Takeaway: Keep per-trade sizing rules unchanged; add a frequency cap as the season-specific adjustment on top.
Why might September actually be a riskier month than the summer stretch preceding it?
Volume often begins returning around Labor Day, but that doesn't mean market conditions immediately revert to whatever "normal" looked like before the summer stretch began. Treating early September as an automatic return to standard conditions, rather than checking RVOL and broader context directly, risks missing a different seasonal pattern layered on top of the volume recovery.
Key Takeaway: Don't assume "volume is back" and "conditions are fully normal" are the same thing heading into September.
What's the biggest behavioral risk specific to a multi-week quiet stretch, as opposed to a single quiet session?
A single bad decision during one thin session is a normal, recoverable part of trading. The specific risk of a multi-week low-volume stretch is that the same small mistake, repeated with slightly higher frequency across many sessions because the trader hasn't adjusted their expectations, adds up to a much larger cumulative cost than any single trade would suggest.
Key Takeaway: Judge the season's damage by the cumulative pattern across weeks, not by any single session in isolation.
Disclaimer
Article Sources
- Bouman, S., & Jacobsen, B. (2002). "The Halloween Indicator, 'Sell in May and Go Away': Everywhere and All the Time." American Economic Review, 92(5), 1618–1635. — the foundational academic study documenting the seasonal return pattern discussed in this guide.
- Sell in May — Wikipedia - summarizes the history and academic literature on the "Sell in May" seasonal pattern, including its origins and documented persistence across markets.en.wikipedia.org
- Is 'Sell in May and Go Away' a Market Myth? — American Century Investments - provides a counterpoint perspective on the reliability of calendar-based seasonal strategies for long-term investors.americancentury.com