If you could only have one indicator on your chart — just one — most professional day traders would give you the same answer.
VWAP.
Not RSI. Not MACD. Not Bollinger Bands. The Volume Weighted Average Price. It’s the single line that institutional traders, hedge funds, and algorithms all watch. It’s the benchmark that billion-dollar trading desks use to measure whether their executions were good or bad. And it’s available for free on virtually every charting platform.
Yet most beginners have never heard of it, or they glance at it once, see a squiggly line, and move on to something flashier.
That’s a mistake. If you’ve been following our Beginner’s Guide series, you’ve already learned to read candlestick charts, spot support and resistance, use basic indicators, understand volume, and choose the right chart timeframes. VWAP ties several of those concepts together into one tool that answers a deceptively simple question: what’s the fair price for this stock today?
Let’s break it down.
What Is VWAP? (Volume Weighted Average Price in Plain English)
VWAP stands for Volume Weighted Average Price. It’s a single line drawn on your intraday chart that represents the average price a stock has traded at throughout the day — weighted by volume.
That last part is critical. “Weighted by volume” means VWAP doesn’t treat every trade equally. It gives more importance to prices where more shares changed hands. If 2 million shares traded at $50 during a morning surge but only 100,000 shares traded at $52 during a quiet lunch hour, VWAP will be much closer to $50 than to $52 — because that’s where the real action happened.
Here’s an analogy that makes this click instantly.
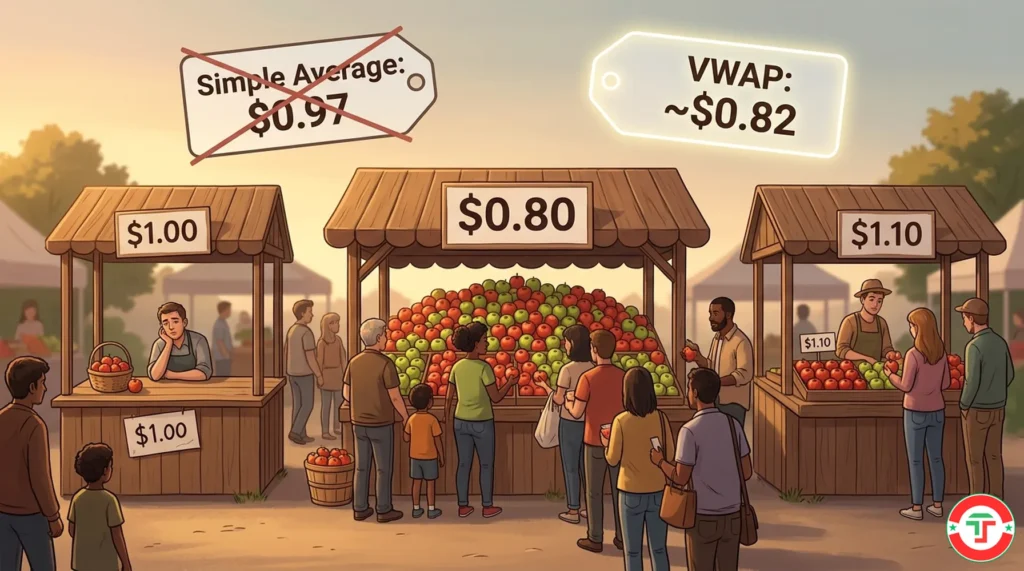
Imagine you’re at a farmer’s market, and you want to know the “real” price of apples that day. One vendor sold 10 apples at $1 each early in the morning. Another vendor sold 500 apples at $0.80 each during the lunch rush. A third sold 20 apples at $1.10 in the afternoon.
A simple average of those three prices is $0.97. But that’s misleading — it treats the guy who sold 10 apples the same as the one who sold 500. The volume-weighted average would be much closer to $0.80, because that’s where the overwhelming majority of apples actually changed hands. The volume-weighted price reflects reality. The simple average doesn’t.
VWAP does the same thing for stock prices. It tells you: of all the shares that traded today, what’s the true average price that most of them traded at?
That number — that single line on your chart — becomes the day’s “fair value.” Everything above it is arguably expensive relative to the day’s activity. Everything below it is arguably cheap.
How VWAP Is Calculated (You Don’t Need the Math — But Here’s the Idea)
Good news: you will never need to calculate VWAP by hand. Every major charting platform does it automatically. But understanding the logic behind the calculation helps you trust and interpret the indicator.
The concept is straightforward:
Step 1: For each time period on your chart (each 1-minute or 5-minute candle), take the typical price — the average of the high, low, and close for that candle.
Step 2: Multiply that typical price by the volume traded during that period. This gives you the “dollar value” of all shares traded in that window.
Step 3: Keep a running total of all those dollar values from the market open onward.
Step 4: Divide that running total by the running total of all volume traded.
The result is a single number that updates continuously throughout the day: the cumulative average price weighted by cumulative volume.
Two things about this process matter for how you use VWAP:
First, VWAP is cumulative. It starts calculating at the market open and incorporates every trade as the day progresses. This means early in the day, VWAP moves quickly because it doesn’t have much data yet. By midday, it becomes much more stable because it’s averaging hours of trading activity. By the close, it barely moves at all.
Second, VWAP resets every single day. When the market opens tomorrow, yesterday’s VWAP is gone. A brand-new calculation starts from scratch. This is fundamentally different from a moving average — which rolls across multiple days — and it’s one of the reasons VWAP is exclusively an intraday tool.
Why VWAP Is Different From Moving Averages
If you’ve already learned about moving averages in our Basic Indicators guide, you might be wondering: isn’t VWAP just another moving average? It looks similar on a chart — a line that follows price.
Not quite. There are three crucial differences.
Difference 1: VWAP includes volume. Moving averages don’t.
A simple moving average (SMA) or exponential moving average (EMA) calculates the average price over a number of periods — say, 20 candles. Every candle counts the same, regardless of whether 10 shares traded or 10 million. VWAP weights by volume, so a candle where 5 million shares traded at $50 has far more influence than a candle where 50,000 shares traded at $52. This makes VWAP a more accurate reflection of where the real money traded.
Difference 2: VWAP resets daily. Moving averages don’t.
A 20-period moving average on a daily chart incorporates the last 20 days. It carries history forward indefinitely. VWAP starts fresh every morning. By design, it captures only today’s activity, making it purpose-built for intraday trading.
Difference 3: VWAP is a benchmark. Moving averages are trend tools.
Moving averages help you identify the direction and strength of a trend. VWAP tells you something different — whether the current price is above or below the session’s fair value. It’s less about “where is price going?” and more about “is price expensive or cheap right now relative to today’s activity?”
This distinction matters enormously. We’ll dig much deeper into moving averages and how they complement VWAP in our dedicated Moving Averages guide. For now, understand that VWAP and MAs answer different questions — and many day traders use both.
Why Institutions Obsess Over VWAP — And Why That Matters to You
Here’s the part most beginner guides skip, and it’s arguably the most important piece of the puzzle.
VWAP isn’t just popular with day traders. It’s the primary execution benchmark used by institutional traders — hedge funds, mutual funds, pension funds, and the algorithmic systems that execute their orders.
When a large institution needs to buy 500,000 shares of a stock, they can’t just click “buy” and fill the entire order at once. That would move the price dramatically against them. Instead, they use algorithms to break the order into thousands of smaller pieces executed throughout the day. And the benchmark they use to measure whether those algorithms did a good job? VWAP.
If a fund’s algorithm achieved an average fill price below VWAP — meaning they bought cheaper than the session’s volume-weighted average — that’s considered a successful execution. If they paid more than VWAP, the execution was poor. Traders can literally lose their jobs over consistently filling above VWAP.
Why does this matter to you as a retail beginner?
Because when institutional algorithms are programmed to buy near VWAP and defend it as a level, that creates real buying pressure at that price. When price pulls back to VWAP during an uptrend, institutional buy orders often kick in — not because of magic, but because their algorithms are designed to accumulate shares at or near the day’s average price.
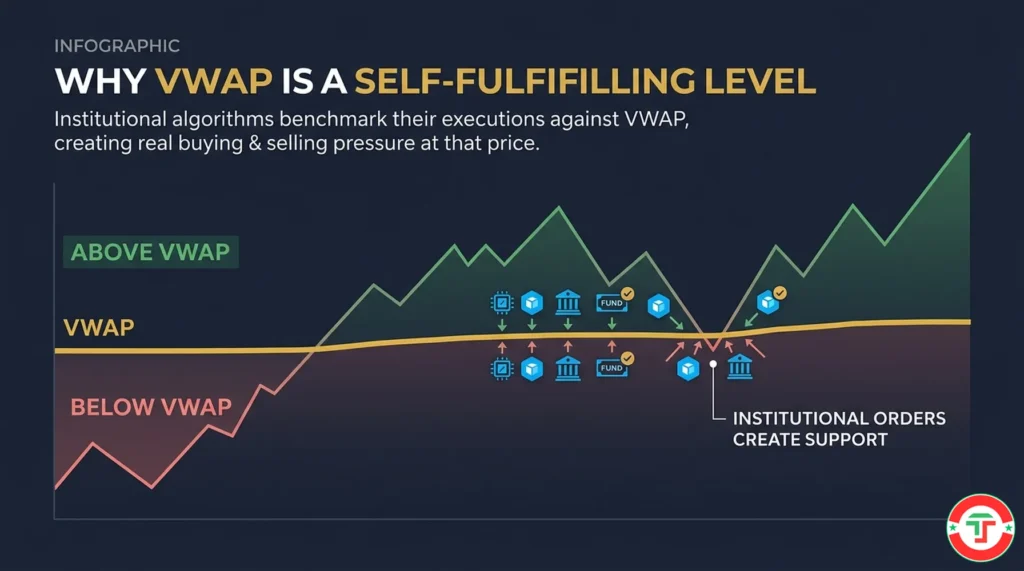
This makes VWAP a self-fulfilling level. Thousands of algorithms and professional traders are all watching the same line. When price approaches it, their actions create the very support or resistance that the indicator suggests.
It’s like a road that everyone agrees to drive on. It becomes the main road because everyone drives on it.
Understanding this institutional reality transforms VWAP from “just another indicator” into a window into what big money is actually doing. For a deeper look at how volume reveals buying and selling pressure behind the scenes, check our upcoming Volume Analysis guide.
How to Read VWAP on Your Chart
Reading VWAP is refreshingly simple. The indicator appears as a single line on your intraday chart — usually on a 1-minute or 5-minute timeframe. Here’s how to interpret it.
The Basic Rule: Above or Below
Price above VWAP = bullish bias. When the stock is trading above the day’s fair value, it means buyers are willing to pay more than the average price. Demand is outpacing supply. The bulls are in control.
Price below VWAP = bearish bias. When the stock is trading below fair value, sellers are dominating. Shares are changing hands below the average price, suggesting weakness.
This isn’t a rigid buy/sell signal — it’s a directional bias. If price is above VWAP, you’d generally look for long (buying) opportunities. If below, you’d lean toward shorts or staying out. Trading against the VWAP direction is fighting the session’s dominant flow.
VWAP as Dynamic Support and Resistance
VWAP doesn’t just tell you direction — it acts as a price level that the market reacts to.
In an uptrend, the stock often pulls back to VWAP and bounces off it, treating it as support. This happens because institutional algorithms (and savvy traders) view pullbacks to fair value as buying opportunities. They step in, their buying creates demand, and the stock resumes its upward move.
In a downtrend, the stock often rallies up to VWAP and gets rejected, treating it as resistance. Sellers (and algorithms with sell orders benchmarked to VWAP) step in at fair value and push the price back down.
This dynamic support/resistance quality is what makes VWAP so powerful for day traders. Unlike a static support level drawn from yesterday’s chart — which you learned about in our Support and Resistance guide — VWAP moves throughout the day, adapting to real-time trading activity.
The Slope Matters
Don’t just watch where price is relative to VWAP — watch where VWAP itself is going.
A rising VWAP confirms upward momentum. The average price is climbing because heavy volume is occurring at progressively higher prices.
A flat VWAP suggests a range-bound, choppy session. No clear directional conviction.
A declining VWAP confirms downward pressure. Heavy selling is dragging the average lower.
The slope tells you whether the session’s fair value is being established higher, lower, or nowhere — giving you context that a single glance at price alone can’t provide.
Three Ways Beginners Can Use VWAP Right Now
You don’t need advanced strategies to benefit from VWAP. Here are three beginner-friendly applications you can start using today.
1. The Intraday Trend Filter
This is the simplest and most powerful use of VWAP for beginners.
Before entering any trade, check: is price above or below VWAP?
If above — only look for long (buy) opportunities. Don’t short a stock that’s trading above its fair value unless you have very strong reasons.
If below — only look for short opportunities or stay in cash. Don’t buy a stock that the market is pricing below its average.
This one rule eliminates a surprising number of bad trades. It keeps you aligned with the session’s dominant flow instead of fighting it. Think of it as a traffic light: VWAP green (above) means go long, VWAP red (below) means look short or sit out.
2. The Pullback Reference Point
When a stock is in a strong intraday uptrend — trading well above VWAP — it won’t go straight up forever. It pulls back periodically. The question is: how far?
VWAP often acts as the “magnet” that pullbacks gravitate toward. Price stretches away from VWAP during momentum surges, then snaps back toward it as the momentum pauses.
For beginners, this means: if you missed the initial move and want to enter on a pullback, VWAP is a natural place to watch for a potential bounce. You’re not buying the high. You’re waiting for price to return to fair value and looking for signs that buyers are stepping back in.
A word of caution — this isn’t automatic. VWAP isn’t a guaranteed bounce point. It works best in trending conditions when the stock has clear directional momentum. In choppy markets, price can slice through VWAP repeatedly without respecting it.
3. The “Am I Getting a Good Price?” Check
After you enter a trade, VWAP helps you evaluate whether your fill was reasonable.
If you bought a stock at $50.20 and VWAP is at $50.50, you got in below fair value — that’s a favorable entry relative to the session’s activity. If you bought at $51.00 and VWAP is at $50.50, you paid a premium.
This doesn’t mean one trade is good and the other is bad — context matters. But VWAP gives you an objective reference point instead of guessing whether your entry was “good enough.” Over time, consistently entering near or below VWAP on long trades (and near or above VWAP on short trades) is a sign of improving execution quality. That’s exactly how institutions evaluate themselves.
How VWAP Behaves Throughout the Trading Day
Understanding VWAP’s behavior at different times of day is critical, and most beginner guides leave this out entirely.
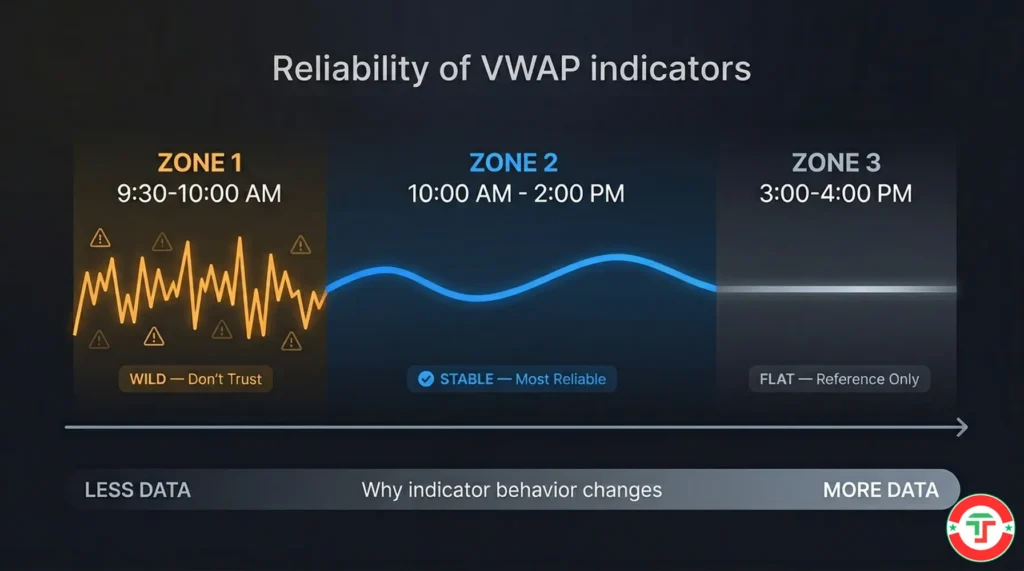
The First 15–30 Minutes: Wild and Unreliable
Right after the market opens, VWAP has very little data to work with. Every new trade has an outsized impact on the calculation. VWAP whips around rapidly, crossing price multiple times, and those early crosses are essentially meaningless noise.
Our team’s advice: don’t trust VWAP signals in the first 15–30 minutes. Let the indicator develop. Let volume accumulate. By about 10:00 AM ET, VWAP has enough data to become meaningful. Before that, it’s just finding its footing.
Mid-Morning to Early Afternoon: Stable and Useful
This is VWAP’s sweet spot. By now, enough volume has accumulated that the line moves gradually and reflects the session’s genuine consensus. Price interactions with VWAP during this period — bounces, rejections, breaks — are far more significant than anything that happened in the first few minutes. This is when VWAP as support/resistance and as a trend filter becomes truly reliable.
The Final Hour: Nearly Immovable
By 3:00 PM ET, VWAP has incorporated six hours of trading data. The line barely moves regardless of what price does. This stability makes VWAP less useful as a dynamic indicator in the final hour — it won’t adapt to sudden late-day moves. But it still serves as a valuable reference level. A stock closing well above VWAP suggests a strong day. A stock closing below VWAP suggests weakness, even if it rallied late.
This evolving behavior is a direct consequence of how VWAP is calculated — cumulative data means early candles have more influence per unit, while later candles are diluted. Understanding this prevents you from overreacting to meaningless early crosses or expecting VWAP to track price closely at the end of the day.
What VWAP Can’t Do: Honest Limitations Every Beginner Should Know
No indicator is perfect, and our team believes in being upfront about what tools can’t do — not just what they can.
VWAP is not predictive. It tells you where the session’s fair value has been established so far. It does not predict where price will go next. Using VWAP in isolation — “price is above VWAP, so it must keep going up” — will get you in trouble.
VWAP resets daily. Whatever VWAP told you yesterday is irrelevant today. If you’re holding a position overnight (which day traders shouldn’t be doing anyway), VWAP cannot help you manage it. It’s an intraday-only tool.
VWAP is a lagging indicator. Because it’s a cumulative average, VWAP always trails the current price. It responds to what has already happened, not what’s about to happen. This is true of all moving averages — and VWAP is fundamentally a moving average, just a volume-weighted one.
VWAP is unreliable in low-volume conditions. Remember, VWAP’s power comes from volume weighting. In a stock with thin volume — the kind we warned about in our Liquidity and Volume guide — the VWAP calculation is based on sparse data and becomes less meaningful. VWAP works best on liquid stocks with significant daily volume.
VWAP doesn’t work well in choppy, range-bound markets. When a stock is going nowhere — chopping sideways in a tight range — price will cross above and below VWAP repeatedly, generating false signal after false signal. In these conditions, VWAP is noise, not signal. It’s best used in trending sessions where the stock commits to one side of the line.
VWAP is one tool, not a trading system. Using VWAP alone without confirming context — chart patterns, volume confirmation, broader market conditions — is like navigating with a compass but no map. VWAP tells you where fair value is. It doesn’t tell you whether a trade is worth taking. Combine it with the other skills you’ve been building throughout this series.
How to Add VWAP to Your Charts
The practical part — getting VWAP on your screen — is almost anticlimactically simple.
VWAP is a built-in indicator on virtually every modern charting platform. Whether you’re using TradingView, thinkorswim, Webull, or any other platform, the process is nearly identical:
- Open an intraday chart (1-minute or 5-minute) for any stock
- Navigate to the indicator or study menu
- Search for “VWAP”
- Add it to your chart
That’s it. VWAP will appear as a single line overlaid on your price chart, automatically calculated from the market open. Most platforms also include optional standard deviation bands above and below VWAP — those can be useful later, but for now, focus on the VWAP line itself.
If your charting platform doesn’t offer VWAP, consider that a serious limitation. VWAP is standard equipment for day traders. We compare platforms with the essential features you need — including VWAP — in our Day Trading Toolkit.
One final setup tip: always use VWAP on intraday charts. Applying VWAP to a daily or weekly chart doesn’t make sense because VWAP resets every session. It’s designed for the 1-minute, 5-minute, or 15-minute charts you should already be using based on what you learned in our previous article on Chart Timeframes.
What’s Next in Your Day Trading Journey
You now understand VWAP — the one indicator that bridges the gap between what retail traders see and what institutional traders are actually doing. Next, we’re going deeper into the moving average family. You’ll learn the difference between the EMA and SMA, which settings day traders actually use, and how moving averages work alongside VWAP to give you a complete intraday trend-reading system.
→ Next Article: Moving Averages for Day Trading: EMA vs. SMA and How to Use Them
Frequently Asked Questions
What does VWAP stand for and what does it tell you?
Quick Answer: VWAP stands for Volume Weighted Average Price. It tells you the average price a stock has traded at throughout the day, with more weight given to prices where higher volume occurred.
Think of VWAP as the session’s “true average price” — not just any average, but one that accounts for where the real activity happened. A stock might touch $55 briefly on low volume, but if the bulk of its shares traded at $50, VWAP will reflect that $50 area as the fair value. This makes it more accurate than a simple average and gives traders an instant read on whether the current price is above or below the session’s consensus.
Key Takeaway: VWAP is the volume-weighted fair value for the trading day — a single line that tells you if the current price is relatively expensive or cheap.
Why is VWAP considered the most important day trading indicator?
Quick Answer: VWAP is the primary execution benchmark used by institutional traders, hedge funds, and algorithms — which means billions of dollars of orders revolve around it every single day.
When the biggest participants in the market are all measuring their performance against VWAP and programming their algorithms to buy or sell near it, the indicator becomes a self-fulfilling level. Institutional buying near VWAP creates real support. Institutional selling near VWAP creates real resistance. No other intraday indicator has this level of institutional adoption, which is why the price reactions around VWAP tend to be so consistent.
Key Takeaway: VWAP matters because the biggest players in the market make it matter. Following it aligns you with institutional flow rather than fighting it.
How is VWAP different from a moving average?
Quick Answer: VWAP weights prices by volume (giving more importance to high-activity prices) and resets daily, while moving averages treat all price periods equally and carry forward across multiple days.
A 20-period moving average on a 5-minute chart averages the last 100 minutes of closing prices — every candle counts the same regardless of volume. VWAP, by contrast, gives far more weight to candles where millions of shares traded versus candles where only a few thousand did. VWAP also starts fresh every morning, making it purely an intraday tool. We cover moving averages in full detail in our Moving Averages guide.
Key Takeaway: VWAP reflects where real money traded today. Moving averages reflect average price over time. They answer different questions and work best together.
What does it mean when a stock is above or below VWAP?
Quick Answer: A stock trading above VWAP suggests bullish intraday bias — buyers are willing to pay more than the session’s average. Below VWAP suggests bearish bias — selling pressure is dominant.
This doesn’t mean you should blindly buy every stock above VWAP or short every stock below it. But it gives you a directional filter. If you’re looking for long trades, stocks above VWAP are higher-probability candidates. Stocks below VWAP are better candidates for shorts. Trading against the VWAP direction means fighting the session’s dominant flow — something beginners should generally avoid.
Key Takeaway: Use VWAP as a bias filter. Above = lean bullish. Below = lean bearish. Don’t fight the session’s fair value.
Can VWAP be used for swing trading or investing?
Quick Answer: No. Standard VWAP resets at the start of each trading session, making it exclusively an intraday tool. It provides no useful information for multi-day positions.
Some advanced traders use a variation called “Anchored VWAP” that calculates from a specific date or event rather than resetting daily, and that can have multi-day applications. But the standard VWAP you’ll see on your charts is designed for day trading only. If you’re holding positions overnight, transition to other tools like moving averages or the daily chart levels you identified during pre-market analysis.
Key Takeaway: VWAP is for day trading. Period. Don’t apply it to swing trades or investment decisions.
Why shouldn’t I trust VWAP signals in the first 15 minutes of the market?
Quick Answer: VWAP has very little data in the first few minutes after the open, making it extremely volatile and unreliable — every single trade has an outsized impact on the calculation.
In the first 15 minutes, VWAP is still “finding itself.” Price will cross above and below VWAP multiple times, and those crosses mean almost nothing because the indicator hasn’t had time to accumulate enough volume to establish a meaningful average. By around 10:00 AM ET, VWAP has enough data to stabilize and become a reliable reference. Before that, treat any VWAP signal with heavy skepticism.
Key Takeaway: Give VWAP at least 15–30 minutes to develop before using it for trading decisions. Early-session crosses are noise, not signals.
Does VWAP work on all stocks?
Quick Answer: VWAP works best on liquid stocks with significant daily volume. On thinly traded, low-volume stocks, the VWAP calculation is based on sparse data and becomes unreliable.
Volume is the entire foundation of VWAP’s calculation. In a stock that trades millions of shares daily, VWAP reflects a true consensus of thousands of participants. In a stock that trades 50,000 shares a day, VWAP might be skewed by a handful of large orders. Stick to stocks with at least 500,000 in average daily volume for meaningful VWAP analysis — the same liquidity threshold we discussed in our Liquidity and Volume guide.
Key Takeaway: VWAP needs volume to be meaningful. On low-volume stocks, the indicator is unreliable.
What are VWAP bands?
Quick Answer: VWAP bands are standard deviation lines plotted above and below the main VWAP line, creating a channel that shows how far price has deviated from fair value.
Most platforms let you display 1, 2, or 3 standard deviation bands around VWAP. The further price moves from the center VWAP line toward the outer bands, the more “extended” or “stretched” it is relative to fair value. Some experienced traders use the outer bands for mean-reversion trades — betting that extreme deviations will snap back toward VWAP. For beginners, focus on the main VWAP line first. The bands add complexity you don’t need yet.
Key Takeaway: VWAP bands show how far price has stretched from fair value. Learn the main VWAP line first, then explore bands as you advance.
Can I use VWAP as the only indicator on my chart?
Quick Answer: VWAP is powerful, but using it alone without context from other tools — chart patterns, volume, support/resistance levels, broader market conditions — leads to incomplete analysis and poor trades.
VWAP tells you one thing exceptionally well: where fair value is for the session. But it doesn’t tell you whether a breakout is real, whether the broader market supports the move, or whether the stock has fundamental catalysts. The best traders use VWAP as one layer in a multi-tool approach. Combine it with the candlestick reading, support/resistance, and volume analysis you’ve been building throughout this series for the most complete picture.
Key Takeaway: VWAP is your strongest single indicator — but it’s still just one tool. Combine it with everything else you’ve learned for the best results.
Where can I find VWAP on my charting platform?
Quick Answer: VWAP is a built-in indicator on virtually every modern charting platform. Search for “VWAP” in your platform’s indicators menu and add it to any intraday chart.
Platforms like TradingView, thinkorswim (Charles Schwab), Webull, and most broker-provided charting tools include VWAP as a standard study. Add it to your 5-minute chart and it will automatically calculate from the market open. If your platform doesn’t offer VWAP, that’s a significant limitation — consider switching to a platform that includes it. We compare the essential features day traders need in our Day Trading Toolkit.
Key Takeaway: VWAP should be on every day trader’s chart. If your platform doesn’t have it, find one that does.
Disclaimer
The information provided in this article is for educational purposes only and should not be considered financial advice. Day trading involves substantial risk and is not suitable for every investor. Past performance is not indicative of future results.
For our complete disclaimer, please visit: https://daytradingtoolkit.com/disclaimer/
Article Sources
Our team builds every article on a foundation of verified, authoritative research. Here are the primary sources we referenced and recommend for further reading on VWAP.
- Investopedia: Volume Weighted Average Price (VWAP) — The standard reference for financial definitions, providing a clear explanation of VWAP calculation, interpretation, and use cases for both institutional and retail traders.
- Charles Schwab: How to Use Volume-Weighted Indicators in Trading — Schwab’s educational guide explains VWAP’s role as both a benchmark and a guidepost, with practical charting examples showing how institutional and retail traders use VWAP differently.
- Corporate Finance Institute: Volume Weighted Average Price (VWAP) — CFI provides a thorough breakdown of the VWAP formula, its relationship to institutional execution quality, and why it differs from standard moving average calculations.
- TrendSpider Learning Center: VWAP Indicator Guide — TrendSpider’s education hub covers VWAP’s history (developed by Kyle Krehbiel in the 1980s), calculation methodology, and practical applications including Anchored VWAP.
- CMC Markets: What is VWAP in Trading — CMC’s guide covers VWAP-based trading strategies including bounce, breakout, and deviation band approaches, along with common mistakes traders make when implementing VWAP.
- StockCharts ChartSchool: VWAP — StockCharts’ free technical analysis education resource provides clear visual examples of VWAP as intraday support/resistance and its relationship to volume.


