
Ever click “buy” on a stock and get a price that’s nothing like what you expected? Or worse — tried to sell a position and watched the price slide against you before your order even filled?
That sinking feeling usually comes down to two things most beginners ignore until it costs them money: liquidity and volume.
These aren’t flashy concepts. Nobody’s posting about them on social media. But here’s the truth our team has learned after years of placing thousands of trades — liquidity and volume determine whether your trading experience feels like driving on a six-lane highway or trying to make a U-turn on a dirt road. One is smooth, predictable, and safe. The other? You’re going to get stuck, and it’s going to cost you.
If you’ve been following our Beginner’s Guide series, you’ve already learned how to read candlestick charts, identify support and resistance levels, recognize basic chart patterns, and use simple indicators. Now we’re adding something even more fundamental to your toolkit — the ability to tell whether a stock is actually tradeable before you put real money on the line.
This is one of those topics that separates traders who survive from traders who blow up wondering what went wrong.
What Is Liquidity in Day Trading?
Liquidity — in the simplest terms possible — measures how easily you can buy or sell something without moving its price against you.
Think of it like selling your car. If you own a popular Honda Civic, you can list it and have buyers calling within hours. That’s high liquidity — lots of interested buyers, competitive prices, fast transactions. But if you own a rare vintage tractor with a cracked engine block? Good luck. You might wait months for a buyer, and when they finally show up, they’re going to lowball you. That’s low liquidity.
In day trading, liquidity works the same way. A highly liquid stock has plenty of buyers and sellers competing at prices very close to each other. You can jump in and out quickly, and the price barely flinches when you do. A stock with low liquidity? Fewer participants, bigger gaps between prices, and your order alone can shove the price around — usually in the wrong direction.

The Three Signs of Liquidity
You can’t see “liquidity” as a single number on your chart. Instead, you read it through three observable signals:
1. The Bid-Ask Spread
The bid is the highest price a buyer is willing to pay right now. The ask (also called the “offer”) is the lowest price a seller is willing to accept. The gap between them is the spread.
A tight spread — say, $50.10 bid / $50.11 ask — tells you the stock is liquid. Buyers and sellers are fighting over pennies because there’s so much competition. A wide spread — like $50.10 bid / $50.50 ask — screams low liquidity. That 40-cent gap is essentially a tax you pay just to enter the trade. We go much deeper into how the spread quietly eats your profits in our Bid-Ask Spread guide, but for now, remember: tight spread = liquid, wide spread = illiquid.
2. Market Depth
Market depth refers to how many shares are sitting at each price level, waiting to be bought or sold. A liquid stock might have 50,000 shares at the bid and 50,000 at the ask — a thick wall of orders. An illiquid stock might have 200 shares at the bid and 300 at the ask. One reasonably sized order will blow right through those thin levels and fill you at a price you didn’t expect. You can see this in real time on what’s called the Level 2 order book — something we cover in detail in our Level 2 Quotes and Time & Sales guide.
3. Execution Speed and Slippage
In a liquid stock, your order fills almost instantly — usually at (or very close to) the price you saw when you clicked the button. In an illiquid stock, you get slippage: the price slips away from you between the moment you submit the order and the moment it actually fills. Slippage is the silent killer of trading accounts, and it gets dramatically worse when liquidity dries up. We’ll unpack this in much more detail in our Understanding Slippage guide later in the series.
Here’s what matters right now: liquidity is about the quality of your fills. High liquidity means clean entries and exits. Low liquidity means messy, expensive ones.
What Is Trading Volume and How Is It Measured?
Trading volume is simpler to understand than liquidity. Volume is just the total number of shares (or contracts) that change hands during a specific time period.
If 5 million shares of Apple (AAPL) are bought and sold in a single trading day, AAPL’s daily volume is 5 million. That’s it. Every time a buyer and a seller agree on a price and shares change hands, that transaction gets added to the volume count.
On most trading platforms and charting software, you’ll see volume displayed as vertical bars at the bottom of a price chart. Each bar represents the total volume for that specific time period — whether that’s one minute, five minutes, one hour, or one full day.
Key Volume Metrics Day Traders Watch
Average Daily Volume (ADV)
A single day’s volume can be misleading. Maybe a stock usually trades 500,000 shares but spiked to 5 million today because of a news event. That’s why traders look at the average daily volume — typically calculated over a 20, 50, or 90-day period. ADV tells you what’s normal for that stock.
As a rough benchmark, many day traders prefer stocks with an average daily volume of at least 500,000 to 1 million shares. Below that, and you start running into liquidity problems that make clean entries and exits difficult — especially if you’re trading more than a handful of shares.
Relative Volume (RVOL)
This is where volume gets really interesting for day traders. Relative volume compares a stock’s current volume to its average volume at the same time of day. An RVOL of 2.0 means the stock is trading at twice its normal pace. An RVOL of 5.0? Five times normal — something significant is happening. RVOL is one of the most important filters in any stock scanner, and we dedicate an entire article to it: Understanding Relative Volume.
Dollar Volume
Here’s something that trips up beginners. A stock trading 10 million shares at $2 per share moves $20 million worth of stock. A different stock trading 500,000 shares at $200 per share moves $100 million. The second stock has lower share volume but much higher dollar volume — and for your purposes as a trader, it’s the more liquid one. Dollar volume — price multiplied by shares traded — gives you a more accurate picture of how much real money is flowing through a stock.
How Volume Gets Counted
One thing worth understanding: volume counts every transaction. If 500 shares trade from Seller A to Buyer B, that’s 500 in volume. If Buyer B then sells those same 500 shares to Buyer C five minutes later, the count goes to 1,000. The same shares can be counted multiple times in a single day. This isn’t a flaw — it’s actually useful because it tells you how actively the stock is being traded, regardless of how many unique shares exist.
Volume data for stocks traded on major U.S. exchanges is highly reliable because all transactions are reported through a centralized system. This is one of the advantages of trading stocks over, say, forex — where there’s no central exchange and “volume” numbers vary from broker to broker.
How Are Liquidity and Volume Connected?
This is where most beginner content drops the ball. They treat liquidity and volume as interchangeable. They’re not — but they’re deeply related.
Volume is one of the biggest drivers of liquidity, but it isn’t the same thing.
Think of it this way. If our highway metaphor holds up: volume is the traffic count — how many cars pass through per hour. Liquidity is the road quality — how smoothly those cars can travel without gridlock, potholes, or pile-ups. Heavy traffic on a well-built eight-lane highway? That’s high volume AND high liquidity. Heavy traffic on a two-lane country road? That’s high volume but low liquidity — things are going to get ugly fast.
In practical terms:
- High volume usually means high liquidity. More participants means more competition, tighter spreads, and deeper order books. This is why mega-cap stocks like Apple, Microsoft, and Nvidia — which regularly trade tens of millions of shares per day — have some of the tightest spreads in the market.
- But high volume doesn’t guarantee good liquidity. During a panic sell-off or a breaking news event, volume can spike through the roof while liquidity actually evaporates. Everyone’s trying to sell, nobody wants to buy, and even though volume is massive, the lack of buyers on the other side means your fill is going to be terrible. We saw this play out during major market events — volume surges while spreads blow wide open.
- Low volume almost always means low liquidity. If only a few hundred shares are trading per hour, there simply aren’t enough participants to absorb your order without moving the price. This is why thinly traded penny stocks and micro-caps are minefields for beginners.
The key takeaway? Check both. A stock with healthy average volume and tight bid-ask spreads is giving you the green light. A stock with high volume but a widening spread is waving a yellow flag. A stock with low volume and a wide spread is a red flag — no matter how exciting the chart pattern looks.
Why Liquidity and Volume Matter for Your Trades
Alright — you understand the definitions. But what does this actually mean for your money? Let’s get specific.
1. They Determine the Real Cost of Every Trade
Most beginners think their only trading cost is the commission. But if your broker charges zero commission — which many do now — you might think trading is “free.” It’s not.
The spread is a cost. Slippage is a cost. And both get worse as liquidity and volume drop.
Imagine you’re buying 1,000 shares. In a liquid stock with a $0.01 spread, your “hidden cost” is roughly $10 ($0.01 × 1,000 shares). In an illiquid stock with a $0.25 spread, that same trade costs you $250 in spread alone — before you even consider slippage on top of that. You haven’t made a penny yet, and you’re already $250 in the hole.
Now multiply that by 5 trades a day, 5 days a week. For a deeper breakdown of how these hidden costs compound, see our guide on The Cost of Every Trade.
2. They Affect Whether Your Strategy Actually Works
Some trading strategies require fast, precise entries and exits. Scalping — where you’re targeting small, quick moves — is essentially impossible in illiquid stocks because the spread alone eats your entire profit. Breakout trading depends on volume surges to confirm that a move is real and not a fakeout.
Here’s the point: your strategy doesn’t exist in a vacuum. It only works if the stocks you apply it to have sufficient liquidity and volume to support the execution your strategy demands. A brilliant plan executed in the wrong stock is still a losing trade.
3. They Determine How Easily You Can Get Out
Getting into a trade is easy. Getting out — especially when things go wrong — is where liquidity saves you.
Picture this: you buy a stock, it drops, and you need to sell immediately to honor your stop-loss. In a liquid stock, your stop order fills within a penny or two of your target. You take a small, controlled loss — exactly what risk management is designed for. In an illiquid stock? Your stop order triggers, but there aren’t enough buyers nearby. Your sell order “eats through” multiple price levels before it finds enough buyers to fill. Instead of a $50 loss, you’re staring at $150 or more.
This is why our team always says: the time to check liquidity is before you enter, not while you’re trying to escape.
4. They’re Your Early Warning System
Volume doesn’t just help with execution — it tells you what the market believes. A stock breaking above resistance on volume three times its daily average? That breakout has conviction behind it. A stock breaking above the same level on half its normal volume? That’s a whisper, not a shout — and it’s far more likely to fail and reverse.
Volume is the market’s body language. Price tells you what happened. Volume tells you how much the market cared. We explore this concept much deeper in our dedicated Volume Analysis guide.
The Intraday Volume Pattern Every Day Trader Should Know
Here’s something most beginner guides skip entirely, and it’s critical for anyone planning to day trade.
Trading volume is not evenly distributed throughout the day. It follows a well-documented pattern that looks roughly like a U-shape — sometimes called the “smile” pattern.
The First 30–60 Minutes (9:30–10:30 AM ET): Volume explodes at the market open. Overnight news, pre-market moves, and institutional orders from the previous close all pile in at once. This is typically the highest-volume period of the day and — not coincidentally — the most volatile. Spreads are generally tight because participation is massive, but price moves are fast and can be unpredictable.
The Midday Lull (11:00 AM–2:00 PM ET): Volume drops off a cliff. Many professional traders step away. Algorithms dominate. Spreads can widen slightly on less active stocks. Price action often gets choppy, range-bound, and frustrating. This is the period that chops up beginners who don’t realize the market has shifted gears.
The Final Hour (3:00–4:00 PM ET): Volume picks back up significantly as the “Power Hour” kicks in. Institutional traders rebalance positions, mutual funds execute end-of-day orders, and day traders close out positions before the bell. Liquidity improves, and meaningful moves can happen — especially in the last 15–30 minutes.
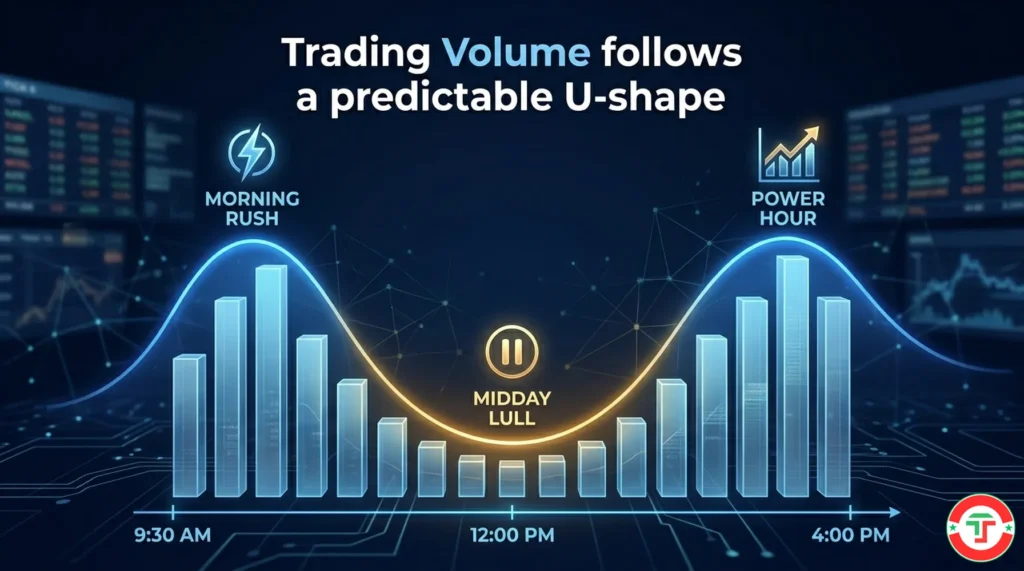
Why does this matter? Because the same stock can have great liquidity at 9:45 AM and terrible liquidity at 12:30 PM. A $0.01 spread at the open might widen to $0.05 or more during the lull. A strategy that works beautifully in the morning session might fail miserably at noon — not because the strategy is broken, but because the volume environment changed.
Our team’s advice for beginners: focus your trading on the first 90 minutes of the session, when volume and liquidity are at their peak. As you gain experience, you can learn to navigate the midday and closing sessions. But early on, trade when the road is widest.
How to Check a Stock’s Liquidity and Volume Before You Trade
Now for the practical part. Before you enter any trade — literally every single one — you should run through a quick liquidity and volume check. It takes 30 seconds and can save you hundreds of dollars.
The Pre-Trade Liquidity Checklist
Step 1: Check Average Daily Volume
Pull up the stock’s average daily volume on your charting platform or financial website. Look for at least 500,000 shares per day as a minimum baseline. Many experienced day traders prefer 1 million+ shares. If you’re seeing average volume below 200,000 shares, treat that as a serious warning — this stock may not have enough participation to support clean day trading.
Step 2: Check Today’s Volume (and RVOL)
Is today’s volume tracking above, below, or at the average? If it’s significantly below average, the stock might be unusually quiet — meaning wider spreads and slower fills. If it’s significantly above average (high RVOL), something is driving interest. That can be an opportunity, but it also means volatility is likely elevated.
Step 3: Look at the Bid-Ask Spread
Before clicking anything, check the current spread. On large-cap stocks, you’ll often see 1-cent spreads. On mid-caps, maybe 2–5 cents. If you’re seeing spreads of 10 cents or more on a sub-$50 stock, that’s a liquidity concern. The wider the spread, the more it costs you to enter and exit.
Step 4: Consider Your Position Size Relative to Volume
This one’s subtle but important. If a stock trades 200,000 shares per day and you’re trading 100 shares, you’re fine — your order is a drop in the ocean. But if you’re trading 5,000 shares, you represent 2.5% of the entire day’s volume. Your order can visibly impact the price. As a general rule, your order size should be a tiny fraction of the stock’s average volume — especially for thinly traded names.
Step 5: Check the Time of Day
Remember the U-shaped volume pattern. If it’s 12:15 PM and the stock’s volume has dried up, the liquidity you saw at 9:45 AM may not be there anymore. Adjust your expectations — or wait for volume to return.
A good stock scanner can automate most of this screening for you. Tools like Trade Ideas let you filter by minimum volume, relative volume, spread size, and more — so you’re only looking at stocks that pass the liquidity test before you even consider a chart pattern. For a full breakdown of the best screening and scanning tools, check out our Day Trading Toolkit.
The Danger Zone: Why Low-Volume Stocks Can Destroy Beginners
We need to be direct about this, because it’s one of the most common ways new traders get hurt.
Low-volume stocks — we’re talking about thinly traded small-caps, micro-caps, and penny stocks — look tempting to beginners because of their wild price swings. A stock that moves 20% in a day seems like an easy opportunity compared to Apple moving 1.5%. But that volatility isn’t opportunity — it’s a trap dressed up as one.

Why the Danger Is Real
You can’t get out. This is the biggest risk, period. In a low-volume stock, you might enter a position easily on a rare burst of buying interest. But when the move reverses — and it often does, violently — there’s nobody on the other side to buy your shares. Your sell order sits there while the price plummets past it. The stop-loss you set? It fills $0.50 or $1.00 below where you placed it because there simply weren’t enough buyers between those price levels.
Wide spreads guarantee losses. If a $3 stock has a spread of $3.00 bid / $3.15 ask, you’re paying 5% just to enter the trade. The stock needs to move 5% in your direction just to break even. In a liquid stock with a $0.01 spread, that breakeven cost is negligible.
Price manipulation is easier. Low-volume stocks are playgrounds for pump-and-dump schemes and manipulation. A single well-funded trader or group can artificially inflate prices, attract inexperienced buyers, and then sell into the frenzy. The low volume means a small amount of money can move the price dramatically. When the manipulators exit, the stock collapses — and anyone left holding shares is stuck.
Your strategy doesn’t apply. Chart patterns, indicators, support and resistance — these tools are based on the behavior of large groups of market participants. When a stock only has a handful of people trading it, the “crowd psychology” that makes technical analysis work simply isn’t present. That beautiful bullish flag on a 10,000-share-per-day stock? It’s meaningless noise.
Our team’s stance: until you have significant experience, stick to stocks with at least 500,000 shares of average daily volume and spreads under $0.05. The “boring” liquid stocks will teach you how to trade. The exciting illiquid ones will teach you how to lose money.
Volume as a Confirmation Tool: Reading the Market’s Conviction
Beyond execution quality, volume gives you insight into whether a price move is real or likely to fizzle.
Think of price as the direction of movement and volume as the fuel in the tank. A car can coast uphill for a while on momentum, but without fuel, it’s coming back down. Price works the same way.
Volume Confirms Breakouts
When a stock breaks above a resistance level — a price ceiling it’s been bumping against — volume tells you whether to trust the move. If the breakout happens on volume significantly above average, it means a lot of participants are voting with real money that this level should give way. That’s conviction.
If the breakout happens on average or below-average volume, it’s a red flag. Not enough fuel behind the move. These low-volume breakouts have a much higher failure rate — the price pokes above resistance, a few people chase it, and then it falls right back into the range. Traders call this a “fakeout,” and volume is your best early defense against getting caught in one.
Volume Confirms Trends
In a healthy uptrend, you want to see volume increase on the up-moves and decrease on the pullbacks. This pattern tells you that buyers are aggressive (high volume pushing price up) while sellers are passive (low volume during dips means nobody’s panic-selling). The reverse applies for downtrends.
When this pattern breaks — when a stock makes a new high but volume is shrinking — that’s a divergence. It doesn’t mean the trend reverses immediately, but it’s a warning sign that enthusiasm is fading and the trend may be running on fumes.
Volume Signals Capitulation
Sometimes the most important volume signal happens at the end of a move, not the beginning. After a stock has been falling hard, a sudden massive spike in volume — accompanied by a dramatic sell-off — can indicate capitulation: the point where the last of the fearful holders have finally thrown in the towel and dumped their shares. This is often where the selling pressure exhausts itself and a reversal begins.
These concepts become more powerful as you develop your chart-reading skills. For now, the beginner-level takeaway is this: always check volume alongside price. A price move without volume support is like a promise without follow-through — don’t trust it blindly.
What’s Next in Your Day Trading Journey
Now that you understand why liquidity and volume are the foundation of every trade you’ll ever make, the next step is zooming in on when to look at what’s happening. Different chart timeframes show you different perspectives on the same stock — and knowing which timeframes matter for day trading (versus swing trading or investing) will sharpen your analysis dramatically.
→ Next Article: Understanding Chart Timeframes: Which Ones Matter for Day Trading
Frequently Asked Questions
What is liquidity in day trading in simple terms?
Quick Answer: Liquidity is how easily and quickly you can buy or sell a stock without significantly affecting its price.
Think of it like the difference between selling concert tickets for a popular artist versus tickets to a show nobody’s heard of. If there are tons of interested buyers, you can sell fast at a fair price. If nobody’s interested, you either wait forever or accept a much lower price. For day traders, high liquidity means faster fills, tighter spreads, and lower transaction costs. Low liquidity means the opposite — and that translates directly into money lost.
Key Takeaway: High liquidity = smooth, cheap trades. Low liquidity = expensive, messy trades. Always check before you enter.
What is a good trading volume for day trading?
Quick Answer: Most day traders look for stocks with at least 500,000 to 1 million shares of average daily volume as a minimum baseline.
The “right” volume depends on your strategy and position size. Scalpers who need razor-thin spreads and instant fills typically trade stocks with millions of shares in daily volume — think large-cap names like AAPL, AMD, or TSLA. Momentum traders might work with slightly lower volume stocks if relative volume is spiking on a catalyst. The key rule: your order should be a tiny fraction of the stock’s daily volume so it doesn’t move the price against you.
Key Takeaway: Start with stocks above 500K average daily volume and adjust as you learn what your strategy requires.
What is the difference between liquidity and volume?
Quick Answer: Volume measures how many shares trade in a period. Liquidity measures how easily those shares can be traded without impacting the price. They’re related but not the same.
High volume usually creates high liquidity because more participants means more competition and tighter prices. But volume alone doesn’t guarantee liquidity. During fast-moving news events, volume can skyrocket while liquidity actually drops — everyone’s trying to trade, but there aren’t enough buyers or sellers at stable prices. Think of volume as traffic count and liquidity as road quality — both need to be good for a smooth ride.
Key Takeaway: Always check both volume AND the bid-ask spread. High volume with a tight spread = you’re in good shape.
Why do day traders avoid low-volume stocks?
Quick Answer: Low-volume stocks have wide spreads, poor fills, higher slippage, and are more susceptible to price manipulation — all of which increase your risk and costs.
When a stock trades very few shares per day, your order becomes a significant percentage of that volume. This means you can move the price against yourself just by entering or exiting. Your stop-loss orders can fill far from your target because there aren’t enough buyers between price levels. On top of that, low-volume stocks attract manipulation schemes because it takes less money to artificially inflate or crash the price.
Key Takeaway: Until you have significant experience, stick to stocks above 500,000 average daily volume. The excitement of volatile penny stocks isn’t worth the execution nightmare.
What is average daily volume (ADV)?
Quick Answer: Average daily volume is the average number of shares traded per day over a specific period — usually 20, 50, or 90 trading days.
ADV smooths out the day-to-day fluctuations and gives you a reliable baseline of a stock’s “normal” activity level. A single day’s volume can be wildly misleading — a news event or earnings release can spike volume 10x and then it drops back to normal the next day. ADV tells you what to actually expect on a typical day, which helps you assess whether the stock has enough ongoing participation to support your trading.
Key Takeaway: Use ADV — not a single day’s volume — to assess whether a stock is liquid enough for day trading.
How does volume change throughout the trading day?
Quick Answer: Volume follows a U-shaped pattern — highest in the first 30–60 minutes after the open, lowest during the midday hours, and rising again in the final hour before the close.
The morning spike happens because overnight news, pre-market orders, and institutional activity all converge at the 9:30 AM ET open. By late morning, many professional traders step back, algorithms dominate, and volume thins out. The final hour — often called “Power Hour” — sees volume increase again as institutional traders rebalance, day traders close positions, and mutual funds execute end-of-day orders.
Key Takeaway: Beginners should focus on trading during the first 60–90 minutes when volume and liquidity are strongest. Avoid the midday lull until you’re more experienced.
What is relative volume (RVOL) and why does it matter?
Quick Answer: Relative volume compares a stock’s current trading volume to its historical average at the same time of day, expressed as a multiple (e.g., RVOL of 3.0 means 3× normal volume).
RVOL is one of the most powerful filters day traders use because it highlights unusual activity in real time. A stock with normal volume isn’t doing anything special. A stock with 3× to 5× its normal volume is telling you that something — a news catalyst, an earnings surprise, a sector move — is driving unusual interest. That unusual interest often translates to bigger, more sustained price moves. We cover RVOL strategies in depth in our Relative Volume guide.
Key Takeaway: RVOL helps you find the stocks that are “in play” today — not yesterday, not last week, but right now.
Can a stock have high volume but still be hard to trade?
Quick Answer: Yes. During extreme events like flash crashes, circuit breaker halts, or major news shocks, volume can surge while actual tradeable liquidity dries up — meaning wide spreads and severe slippage.
This happens because while lots of people want to trade, they’re mostly on the same side. If everyone’s selling, there aren’t enough buyers to absorb the volume at stable prices. The order book thins out, spreads widen, and fills become unpredictable. These are the moments when the distinction between volume and liquidity becomes painfully clear. High volume without balanced participation on both sides doesn’t help you.
Key Takeaway: Volume alone isn’t enough — you also need balanced buying and selling interest for true liquidity.
How does low liquidity affect my stop-loss order?
Quick Answer: In low-liquidity stocks, stop-loss orders often fill significantly below your target price because there aren’t enough buyers between price levels to absorb your sell order.
This is called slippage on a stop-loss, and it’s one of the most costly surprises for beginners. You set a stop at $10.00, the stock drops, your stop triggers — but the next available buyer is at $9.50. Your “controlled $100 loss” just became a $600 loss. In liquid stocks, this rarely happens because there are buyers at nearly every penny increment. In illiquid stocks, there are wide gaps in the order book, and your order falls through them.
Key Takeaway: Risk management only works as planned when liquidity is sufficient. Check liquidity before entering — not after your stop-loss fails. For more on proper stop-loss techniques, see our guide on What is a Stop-Loss Order.
What tools can I use to check a stock’s volume and liquidity?
Quick Answer: Most charting platforms display volume bars by default, and financial sites like Yahoo Finance show average daily volume. For real-time liquidity assessment, check the bid-ask spread and Level 2 data on your broker’s platform.
Start simple: check average daily volume on any free financial website before you even pull up a chart. Then look at today’s volume bars on your charting platform to see how activity is tracking. For a more advanced view, your broker’s trading platform will show you the current bid-ask spread and, on most platforms, Level 2 quotes that reveal how deep the order book is at each price level. Stock scanners like Trade Ideas can automate this entirely — filtering out low-volume stocks so you only see tradeable opportunities. For a complete list of our team’s recommended tools, visit our Day Trading Toolkit.
Key Takeaway: Use average daily volume as your first filter, the bid-ask spread as your second, and scanner tools to automate the screening process.
Disclaimer
The information provided in this article is for educational purposes only and should not be considered financial advice. Day trading involves substantial risk and is not suitable for every investor. Past performance is not indicative of future results.
For our complete disclaimer, please visit: https://daytradingtoolkit.com/disclaimer/
Article Sources
Our team builds every article on a foundation of verified, authoritative research. Here are the primary sources we referenced and recommend for further reading on liquidity and volume concepts.
- SEC Investor Education: Extended-Hours Trading — The SEC’s Office of Investor Education defines liquidity as the existence of willing buyers and sellers, and the degree of price competition among them. Their bulletins provide clear, regulator-backed definitions.
- Charles Schwab: Trading Volume as a Market Indicator — Schwab’s educational resource explains how above-average volume can confirm or refute price trends, with practical charting examples for retail traders.
- Corporate Finance Institute: Average Daily Trading Volume (ADTV) — CFI provides a clear explanation of how ADTV is calculated and why it matters for assessing stock liquidity and identifying potential support and resistance levels.
- Fidelity: Why to Consider Stock Volume — Fidelity’s active investor guide discusses volume’s role in confirming technical patterns including breakouts, head-and-shoulders formations, and on-balance volume indicators.
- Investopedia: Liquidity — The standard reference for financial definitions, explaining market liquidity, accounting liquidity, and how each affects traders and investors differently.
- NYSE Market Data — NYSE’s equity volume data provides real reporting on daily trading volumes across U.S. exchanges, giving context to how massive U.S. equity market participation really is.


