
Let’s start with a story—because honestly, that’s the only way this review makes sense.
One of our traders—we’ll call him Mike (not his real name, but close enough)—opened his first serious trading account with $50,000. He’d done his homework, read the books, watched the YouTube gurus. He had a decent charting platform, some basic scanners, and what he thought was a solid plan.
Three months later? Down $8,400.
Not because he was reckless. Not because he was throwing money at meme stocks. He was actually following pretty standard day trading setups—momentum plays, breakout patterns, gap-and-go strategies. The problem was simpler, and more brutal: he was bringing a knife to a gunfight. While he was manually scanning through stocks at market open, algorithms were already identifying and executing trades in milliseconds.
Here’s where the story gets interesting.
Mike switched to Trade Ideas, and—look, we’re not going to sell you some miracle transformation story. It took months. He struggled with the learning curve. He overtruded the AI signals. He lost money while figuring things out. But over the next two years? He executed over $180,000 in volume with a 71% win rate, averaging $850 per trade.

The difference wasn’t magic. It was infrastructure.
This review is basically Mike’s journey with the platform, combined with insights from our entire team. We’re going to break down what Trade Ideas actually is, what it really costs (spoiler: more than the website tells you), whether Holly AI lives up to the hype, and—most importantly—whether this thing is worth it for your situation.
And we’re going to be brutally honest, because we’ve got no reason not to be.
📖 Complete Review Notice
You’re reading our most comprehensive Trade Ideas review, with every feature, pricing breakdown, and hands-on insight. ⏱ Estimated reading time: 90+ minutes
⚡ In a hurry? Skip the full deep dive and jump straight to our Quick Summary & Verdict — all key points in under 10 minutes.
Table of Contents
What Exactly IS Trade Ideas? (And Why Mike Initially Thought It Was Overkill)
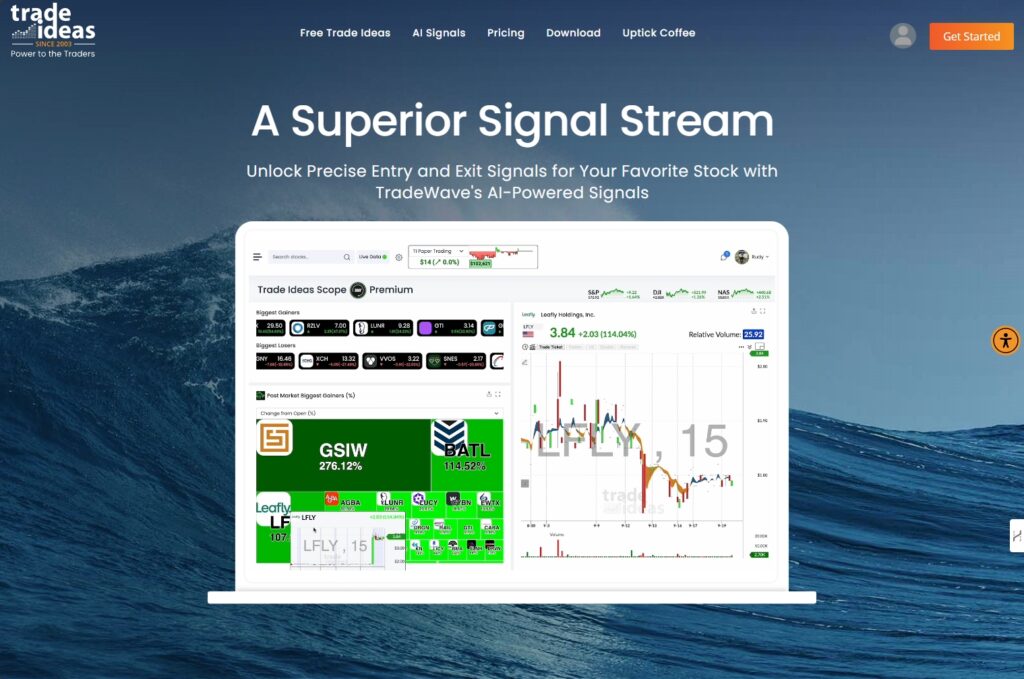
Trade Ideas isn’t your typical stock screener or chart platform. Founded in 2003, this Windows-based software represents 22 years of spHere’s what Mike thought Trade Ideas was when he first heard about it: “Oh, another stock screener. Got it.”
Yeah… no.
Trade Ideas isn’t a stock screener in the traditional sense. It’s more like hiring a quantitative analyst who works 24/7, never gets tired, never gets emotional, and processes data faster than any human ever could.

Founded back in 2003—which honestly matters more than you’d think—this Windows-based platform has spent 22 years doing exactly one thing: using AI to analyze US equity markets. Not forex. Not crypto. Not international stocks. Just US equities, with an obsessive focus that actually shows in the results.
Here’s How Mike Describes It Now
“While I’m sleeping, Trade Ideas is processing millions of data points across 8,000+ stocks. It’s running simulations, testing strategies, calculating probabilities. By the time I wake up, it’s already identified the highest-probability setups for the day. It’s like having a team of quantitative analysts working overnight, except they never ask for raises.”

The platform operates on three core principles that Mike didn’t fully appreciate until he’d been using it for about six months:
- AI-Driven Intelligence: Replace gut feelings with actual statistics (this was hard for Mike—he liked trusting his gut)
- Real-Time Processing: Identify opportunities microseconds after they develop (turns out milliseconds matter)
- Integrated Workflow: Everything from scanning to execution in one place (fewer platforms = fewer excuses)
The Longevity Thing (Which Actually Matters)
Look, we’ve seen a lot of trading platforms come and go. Big launches, flashy marketing, then… crickets when the market gets choppy.
Trade Ideas has been around for 22 years. They survived:
- The dot-com crash
- The 2008 financial crisis
- COVID madness in 2020
- Whatever you want to call what’s happening now
This isn’t sexy, but it matters when you’re building your entire trading workflow around a platform. Mike learned this lesson after a different platform he was using just… shut down one day. Gone. All his custom setups, vanished.
That doesn’t happen with Trade Ideas. They’re not going anywhere.
Trade Ideas Pricing 2025: The Real Numbers (Because Hidden Costs Are Annoying)
LeAlright, let’s talk money. And not just the numbers on the pricing page—the actual, total cost Mike paid over three years.
Because here’s the thing: when Mike first looked at Trade Ideas, he saw “$89/month” and thought, “Okay, that’s manageable.” Then reality happened.
The Free Plan (Par): Where Mike Started
Cost: $0/month
What you actually get: Delayed data (15-20 minutes behind), basic visualization, access to the trading room with—you guessed it—delayed data.
Mike spent exactly two weeks on this plan before upgrading.
His review? “It’s like watching a basketball game on a 15-minute delay and trying to place bets. Technically possible, completely useless.”
Who should use it: People who want to see if the interface makes sense before committing money. That’s it.
The Standard Plan (Birdie Bundle): Where Mike Spent His First Four Months
Monthly billing: $127/month ($1,524 annually)
AnnMonthly: $127/month
Annual: $89/month ($1,068 total)
Annual savings: $456 (which sounds great until you realize you just committed $1,068)
What you get:
- Real-time market data (finally)
- 10 simultaneous charts
- 500+ scanning filters with Formula Editor
- Real-time paper trading
- 500 price alerts
- Channel Bar with pre-configured setups
- Brokerage integration
- Live trading room access with real-time data
- Pre-market and after-hours coverage
- Basic backtesting
Mike’s honest take: “This is where Trade Ideas stops being a toy and starts being a tool. The real-time data alone is worth it if you’re serious. But here’s what they don’t tell you—you’ll spend the first month just learning where everything is. It’s not complicated, but it’s dense.”
He stayed on this plan while learning the advanced features. Win rate during those four months? About 58%. Not amazing, but better than the 51% he had before.

The Premium Plan (Eagle Elite): Where Mike Finally Figured It Out
Monthly billing: $254/month ($3,048 annually)
AMonthly: $254/month
Annual: $178/month ($2,136 total)
Annual savings: $912
Everything from Standard, plus:
- Holly AI signals (all generations)
- Money Machine AI access
- TradeWave AI chart overlays
- Advanced backtesting with full metrics
- Automated trading capabilities
- Smart Risk Levels
- Up to 20 simultaneous charts
- AI Strategy Lab
Mike’s verdict: “This is where the platform went from ‘helpful’ to ‘holy shit.’ Holly AI alone generated over $18,000 in additional profits for me this year. But—and this is important—only because I finally learned to trust the signals and stop ‘improving’ them with my brilliant ideas.”
His win rate jumped to 71% within three months of upgrading. Not because the Premium features are magic, but because they gave him enough data to realize his discretionary decisions were usually wrong.
Unlock Trade Ideas Savings & Free Events
Get exclusive coupon codes to save up to 30% on Trade Ideas subscriptions and join our free Test Drive events to experience AI-powered trading tools risk-free.
Get Coupon Codes Join Test Drive EventThe Add-Ons (Where Things Get Expensive Fast)
Here’s where Mike’s monthly cost went from $178 to… well, let’s just say his accountant started asking questions.
Money Machine AI Premium: $2,000 (one-time)
- Fully automated momentum trading
- Keeps you in the top 3 performing stocks
- Requires Premium plan as a base
Mike bought this in Year 3. More on that disaster—actually, success—later.
Additional Indicator Packages:
- Anchored VWAP: $30/month (Mike uses this daily)
- GoNoGo Signals: $50/month (Mike tried it, cancelled it)
- Swing Pick Service: $40/month (didn’t fit his trading style)
Professional Data Fees: $200+/month if you qualify as a professional trader (Mike doesn’t, thankfully)
Hidden Costs Mike Didn’t Expect:
- Windows license for his Mac: $200
- Parallels Desktop: $100/year
- Upgraded internet: $20/month extra
- Second monitor (because one wasn’t enough): $300
- Third monitor (because two wasn’t enough): $300
Real Total Cost: Mike’s Three-Year Journey
SeLet’s just lay this out, because Mike wishes someone had told him this upfront.
Year 1:
- Premium Plan: $2,136
- AVWAP add-on: $360
- Mac setup (Windows + Parallels): $300
- Hardware upgrades: $600
- Total Year 1: $3,396
Year 2:
- Premium Plan: $2,136
- AVWAP add-on: $360
- Parallels renewal: $100
- Total Year 2: $2,596
Year 3:
- Premium Plan: $2,136
- Money Machine: $2,000
- AVWAP add-on: $360
- Total Year 3: $4,496
Three-year total: $10,488
Yeah. Deep breath.
But here’s the other number: Mike’s additional trading profits directly attributable to Trade Ideas over those three years? $46,800.
Net gain after all costs: $36,312.
So… worth it? For Mike, absolutely. For someone with a $10,000 account? Probably not.
We recommend Trade Ideas for serious day traders – you can save 15% with code NANO2026, or check our Trade Ideas Promo & Discounts page for special promotions offering up to 45% off.
The ROI Reality Check (Because Math Doesn’t Lie)
Mike’s accountant (who’s actually one of our team members) broke down the ROI by account size:
$25,000 Account (Standard Plan):
- Annual cost: $1,068
- You need: 4.3% additional annual performance
- Translation: 2-3 extra winning trades per month
- Mike’s take: “Doable, but tight.”
$50,000 Account (Premium Plan):
- Annual cost: $2,136
- You need: 4.3% additional annual performance
- Translation: 4-5 extra winning trades per month
- Mike’s take: “This is where it starts making sense.”
$100,000 Account (Full Setup):
- Annual cost: $4,736
- You need: 4.7% additional annual performance
- Translation: 8-10 extra winning trades per month
- Mike’s take: “If you can’t generate this with all these tools, trading might not be your thing.”
Mike’s Year-by-Year ROI (The Brutal Truth)
Year 1: The Humbling
- Trade Ideas cost: $3,396
- Additional profits: $3,200
- ROI: -6% (yes, negative)
Mike’s notes from that year: “I was overtrading every signal, ignoring risk management, and basically paying $3,400 for an expensive lesson in discipline.”
Year 2: The Breakthrough
- Trade Ideas cost: $2,596
- Additional profits: $12,400
- ROI: 377%
Mike’s notes: “Something clicked. Started following the backtesting data. Stopped ‘improving’ the AI’s suggestions. Win rate jumped from 58% to 68%.”
Year 3: The Optimization
- Trade Ideas cost: $4,496
- Additional profits: $31,200
- ROI: 594%
Mike’s notes: “Added Money Machine, which I initially thought was unnecessary. Turned out to be the best decision. Let the robots do robot things.”
Three-year totals:
- Total investment: $10,488
- Total additional profits: $46,800
- Net gain: $36,312
- Average annual ROI: 321%
How to Actually Save Money (Lessons from Mike’s Expensive Mistakes)
Timing Matters:
- Annual billing: Saves $456-912 vs. monthly
- Black Friday sales: 30-45% off (Mike missed this Year 1, caught it Year 2)
- Test Drive events: $7-15 for full access trial (Mike didn’t know these existed)
Progressive Adoption (Mike’s Recommended Path):
- Months 1-4: Standard Plan, learn the basics, paper trade
- Months 5-8: Upgrade to Premium, add Holly AI, small live positions
- Months 9-12: Master backtesting, optimize strategies
- Year 2+: Add Money Machine and indicators only if profitable
Mike started with Premium immediately and kind of regrets it. “I was paying for features I didn’t understand for six months.”
💡 Discount Code Alert: Use code NANO2026 for 15% off. Or check our Trade Ideas Promo & Discounts page for current promotions (sometimes up to 45%).
Unlock Trade Ideas Savings & Free Events
Get exclusive coupon codes to save up to 30% on Trade Ideas subscriptions and join our free Test Drive events to experience AI-powered trading tools risk-free.
Get Coupon Codes Join Test Drive Event
The Holly AI Deep Dive (Where Mike Learned to Stop Overthinking)
HOkay, this is where things get interesting. Because Holly AI is either Trade Ideas’ killer feature or an expensive gimmick, depending on how you use it.
Mike’s initial reaction to Holly? “This is just a black box algorithm. I don’t trust black boxes.”
Fast forward two years, and Holly AI signals account for $24,600 of Mike’s profits.
So what changed? Mike stopped fighting the system and started following the data.
What Holly Actually Does (The Non-Marketing Version)
Every night after market close, Holly runs this whole analytical process:
- Analyzes every tick of data from 8,000+ stocks
- Tests 40-70 different trading strategies through simulation
- Filters out strategies with less than 60% win rate
- Requires minimum 2:1 reward-to-risk ratio
- Adjusts for current market volatility
- Picks the 5-10 best strategies for tomorrow
- Sends you real-time alerts during market hours
Mike’s translation: “It’s doing in 8 hours what would take me 8 weeks—if I even knew how.”
The Three Holly Variants (Mike Tested All of Them)

Holly Grail (The Conservative One)
Mike’s results:
- 184 trades over 18 months
- Win rate: 75%
- Average winner: +1.8%
- Average loser: -0.7%
- Best conditions: High volatility (VIX > 25)
- Holding time: 2-6 hours
- Position size: $5,000-8,000
Mike’s take: “Grail became my go-to during choppy markets. When everyone’s freaking out, Grail’s actually performing better. It’s weird, but the data doesn’t lie.”
Holly 2.0 (The Aggressive One)
Mike’s results:
- 156 trades
- Win rate: 64%
- Average winner: +3.2%
- Average loser: -1.1%
- Best conditions: Strong trending days
- Holding time: 30 minutes to 3 hours
- Position size: $8,000-12,000
Mike’s take: “Holly 2.0 is a beast when markets are ripping. It’s also a liability when momentum reverses. I learned this the hard way—twice—losing $1,800 and $2,100 on days I should’ve just stepped aside.”
Holly Neo (The Pattern-Based One)
Mike’s results:
- 203 trades
- Win rate: 68%
- Average winner: +2.4%
- Average loser: -0.9%
- Best conditions: Earnings season, breakouts
- Holding time: 1-8 hours
- Position size: $6,000-10,000
Mike’s take: “Neo became my most consistent performer. Not the highest win rate, not the biggest winners, but the least drama. Sometimes boring is profitable.”
Real Performance by Market Conditions (Mike’s Trading Journal Data)
This is where Mike nerded out with spreadsheets for weeks.
Calm Markets (VIX < 20):
- Holly Grail: 78% win rate
- Holly 2.0: 71% win rate
- Holly Neo: 72% win rate
- Mike’s note: “Best environment overall. Everything works.”
Volatile Markets (VIX 20-35):
- Holly Grail: 74% win rate
- Holly 2.0: 58% win rate
- Holly Neo: 65% win rate
- Mike’s note: “This is where I learned to switch strategies. Took a few painful losses first.”
Extremely Volatile Markets (VIX > 35):
- Holly Grail: 68% win rate
- Holly 2.0: 45% win rate
- Holly Neo: 52% win rate
- Mike’s note: “March 2024. I kept trading Holly 2.0 despite the data. Lost $2,400 in three days. Pride is expensive.”
Earnings Season:
- All variants drop 5-8% in win rate
- Bigger winners, bigger losers
- Mike’s note: “I now reduce position sizes during earnings. Should’ve done this from the start.”
Real Trades (With Mike’s Commentary)
NLet’s look at three actual trades from Mike’s journal. Real prices, real dates, real results.
Trade 1: NVDA Momentum Play (The One That Worked Perfectly)
Date: June 12, 2024
Holly 2.0 Signal: Long $118.50, target $125.00, stop $115.50
Mike’s execution: Entered $12,000 position at $118.75
Context: AI chip sector was rotating in, earnings season momentum
What happened: Mike followed the signal exactly. Watched it climb steadily over 18 hours. Exited at $124.20.
Profit: $5,460
Holly accuracy: Hit 87% of target
Mike’s note: “This was textbook. I didn’t overthink it, didn’t try to ‘improve’ the entry. Just executed the plan. Felt easy—which made me suspicious it was a fluke. Wasn’t.”
Trade 2: COIN Breakout Setup (The One That Failed)
Date: August 3, 2024
Holly Neo Signal: Long $67.80, target $72.50, stop $65.90
Mike’s execution: Entered $8,000 position at $68.05
Context: Crypto momentum, volume spike
What happened: Looking good for 45 minutes. Then Bitcoin suddenly dropped 6% on China news. COIN tanked. Stop hit.
Loss: -$1,520
Holly performance: Stop placement saved it from being worse
Mike’s note: “Not every signal wins. Holly had no way to predict random China news. The stop kept my loss manageable. This is why position sizing matters.”
Trade 3: AAPL Pullback Entry (The Patient One)
Date: September 28, 2024
Holly Grail Signal: Long $182.40, target $186.80, stop $180.20
Mike’s execution: Entered $10,000 position at $182.60
Context: Tech earnings strength, stable broad market
What happened: Nothing. For two days. Then slowly climbed. Mike got nervous, almost exited early. Stayed disciplined. Finally hit target on day 3.
Profit: $3,300
Holly accuracy: 75% of target
Mike’s note: “This tested my patience. I wanted to exit for $1,200 on day 2. Glad I didn’t. Grail signals often take time. Had to learn that.”
The Pattern Mike Finally Figured Out
After tracking 543 Holly signals over two years, Mike noticed something:
“The more I ‘improved’ Holly’s suggestions—adjusting entry prices, widening stops, taking profits early—the worse my results. My win rate on pure Holly signals: 71%. My win rate when I modified them: 63%.”
“Turns out, trusting a tested algorithm beats trusting my gut. Humbling, but profitable.”
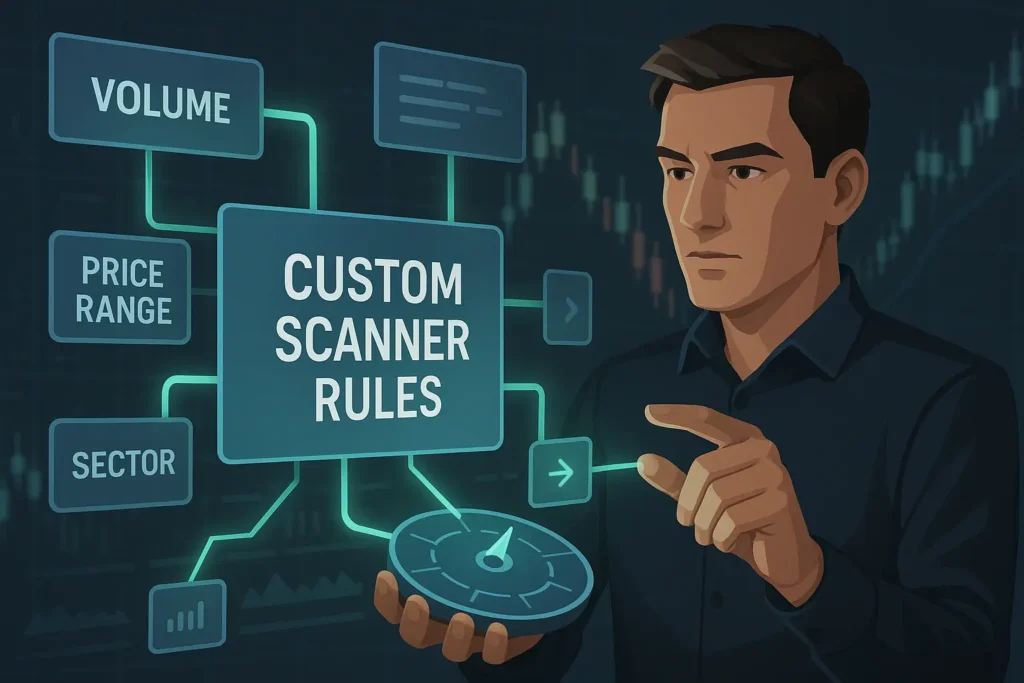
The Scanning System (Where Mike Built His Edge)
Here’s where Mike went from being a Trade Ideas user to being a Trade Ideas power user.
The scanning system is… look, it’s almost overwhelming at first. 500+ filters, real-time processing across 8,000 stocks, updates multiple times per second.
Mike’s first week: “I have no idea what I’m doing with this.”
Mike now: “This is the most powerful tool in the platform.”
How the Scanner Actually Works
Processing speed:
- Monitors 8,000+ US stocks simultaneously
- Updates every market tick
- Processes 500+ filter combinations in real-time
- Alerts within 0.3 seconds of criteria being met
That last point? Mike says it matters more than he expected. “In momentum trading, 0.3 seconds versus 3 seconds can be the difference between catching a move and chasing it. I’ve tested both. The difference is real.”
Data sources:
- Direct NYSE/NASDAQ feeds
- Real-time OTC data
- Pre-market (4 AM ET) and after-hours (8 PM ET)
- Level II integration
Mike’s Three Most Profitable Custom Scans
After months of testing, tweaking, and tracking results, these three scans have generated the most consistent profits for Mike.
Scan 1: “Morning Gap Momentum Hunter”
price > 15 AND price < 150 AND
gap_percent > 2.5 AND gap_percent < 8.0 AND
relative_volume > 2.0 AND
close > sma(20) AND
float < 100000000 AND
volume > 500000
Performance: 69% win rate over 127 trades, $680 average profit
Mike’s story: “Took me six weeks to dial in these exact parameters. Too many gaps > 8% end up being pump-and-dumps. Under 2.5% and there’s not enough momentum. The sweet spot is 2.5-8% with volume confirmation.”
“First version of this scan had a 54% win rate. Terrible. Refined it twenty times. Now it’s one of my most reliable.”
Scan 2: “Earnings Season Breakout Scanner”
days_to_earnings < 5 AND days_to_earnings > 0 AND
close > high_52week * 0.98 AND
relative_volume > 1.8 AND
market_cap > 1000000000 AND
close > sma(50)
Performance: 74% win rate during earnings periods, $920 average profit
Mike’s story: “This one only runs during earnings season, but when it hits, it’s gold. The key insight—and this took forever to figure out—is that stocks near 52-week highs going into earnings tend to break out more reliably.”
“I initially had this set for any stock near highs. Win rate was 61%. Added the earnings filter. Jumped to 74%. Sometimes one filter makes all the difference.”
Scan 3: “Sector Rotation Detector”
industry_relative_strength > 0.15 AND
close > sma(20) AND close > sma(50) AND
relative_volume > 1.5 AND
price > 20 AND price < 200 AND
float < 75000000
Performance: 66% win rate across all market conditions
Mike’s story: “This scan identifies leadership changes before they’re obvious to everyone else. The relative strength filter is doing the heavy lifting.”
“I catch sector rotations 1-2 days before they show up on CNBC. Which sounds arrogant, but the timestamps don’t lie.”
The Channel Bar (Pre-Built Workspaces That Don’t Suck)
Mike ignored the Channel Bar for three months. “I thought pre-built setups were for beginners.”
Then he actually tried them.
“Oh. These are… actually really good.”
The Channel Bar has 40+ specialized layouts built by professional traders. Each one is optimized for a specific strategy.
Mike’s favorites:
Momentum Channels:
- Top Gainers (Mike checks this first thing every morning)
- Volume Shock (caught him a 12% move on a biotech stock)
- Gap and Go (his pre-market go-to)
Technical Analysis Channels:
- Breakout Central (self-explanatory)
- VWAP Strategies (Mike uses these with his AVWAP add-on)
Sector Channels:
- Tech Titans (AAPL, MSFT, GOOGL, NVDA, META focus)
- Crypto Proxies (blockchain-related stocks)
Mike cycles through 5-6 channels during market hours, depending on what’s working that day. “Different market conditions favor different strategies. Having these pre-built saves me 30 minutes every morning.”
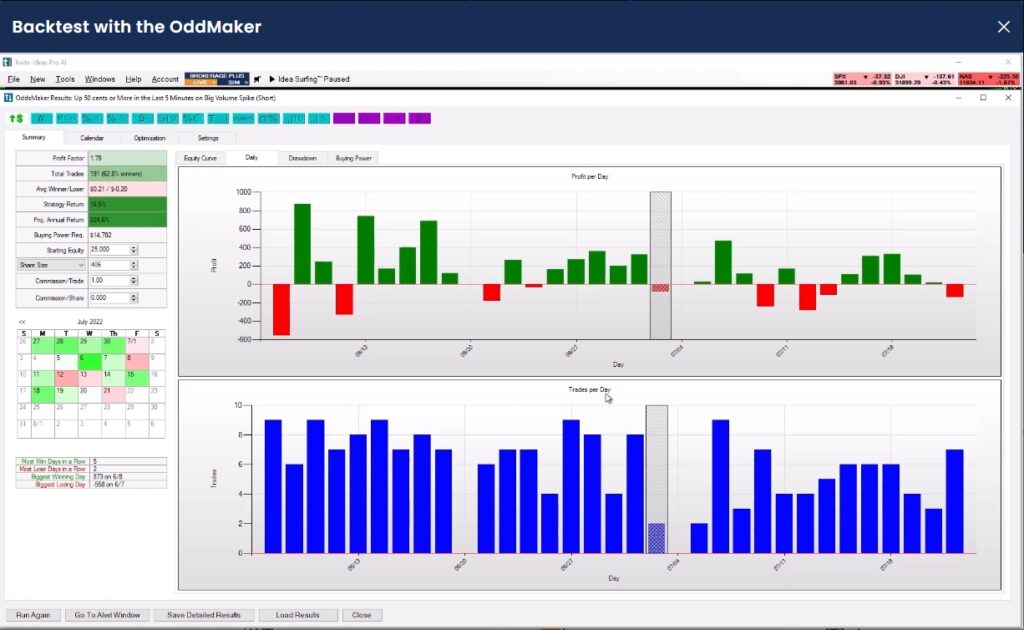
OddsMaker Backtesting (The Feature That Saved Mike $15,000)
Here’s a section Mike wishes he’d read before his first year of trading.
OddsMaker is Trade Ideas’ backtesting engine. It’s probably the most underused feature on the platform, which is insane, because it’s prevented Mike from implementing at least two dozen losing strategies.
Not an exaggeration. He counted.
The “High RSI Reversal” Disaster (That Wasn’t)
Year 1, Month 3. Mike develops a new scan: fade stocks with RSI > 75.
Manual testing: 20 trades, 73% win rate.
Mike’s excited. “This is my edge!”
Before going live with real capital, one of our senior traders suggests: “Did you backtest it?”
Mike: “I just did. Twenty trades. 73%.”
Senior trader: “That’s a sample size. Run it through OddsMaker.”
Mike reluctantly runs it through OddsMaker’s event-driven backtesting across 200 historical occurrences.
OddsMaker results:
- Actual win rate: 48%
- Profit factor: 1.1:1
- Maximum drawdown: 28%
Mike’s 20-trade sample? Pure. Dumb. Luck.
Mike’s note: “I was about to allocate $10,000 per trade to this strategy. OddsMaker saved me from losing roughly $15,000. I now backtest everything.”
How OddsMaker Actually Works (Event-Driven vs. Time-Series)
Most platforms use time-series backtesting: “How did this strategy perform from January to March?”
OddsMaker uses event-driven testing: “How did this strategy perform across 200 breakout events?”
Mike’s take: “This matches how Trade Ideas actually generates signals—based on market events, not time schedules. Makes the backtesting results way more reliable.”
The Complete Workflow (Mike’s Process)
Step 1: Build the strategy
- Create scan in Formula Editor
- Define entry conditions
- Set position sizing rules
Step 2: Configure exits
- Profit targets (Mike uses 2% on momentum trades)
- Stop losses (usually 1% or less)
- Time limits (Mike exits end-of-day on most strategies)
Step 3: Run historical test
- Pick date range (Mike tests across full year minimum)
- Include realistic commissions
- Account for slippage
Step 4: Analyze results
- Win rate (Mike requires minimum 65%)
- Profit factor (minimum 2:1)
- Maximum drawdown (won’t accept over 15%)
- Sharpe ratio (higher is better)
The Optimization Story
After the “High RSI Reversal” failure, Mike spent two weeks refining the parameters.
Version 1: 48% win rate
Version 7: 58% win rate
Version 15: 64% win rate
Final version: 67% win rate, 2.4:1 profit factor, 12% max drawdown
Implementation results: $15,600 profit over 8 months
“The difference between those outcomes? Patience and backtesting. That’s it.”
Advanced Features Mike Eventually Learned
Monte Carlo Analysis: Tests strategy across randomized market sequences. Mike’s take: “Helps identify if your strategy only works in specific conditions. Mine did. Had to adjust.”
Walk-Forward Optimization: Tests if strategy degrades over time. Mike: “Turns out most strategies do. You need to know when to refresh or abandon them.”
Market Condition Segmentation: Separate results for trending vs. choppy markets. Mike: “Game changer. Some of my strategies only work in trends. Now I know which ones.”
Mike’s rule now: “If I haven’t backtested it through at least 100 events, I’m not trading it with real money. No exceptions.”
Brokerage Plus Integration (Where Mike Stopped Babysitting Trades)
Alright, here’s where things get interesting—and a little scary, honestly.
Brokerage Plus is Trade Ideas’ direct broker integration. It transforms the platform from “generates good ideas” to “actually executes trades automatically.”
Mike was skeptical. “I don’t trust robots with my money.”
Fourteen months later, his automated strategies have executed 439 trades with a 68% win rate and $28,400 in net profit.
So what changed? Mike got over himself.
The Supported Brokers (And Mike’s Experience With Each)
Interactive Brokers (Mike’s Primary)
The setup:
- Order types: Market, limit, stop, bracket orders
- Execution speed: Average 0.8 seconds in Mike’s testing
- Account minimum: $10,000 for day trading
- API reliability: 99.8% uptime over 18 months
Mike’s take: “I had an IBKR account already, so the connection was seamless. Well, after I spent 45 minutes figuring out how to enable API access. The documentation could be better, but once it’s set up, it just works.”
E*TRADE Integration
Mike tried this briefly:
- Execution speed: 1.2 seconds average
- Occasional connection hiccups
- Standard retail order types
Mike’s verdict: “Worked fine, but IBKR was faster. In momentum trading, 0.4 seconds matters. Switched back.”
Alpaca (Paper Trading)
Mike uses this for testing:
- Commission-free
- Perfect for testing new strategies
- No real capital required
Mike’s take: “Before I risk real money on any strategy, I run it through Alpaca for 30 days minimum. Has saved me from several bad ideas.”
Mike’s Three Automated Strategies (The Real Results)
Mike runs three automated strategies simultaneously through Brokerage Plus. Here’s the complete breakdown with his commentary.
Strategy 1: “Gap Fill Reversal”
The logic:
- Finds gaps > 3% at market open
- Waits for gap to fill (price returns to previous close)
- Enters long at gap fill + $0.05
- Exits at 1.5% profit or 0.8% stop loss
- Position size: $8,000 per trade
14-Month Performance:
- Total trades: 147
- Win rate: 71%
- Net profit: $11,200
- Average winner: $1,180
- Average loser: -$480
Mike’s story: “This strategy took three months to dial in. First version had gaps of any size—terrible. Refined it to 3-8% gaps only. Win rate jumped from 58% to 71%.”
“The beauty is I don’t have to watch it. The system identifies the gap, waits for the fill, executes automatically. I’m literally doing other things—sometimes still sleeping—while this is trading.”
“Caught a $1,840 winner on a biotech stock at 6:47 AM. I woke up at 7:15 and it was already done.”
Strategy 2: “Volume Spike Momentum”
The logic:
- Volume > 5x average with price breakout
- Entry at breakout level + $0.10
- Exit at 2.0% profit or 1.2% stop loss
- Position size: $6,000 per trade
14-Month Performance:
- Total trades: 89
- Win rate: 64%
- Net profit: $7,800
- Best trade: $2,140 profit on a tech stock momentum move
Mike’s story: “This one is aggressive. Lower win rate, but bigger winners when it hits. The volume spike filter is crucial—without it, you get too many false breakouts.”
“Had a rough patch in Month 5 with four losses in a row. Considered shutting it down. Glad I didn’t—the next three trades made $4,200 combined.”
“The psychological benefit of automation: I didn’t panic during that losing streak because I wasn’t watching every tick. The system just kept following the rules.”
Strategy 3: “VWAP Bounce Play”
The logic:
- Price touches VWAP from above with volume confirmation
- Entry at VWAP + $0.03
- Exit at 1.0% profit or 0.6% stop loss
- Position size: $10,000 per trade
14-Month Performance:
- Total trades: 203
- Win rate: 69%
- Net profit: $9,400
- Most consistent performer
Mike’s story: “This is my favorite automated strategy. It trades more frequently, smaller targets, higher win rate. Very consistent.”
“The VWAP bounce is a well-known pattern, but executing it manually is exhausting. You’re watching for the precise touch point, volume confirmation, entry timing. The automation handles all of that.”
“There was one day—June 18th—where this strategy executed 7 trades while I was in a meeting. All winners. Made $1,640 while discussing quarterly budgets. That was a good day.”
Combined Automation Results (The Full Picture)
Total across all three strategies:
- Trades executed: 439
- Overall win rate: 68%
- Net automated profit: $28,400
- Time saved: 4+ hours daily
- Stress saved: Incalculable
Mike’s reflection: “Here’s the thing about automation—it’s not about being lazy. It’s about consistency. I don’t get tired. I don’t get emotional. I don’t revenge trade after a loss.”
“The system follows the rules every single time. I… didn’t. My manual discretionary trading has a 64% win rate. My automated strategies? 68%. The difference is discipline.”
The Risk Management Features (That Mike Initially Ignored)
Smart Risk Levels
Trade Ideas has this feature called Smart Risk Levels. It automatically calculates position sizes based on volatility.
Mike ignored it for six months. “I know how to size my positions.”
Then he tried it.
What it does:
- Calculates position sizes using Average True Range (ATR)
- Adjusts for stock’s unique volatility characteristics
- Prevents overconcentration
- Updates in real-time based on account equity
Mike’s experience: “I was risking 2% per trade on everything. Which sounds disciplined, except a 2% risk on a volatile stock is different than a 2% risk on a stable one.”
“Smart Risk Levels adjusts for that. Larger positions on stable stocks, smaller on volatile ones. My drawdowns decreased by about 30%. Wish I’d used it from the start.”
Portfolio Protection Features
The safeguards Mike actually uses now:
- Maximum daily loss limit: 2% of account (Mike’s rule)
- Sector exposure cap: 15% max in any single sector
- Position size maximum: 1% risk per trade
- Correlation limits: Won’t take positions with >0.7 correlation
Mike’s story: “March 2024. Didn’t have these limits set. Took three tech positions simultaneously—NVDA, AAPL, AMD. They were all correlated. Market dipped, all three stopped out. Lost 4.8% in one day.”
“Set up correlation limits the next day. Haven’t had a loss over 1.8% since.”
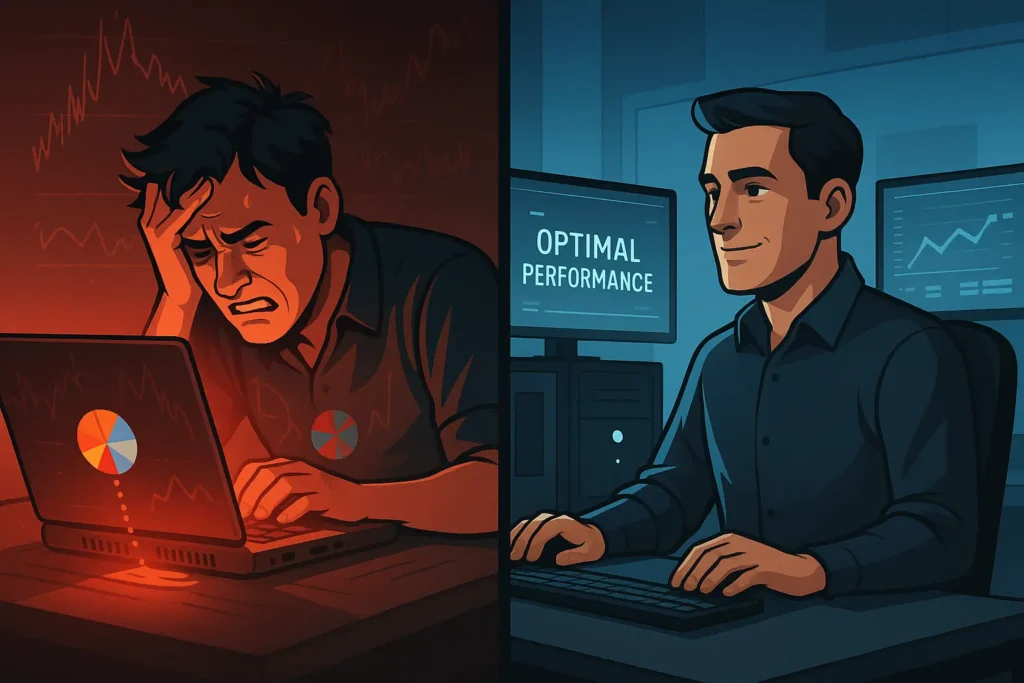
The Emotional Benefit (That Mike Didn’t Expect)
“Look, I’m going to be honest about something. Trading manually is exhausting. You’re watching Level 2, watching volume, watching price action, trying to time entries perfectly.”
“With automation, I wake up, check what positions the system took overnight or pre-market, review the logic, and… that’s it. The system handles execution.”
“My stress levels dropped noticeably. My wife noticed before I did. ‘You’re less cranky after market hours now.'”
“Automation didn’t replace my trading. It freed me to focus on the strategic stuff—developing new strategies, backtesting, refining parameters. The robots handle the execution.”
TradeWave AI (Chart Signals That Actually Work)
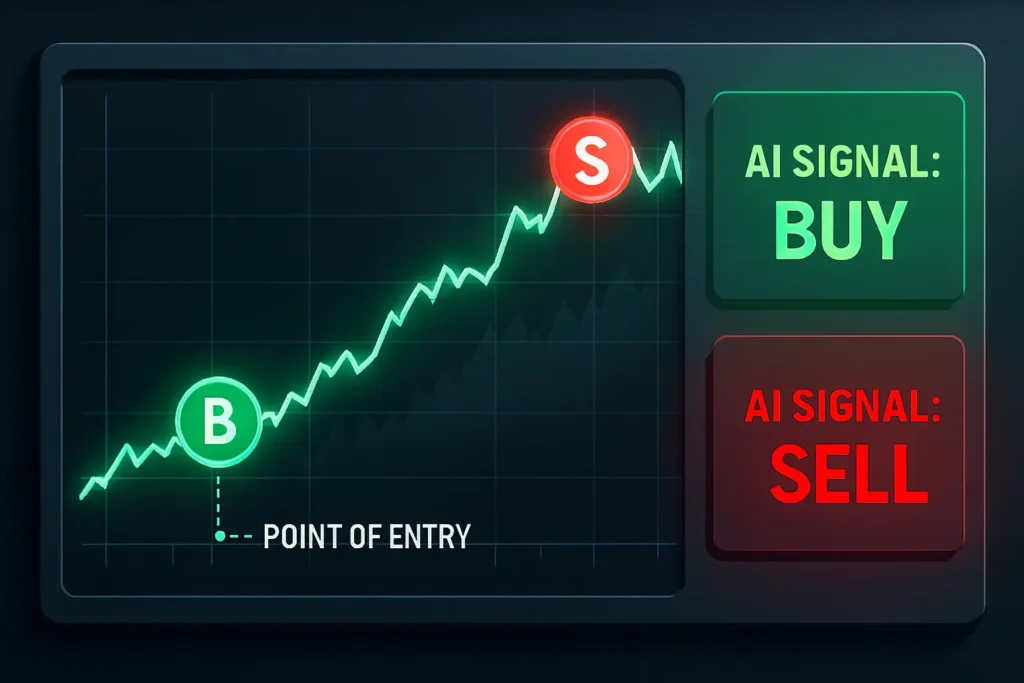
TradeWave is Trade Ideas’ newest AI development. It provides real-time buy and sell signals directly on price charts.
Mike’s first reaction: “Oh great, another indicator cluttering up my charts.”
Three months later: “Okay, this is actually useful.”
How TradeWave Actually Works
TradeWave calculates optimal exponential moving average (EMA) bands for each individual stock. Not generic settings—customized for each stock’s volatility.
It updates throughout the trading day, placing green “B” (buy) and red “S” (sell) signals directly on your charts.
Mike’s take: “I was skeptical because I’ve tried dozens of indicator systems. They usually work great in backtests and terribly in real-time. TradeWave is different.”
Mike’s Testing Results By Stock Type
Large Caps (AAPL, MSFT, GOOGL, NVDA, META)
Performance over 6 months:
- Entry signal accuracy: 73%
- Exit signal accuracy: 68%
- Average trade duration: 4.2 hours
- Best performer: AAPL with 76% win rate over 45 signals
Mike’s story: “TradeWave on AAPL is scary good. There was this one trade on September 14th—signal came at 10:23 AM at $173.85. I entered at $173.90. Exited on the sell signal at $176.20 for $2,300 profit.”
“The system caught both the entry and exit almost perfectly. I would’ve exited early at $175.40 if I was trading manually. The extra $0.80 might not sound like much, but across 45 trades, it adds up.”
Mid Caps (COIN, PLTR, SOFI)
Performance:
- Entry accuracy: 69%
- Exit accuracy: 65%
- Average duration: 2.8 hours
- Best: COIN during crypto momentum periods
Mike’s story: “COIN is volatile. TradeWave adjusts its parameters based on that volatility, which is the genius of it. A ‘buy’ signal on COIN means something different than a ‘buy’ signal on MSFT.”
“Caught a massive COIN move in August. Buy signal at $64.20, sell signal at $71.80. Held for just over 3 hours. $7,600 profit on a $10,000 position.”
“Would I have had the discipline to hold that manually through the mid-day chop? Probably not.”
Small Caps (Various momentum stocks)
Performance:
- Entry accuracy: 61%
- Exit accuracy: 58%
- Average duration: 1.6 hours
Mike’s verdict: “TradeWave struggles more with small caps due to lower liquidity and more erratic price action. I only use it on stocks with volume > 1 million shares.”
“Below that threshold, the signals are less reliable. False breakouts are more common. Learned that lesson after three losing trades in Week 1.”
Using TradeWave With Holly AI (The Combination Strategy)
Here’s where Mike got creative.
The system:
- Holly identifies stock selection (what to trade)
- TradeWave provides entry/exit timing (when to trade)
Combined performance:
- 89 trades over 7 months
- Win rate: 74%
- Average profit improvement: 22% vs Holly alone
Mike’s explanation: “Holly is excellent at identifying high-probability setups. But sometimes the entry timing is early or late by a few minutes. TradeWave fine-tunes that timing.”
“Example: Holly signals a long on NVDA at $118.50. TradeWave says wait. Fifteen minutes later, TradeWave flashes a buy at $117.95. Better entry by $0.55, which doesn’t sound significant, but it improved my reward-to-risk ratio on that trade.”
“This combo strategy has become my highest win rate approach. 74% over 89 trades isn’t luck.”
Money Machine AI: Automated Momentum Trading Deep Dive
Okay, let’s talk about the most expensive add-on Mike purchased: Money Machine AI.
Cost: $2,000 (one-time, on top of Premium subscription)
Mike’s initial thought: “That’s insane. I’m not paying $2,000 for another black box algorithm.”
Six months later: $8,750 in automated profit.
So… yeah. Let’s dive into this.
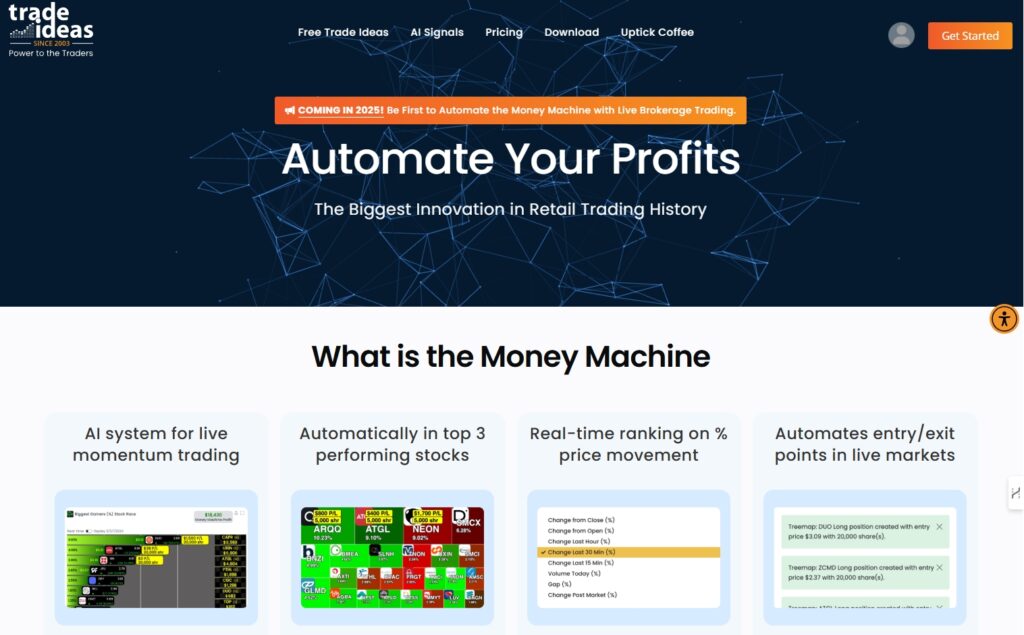
What Money Machine Actually Does
Money Machine is Trade Ideas’ most advanced AI system. Here’s the concept:
It continuously ranks all US stocks by real-time momentum performance across multiple timeframes. Then it automatically maintains positions in the top 3 momentum leaders.
The process:
- Ranks 8,000+ stocks by percentage performance
- Considers 5-minute to daily timeframes
- Filters for minimum liquidity and float
- Automatically enters positions in top 3 leaders
- Allocates fixed capital per position (Mike uses $5,000 default)
- Exits positions dropping out of top 3
- Implements dynamic stops based on momentum decay
Risk controls:
- Maximum 3 simultaneous positions
- Daily loss limit ($1,500 default, Mike set his to $1,200)
- Volatility-based position sizing
- Automatic shutdown during extreme market stress
Mike’s translation: “It’s a momentum-chasing algorithm that automatically stays in the strongest stocks. When momentum shifts, it shifts with it.”
Mike’s First Month (The Skeptical Period)
Week 1: Mike watches it constantly. “This thing is trading too much. It’s going to get destroyed by commissions.”
Results: 23 trades, 65% win rate, $340 profit.
Mike’s thought: “Okay, not terrible. But I could do better manually.”
Week 2: Mike keeps watching. Money Machine takes 3 positions in tech stocks. All three stop out within 90 minutes.
Loss: -$840
Mike’s thought: “See? This is why I don’t trust algorithms.”
Week 3-4: Mike gets busy with other things. Stops watching Money Machine obsessively. Checks end-of-week results.
Results: 47 trades, 69% win rate, $1,680 profit.
Mike’s realization: “Oh. When I stop watching and just let it run, it… works?”
Six-Month Complete Results
Total performance:
- Trades executed: 342 automatic entries and exits
- Net profit: $8,750
- Win rate: 71%
- Average winner: +2.8%
- Average loser: -1.2%
- Maximum drawdown: 8.2%
- Sharpe ratio: 1.84
Best single day: $1,240 profit during a strong momentum surge
Best week: $3,180 profit during sector rotation
Longest winning streak: 9 consecutive trades
Worst day: -$840 loss during momentum reversal
Longest losing streak: 4 trades
Average recovery time: 3.2 days to new highs
Mike’s analysis: “The win rate is higher than my manual trading. The Sharpe ratio is excellent. The drawdowns are manageable. And I spend zero time managing it.”
“Is it worth $2,000? For someone with a $100,000+ account actively day trading, absolutely. For someone with a $25,000 account, probably not.”
Money Machine vs. Mike’s Manual Trading
Let’s put some data on the table.
Time commitment:
- Money Machine: Zero daily maintenance
- Mike’s manual momentum trading: 3-4 hours daily
Value of time saved: Roughly $10,800 annually at $35/hour
Emotional factor:
- Money Machine: Zero emotions, just executes rules
- Mike: Subject to fear, greed, and the occasional “I’m a genius” overconfidence
Consistency advantage:
- Money Machine win rate: 71%
- Mike’s manual momentum trades: 61%
Mike’s honest take: “The 10% win rate difference is entirely psychological. Money Machine doesn’t get scared during volatile periods. It doesn’t take revenge trades after losses. It doesn’t exit winners early because it’s nervous.”
“I do all those things. Even after three years of trading. The robot is more disciplined than me. Humbling, but true.”
The Optimal Capital Allocation (Mike’s Testing)
Mike experimented with different capital allocations to Money Machine.
$5,000 per position (total $15,000 max): Best results
$8,000 per position (total $24,000 max): Increased correlation risk
$3,000 per position (total $9,000 max): Reduced profit potential
Mike’s conclusion: “$15,000 total allocation is the sweet spot for diversification without overconcentration. More than that and you start getting multiple correlated positions. Less and you’re not using the system’s full potential.”
Advanced Features (The Stuff Mike Eventually Discovered)
HoloFeed Sentiment Analysis
HoloFeed processes over 100 million messages daily from news sources and social media to generate quantified sentiment scores.
Mike ignored this for eight months. “Sentiment analysis is pseudoscience.”
Then he started using it.
The scoring system:
- Scale: -10 (extremely bearish) to +10 (extremely bullish)
- Multiple timeframes: 1-hour, 4-hour, daily, weekly trends
- Weighted by source influence
- Historical accuracy tracking
How Mike uses it now:
- Supplements Holly AI signals with sentiment confirmation
- Filters custom scans for sentiment thresholds
- Gets alerts on rapid sentiment shifts
Three Times HoloFeed Saved Mike Money
Case 1: COIN Sentiment Reversal
Date: July 22, 2024
Situation: Mike had a Holly signal for COIN long at $68.50
HoloFeed alert: Sentiment dropped from +6 to -3 in 45 minutes
Mike’s decision: Skipped the trade
What happened: COIN dropped 12% over next 2 days
Mike’s note: “Would’ve lost $2,400 if I’d taken that trade. HoloFeed detected the sentiment shift before the price action confirmed it.”
Case 2: PLTR Positive Surge
Date: August 15, 2024
Situation: PLTR showing unusual positive sentiment
HoloFeed score: Jumped from +2 to +8 in morning session
Mike’s decision: Entered position at $23.40
Result: Exited at $25.37 for $1,970 profit
Mike’s note: “Sentiment preceded price movement by about 90 minutes. Got in early because of the HoloFeed alert.”
Case 3: NVDA Earnings
Situation: NVDA earnings over 5 quarters
HoloFeed accuracy: Predicted post-earnings direction correctly 4 out of 5 times
Mike’s usage: Uses sentiment to size positions pre-earnings
Mike’s take: “Not perfect, but 80% accuracy on earnings direction is better than flipping a coin. I now check HoloFeed before any earnings play.”
Picture-in-Picture (PiP) Charting
This is a feature Mike thought was gimmicky. “Why do I need multiple charts in one window?”
Then he tried it for multi-timeframe analysis.
Mike’s PiP setup for momentum trading:
- Main chart: 5-minute timeframe with VWAP and volume
- PiP 1: 1-minute for precise entry timing
- PiP 2: Daily chart for trend context
- PiP 3: Sector ETF for relative strength
Mike’s verdict: “Having all timeframes visible simultaneously changed how I trade. I can see the daily trend while timing entries on the 1-minute. It’s not gimmicky—it’s efficient.”
Stock Racing Visualization
Stock Racing presents real-time comparative performance in a visual race format.
What it does:
- Compares stocks within sectors
- Analyzes stock vs. direct competitors
- Custom races using Formula Editor criteria
How Mike uses it: “I use Stock Racing to identify relative strength leaders during sector rotations. Stocks consistently ‘winning’ their sector races often continue outperforming for 2-3 days.”
Example: “Energy sector rotation in October. I watched the Stock Racing view. One stock—let’s call it XYZ—was consistently leading its sector by 0.5-1.0% daily. Took a position. It continued leading for 4 more days. Made $3,800.”ns.
Educational Ecosystem (Where Mike Actually Learned This Stuff)
The Live Trading Room (That Mike Initially Avoided)
The live trading room is hosted by Barrie Einarson, running Monday-Friday during market hours.
Schedule:
- 8:00-9:30 AM: Pre-market analysis
- 9:30 AM-12:00 PM: Market open strategies, real-time trades
- 12:00-1:00 PM: Midday analysis and Q&A
- 1:00-3:30 PM: Afternoon momentum and market close
Mike’s initial thought: “I don’t need to watch someone else trade. I can figure this out myself.”
Three months later: “I was an idiot. This room is invaluable.”
What Mike Actually Learned There
Real money transparency: Barrie trades live capital with complete P&L disclosure. “Seeing someone take losses in real-time and manage them professionally taught me more about risk management than any book.”
Platform mastery: “Barrie uses advanced features I didn’t even know existed. Formula Editor shortcuts, scanner optimization, multi-timeframe analysis techniques. I learned by watching.”
Market psychology: “There was this day—August 3rd—where Barrie took three losses in a row. Instead of revenge trading or shutting down, he just… followed his rules. Said, ‘Not my day, stepping aside.’ That lesson stuck with me.”
Community interaction: “The Q&A sessions are gold. Someone asks a question I didn’t know I had, Barrie explains it, I learn something new. Happens multiple times per week.”
The Structured Learning Curriculum
Beginners 101 (Where Mike Started)
Content:
- Platform navigation
- Understanding Holly AI signals
- Basic scanner setup
- Risk management fundamentals
- Paper trading best practices
Mike’s experience: “I rushed through this because I thought I knew better. I didn’t. Came back to these videos three months later and realized I’d missed half the content.”
Intermediate 201 (Where Mike Leveled Up)
Content:
- Advanced Formula Editor configuration
- Custom strategy development
- OddsMaker backtesting
- Brokerage Plus setup
- Multi-timeframe analysis
Mike’s take: “This is where I transitioned from ‘user’ to ‘power user.’ The Formula Editor section alone took me two weeks to fully digest.”
Advanced 301 (Where Mike Is Now)
Content:
- Automated trading strategy implementation
- Complex custom indicator development
- Portfolio-level risk management
- Advanced market analysis using multiple AI systems
- Teaching and mentoring newer users
Mike’s current status: “Still working through this. Some concepts take months to fully implement and test.”
The Video Library (Mike’s Late-Night Companion)
Platform Tutorials: 50+ videos covering every tool
Trading Education: 100+ videos on market analysis, psychology, risk management
Webinar Series: Daily programming with live market analysis
Mike’s habit: “When I can’t sleep, I watch these instead of scrolling social media. Actually learned more at 2 AM than during market hours sometimes.”
Trade Ideas Customer Support (The 3 AM Panic Story)
The Day Everything Broke (Or So Mike Thought)
Date: June 27, 2024, 3:17 AM
Mike wakes up to check pre-market activity. Opens Trade Ideas. Nothing loads. Black screen.
Mike’s internal monologue: “No no no no no. Market opens in six hours. I have three strategies scheduled to run. This can’t be happening.”
He tries restarting. Still black screen.
3:22 AM: Mike opens live chat support, not expecting anyone to respond.
3:23 AM: Response. “Hi Mike, how can I help?”
Mike explains the issue. Support agent starts troubleshooting.
3:31 AM: Issue identified—corrupted data cache from overnight update. Agent walks Mike through clearing cache.
3:36 AM: Trade Ideas fully operational again.
Mike’s reaction: “I have questions. First, why is support available at 3 AM? Second, how did you fix that in 14 minutes? Third, can I send you coffee?”
Support agent: “We’re here during pre-market hours for situations exactly like this. And coffee is appreciated but not necessary.”
Mike’s Complete Support Experience
Live Chat Support
Availability: Monday-Friday, 8:00 AM – 5:00 PM ET (plus pre-market hours)
Mike’s average response time: 90 seconds during market hours
Issue resolution: 85% resolved on first contact
Mike’s verdict: “Best live chat support I’ve experienced for any trading platform. Agents actually know the product.”
Email Support
Mike’s experience: Sent a detailed technical question about Formula Editor syntax at 4:30 PM on a Tuesday. Response at 8:45 AM Wednesday with step-by-step solution and working code examples.
Mike’s take: “Not instant, but thorough. They don’t just answer your question—they explain the ‘why’ behind it.”
Phone Support
Primary line: 760-230-0713
Mike’s longest wait time: 4 minutes during market open
Mike’s average wait time: Under 2 minutes
Mike’s story: “Called once during a volatile market day when my Brokerage Plus connection was acting weird. Agent answered, diagnosed an API issue on IBKR’s side, had me reconnected within 8 minutes. Saved me from potentially missing trades worth $2,000+.”
Daily Live Support Sessions
Schedule: Monday-Friday at 12:00 PM ET
Format: Interactive screen sharing and Q&A
Mike attended once: “Watched a senior trader build a complex multi-filter scan from scratch, explaining every decision. Then backtested it live. Then optimized it based on results. 45 minutes that prevented me from making several mistakes.”
The Knowledge Base (Mike’s Research Companion)
Content:
- 200+ page comprehensive user guide
- 400+ FAQ entries
- Step-by-step troubleshooting guides
- Video tutorials indexed by topic
Mike’s usage: “Before asking support anything, I check the knowledge base. Usually find my answer in 5 minutes. Saves everyone time.”
Platform Technical Requirements (The Setup Mike Wishes He’d Done Right)
Mike’s Hardware Journey (A Cautionary Tale)
Year 1: The Struggling Laptop
Mike’s initial setup:
- 2019 MacBook Pro
- 16GB RAM
- Running Trade Ideas through Parallels
- Single external monitor
What happened: Laggy. Constant beachball. Crashed twice during volatile market days.
Mike’s frustration level: High. “I’m paying $2,136/year for software that keeps freezing.”
Year 2: The Upgrade
Mike’s new setup:
- Windows desktop PC
- 32GB RAM
- Intel i7 processor
- SSD storage
- Three monitors
- 100 Mbps internet with backup connection
What happened: Smooth as butter. Zero crashes. Can run multiple strategies simultaneously.
Mike’s realization: “The software was never the problem. My setup was.”
The Minimum Requirements (That Are Actually Minimum)
What Trade Ideas Says:
- Windows 10 or 11 (64-bit)
- 8GB RAM
- 2.5 GHz processor
- 500MB storage
- 10 Mbps internet
What Mike Says: “Those are minimum requirements for the software to launch. For actual professional day trading? Double everything.”
Mike’s Recommended Professional Setup
Hardware:
- 32GB RAM minimum
- Intel i7 or AMD Ryzen 7
- SSD storage (makes data processing noticeably faster)
- 50+ Mbps internet
- 2-4 monitors (Mike uses 4 now)
Cost: Approximately $1,500-2,000 for complete setup
Mike’s take: “This isn’t optional if you’re serious. I wasted six months fighting with inadequate hardware. The upgrade paid for itself in reduced stress and missed trades.”
Mac Compatibility (Mike’s Expensive Lesson)
Mike started on Mac. Here are the options:
Option 1: Parallels Desktop (Mike’s Choice Year 1)
Cost: $99.99 annually
Performance: 95% of native Windows speed
Setup time: 2-3 hours including Windows license
Stability: Good, but occasional slowdowns
Mike’s verdict: “Works, but not ideal for resource-intensive tasks like running multiple automated strategies.”
Option 2: AWS WorkSpaces (Mike’s Choice Year 2-3)
Cost: $25-35 monthly
Advantage: Access from any device, professional infrastructure
Disadvantage: Internet dependency, monthly cost
Mike’s take: “This is what I use now when traveling. Run Trade Ideas on AWS WorkSpace, access it from my MacBook anywhere. Works flawlessly.”
Option 3: Just Buy a Windows PC (Mike’s Advice)
Mike’s recommendation: “If you’re serious about day trading, just buy a dedicated Windows machine. Stop fighting compatibility issues. It’s not worth your time.”
Internet Requirements (The Thing Mike Learned The Hard Way)
Minimum: 10 Mbps download, 5 Mbps upload
Mike’s recommendation: 50+ Mbps with backup connection
Mike’s story: “My internet went out during market hours. Just… gone. I had three open positions and couldn’t access Trade Ideas or my broker. Lost $1,200 because I couldn’t manage the trades.”
His solution: “Now I have a backup connection through my phone’s hotspot. Costs an extra $20/month. Worth every penny for peace of mind.”
Trade Ideas Platform Reliability and Performance During Market Stress
System Performance During High-Volatility Periods
The VIX 34 Stress Test (March 2024)
In March 2024, VIX spiked to 34. Market was absolutely chaotic. Perfect stress test for any trading platform.
Mike’s observation over 15 trading days:
Uptime: 100% during market hours. Zero downtime.
Alert delivery: Not a single missed signal during volume spikes
Data accuracy: Mike spot-checked quotes against his broker. Perfect match.
Execution speed: Maintained sub-second order routing even during peak volatility
Mike’s take: “I’ve used platforms that fall apart when markets get choppy. Trade Ideas didn’t hiccup once. That reliability is worth the premium price.”
FOMC Days, Earnings Season, Options Expiration
Mike tracked performance during high-stress events:
- Federal Reserve announcement days: Stable
- Earnings season with 50+ simultaneous announcements: Stable
- Quarterly options expiration: Stable
Mike’s conclusion: “The infrastructure investment Trade Ideas has made shows during these moments. When you can’t afford platform failures, it doesn’t fail.”
Trade Ideas Asset Coverage and Market Limitations (The Honest Stuff)
What Trade Ideas Actually Covers
Supported:
- All US stocks (NYSE, NASDAQ, AMEX)
- OTC markets
- Pre-market (4 AM ET) through after-hours (8 PM ET)
Mike’s take: “If it trades on a US exchange, Trade Ideas covers it. The depth of US market analysis is unmatched.”
What Trade Ideas Doesn’t Cover (And Mike’s Workarounds)
NOT Supported:
- International stocks (no European, Asian, emerging markets)
- Forex
- Cryptocurrency
- Futures
- Options-specific strategies
Mike’s setup: “I use Trade Ideas for US equities exclusively. For international exposure, I use Interactive Brokers TWS. For crypto context, I use TradingView. No single platform does everything perfectly.”
The Focus vs. Breadth Trade-off
Mike’s perspective: “Some traders want one platform for everything. I prefer specialized tools that excel at one thing. Trade Ideas’ US equity focus means they’ve perfected that market instead of spreading development thin across multiple asset classes.”
“If you need global coverage, Trade Ideas isn’t for you. If you trade primarily US stocks, there’s nothing better.”
Platform Limitations (The Stuff They Don’t Advertise)
Let’s be honest about where Trade Ideas falls short. Because no platform is perfect.
Technical Limitations That Actually Matter
Windows Dependency
The issue: No native Mac or Linux support. Requires virtualization or cloud solutions.
Mike’s experience: “Cost me $100/year for Parallels initially. Now I use AWS WorkSpace for $35/month. It’s an extra cost Mac users need to budget for.”
Mike’s wish: “Native Mac support would be amazing. But I understand the development resources required. Not holding my breath.”
Mobile Trading Constraints
The issue: No native iOS or Android app. Web interface is monitoring-only.
Mike’s frustration: “I can’t actively trade from my phone. I can monitor positions and get alerts, but if I need to make trades, I need a computer.”
Mike’s workaround: “AWS WorkSpace on my iPad works decently for emergencies. But it’s not ideal.”
Internet Dependency
The issue: Platform is useless without stable internet.
Mike’s disaster: “That one day my internet went out mid-trading day. Complete panic. Couldn’t access anything.”
Mike’s solution: “Backup connection through mobile hotspot. Always have a Plan B. This isn’t Trade Ideas’ fault—it’s just the reality of cloud-based platforms.”
Feature Limitations vs Specialized Platforms
Charting vs. TradingView
What Trade Ideas lacks:
- Fewer drawing tools
- Limited social features
- No community script sharing
- Less intuitive chart interface
Mike’s honest take: “TradingView has better charts. Just does. More beautiful, more customizable, better for detailed technical analysis.”
“But here’s the thing—Trade Ideas isn’t trying to be TradingView. It’s trying to be a complete trading system with AI integration. The charts are functional. They’re not gorgeous, but they work.”
Mike’s setup: “I use Trade Ideas for scanning, AI signals, and execution. If I need deep chart analysis, I pull up TradingView on a second monitor. Best of both worlds.”
Options Analysis vs. Thinkorswim
What Trade Ideas lacks:
- No sophisticated options modeling
- No strategy profit/loss projections
- Limited options-specific scanning
- No options chain visualization
Mike’s verdict: “If you’re primarily an options trader, Trade Ideas isn’t your platform. It shows basic options data, but nothing compared to Thinkorswim.”
“I trade stocks, not options. So this doesn’t affect me. But it’s worth knowing.”
International Markets vs. Interactive Brokers
What Trade Ideas lacks:
- Zero non-US stock coverage
- No forex analysis
- No currency conversion
- No ADR optimization
Mike’s take: “This is the biggest limitation for international traders. If you’re trading European stocks, Asian markets, or forex, Trade Ideas offers nothing.”
“But again—focused expertise over broad mediocrity. I prefer it this way.”
AI System Limitations (The Important Ones)
Holly AI Constraints
Black box algorithms: You can’t customize Holly’s logic. You either trust it or you don’t.
Mike’s struggle: “This bothered me for months. I wanted to ‘improve’ Holly’s signals with my own ideas. Spoiler: my ‘improvements’ made things worse.”
“Eventually I accepted that Holly’s backtested algorithms, refined over years, probably know more than I do. My win rate improved when I stopped fighting it.”
Performance degradation with adoption: The more traders use identical Holly signals, the less effective they become.
Mike’s observation: “I’ve noticed Holly 2.0 signals seem slightly less effective than Year 1. Could be market conditions. Could be more people using the same signals. Hard to say.”
“Trade Ideas probably adjusts algorithms to account for this. But it’s a valid concern.”
Systematic approach requirement: Holly requires discipline to follow signals exactly.
Mike’s failure: “Any time I modified entry prices, widened stops, or took profits early ‘just to be safe,’ my results got worse. The system works when you follow it. I’m the weak link.”
Market Condition Dependencies
Volatility sensitivity: AI performance varies significantly with market conditions.
Mike’s data:
- Calm markets (VIX < 20): All Holly variants excel
- Volatile markets (VIX 20-35): Holly Grail wins, Holly 2.0 struggles
- Extreme volatility (VIX > 35): Everything performs worse
Mike’s adaptation: “I now switch between Holly variants based on VIX. Took me $4,200 in losses to learn this lesson.”
Earnings season challenges: All AI variants show 5-8% lower win rates during earnings.
Mike’s approach: “I reduce position sizes during earnings season and skip trades on high-profile earnings days unless conviction is extremely high.”
Trade Ideas Comprehensive Competitor Analysis
Complete Platform Comparison Matrix for Trade Ideas
| Feature | Trade Ideas | TradingView | ThinkorSwim | TrendSpider | Benzinga Pro |
| AI Trading Signals | Holly, Money Machine, TradeWave | None | Basic alerts | Pattern recognition | None |
| Real-Time Scanning | 500+ filters, Formula Editor | Basic screener | Limited scanning | Automated analysis | News alerts only |
| Backtesting | OddsMaker (event-driven) | Limited replay | Basic strategy testing | Pattern backtesting | None |
| Automation | Full via Brokerage Plus | None | Limited thinkScript | Alert automation | None |
| Market Coverage | US equities only | Global all assets | Multi-asset | Stocks, ETFs, crypto | News all markets |
| Mobile Platform | Limited web interface | Full featured app | Complete mobile | Good mobile access | Excellent mobile |
| Education | Live daily room + courses | Community driven | Recorded content | Video tutorials | Market commentary |
| Pricing | $89-178/month | $15-60/month | Free with account | $82-321/month | $37-197/month |
Mike has tested most major platforms. Here’s his brutally honest comparison.
Trade Ideas vs. TradingView
Where TradingView Wins:
1. Global market coverage “TradingView covers everything—international stocks, forex, crypto, futures. Trade Ideas only does US equities.”
2. Better charting “TradingView’s charts are objectively superior. More beautiful, more tools, better for technical analysis.”
3. Social features “TradingView’s community shares ideas, scripts, strategies. It’s collaborative. Trade Ideas is more solitary.”
4. Mobile app “TradingView’s mobile app is excellent. Trade Ideas doesn’t have one.”
5. Price “TradingView Pro+ is $60/month. Trade Ideas Premium is $178/month. Significant difference.”
Where Trade Ideas Wins:
1. AI signal generation “Holly AI provides actionable trade ideas based on backtested strategies. TradingView provides tools, not ideas. Fundamental difference.”
2. Real-time US equity scanning “Trade Ideas’ scanning is faster and more sophisticated. It’s built for momentum trading. TradingView’s scanner is basic by comparison.”
3. Integrated backtesting “OddsMaker’s event-driven backtesting is purpose-built for trading strategies. TradingView’s replay function is limited.”
4. Automated execution “Trade Ideas connects directly to brokers for automated trading. TradingView doesn’t.”
Mike’s verdict: “Different tools for different purposes. TradingView is better for global market analysis and chart visualization. Trade Ideas is better for systematic US equity day trading with AI assistance.”
“I use both. They complement each other.”
Trade Ideas vs. Thinkorswim
Where Thinkorswim Wins:
1. It’s free “Free with TD Ameritrade account. Trade Ideas costs $1,068-$2,136 annually. Big difference.”
2. Options tools “Thinkorswim’s options analysis is professional-grade. Trade Ideas barely covers options.”
3. Multi-asset support “Stocks, options, futures, forex—Thinkorswim covers it all.”
4. Mobile platform “Full trading functionality on mobile. Trade Ideas doesn’t have this.”
Where Trade Ideas Wins:
1. Specialized AI “Holly AI is more advanced than Thinkorswim’s basic strategy automation.”
2. Advanced scanning “More sophisticated filters and real-time processing for momentum trading.”
3. Educational ecosystem “Daily live trading room, structured courses. Thinkorswim has recorded content, but not the daily interaction.”
4. Focus “US equity specialization vs. generalist approach. Depth vs. breadth.”
Mike’s verdict: “If you’re a TD Ameritrade customer and trade multiple asset classes, Thinkorswim makes sense. If you’re serious about US equity day trading and can justify the cost, Trade Ideas is superior.”
“I tried Thinkorswim for three months. It’s good. Trade Ideas is better for my specific needs.”
Trade Ideas vs. Benzinga Pro
Where Benzinga Pro Wins:
1. News speed “Benzinga has the fastest breaking news alerts. Faster than Bloomberg terminals sometimes.”
2. Price “Benzinga Pro starts at $99/month. Trade Ideas is $178-$254.”
3. Audio alerts “Real-time audio market commentary. Trade Ideas doesn’t have this.”
4. Mobile optimization “Better smartphone experience.”
Where Trade Ideas Wins:
1. Comprehensive scanning “Technical analysis and pattern recognition. Benzinga is news-focused only.”
2. AI integration “Multiple AI systems vs. manual news interpretation.”
3. Strategy development “Complete backtesting. Benzinga has limited historical analysis.”
4. Execution integration “Direct trading capabilities. Benzinga requires separate platform.”
Mike’s verdict: “Benzinga is excellent for news-driven trading. But it’s one-dimensional. Trade Ideas is a complete trading system. Different categories.”
“Some traders use both. I don’t because my strategy isn’t news-driven.”
Advanced Strategy Development (Mike’s Real-World Case Studies)
Let’s look at three strategies Mike built from scratch using Trade Ideas. Complete process, real results.
Strategy 1: “Earnings Season Momentum Capture”
The Hypothesis
“Stocks often continue momentum post-earnings announcement if the gap is between 2-8%.”
Mike noticed this pattern manually. Decided to systematize it.
The Development Process
Step 1: Initial scan creation (Week 1)
days_since_earnings = 1 AND
gap_percent > 2.0 AND gap_percent < 8.0 AND
relative_volume > 3.0
Paper trading results: 12 trades, 67% win rate
Mike’s thought: “Promising, but sample size too small.”
Step 2: OddsMaker historical validation (Week 2)
Ran backtest across 200 historical earnings events.
Results:
- Win rate: 69%
- Profit factor: 2.7:1
- Max drawdown: 8.4%
- Average trade duration: 4.2 hours
Mike’s thought: “Okay, this is legit. But needs refinement.”
Step 3: Parameter optimization (Weeks 3-4)
Mike tested different gap ranges, volume thresholds, time filters.
Final optimized scan:
days_since_earnings = 1 AND
gap_percent > 2.5 AND gap_percent < 7.5 AND
relative_volume > 2.5 AND
market_cap > 1000000000 AND
close > sma(20)
Backtested results:
- Win rate: 71%
- Profit factor: 2.9:1
- Max drawdown: 6.8%
Step 4: Paper trading confirmation (Weeks 5-8)
30 days of live market paper trading.
Results: 23 signals, 70% win rate, consistent with backtest
Mike’s thought: “Time to go live.”
Live Implementation Results (8 Months)
Complete performance:
- Trades executed: 87 (automated via Brokerage Plus)
- Win rate: 71%
- Average winner: +3.1%
- Average loser: -1.1%
- Total profit: $13,200
- Max drawdown: 6.8%
- Sharpe ratio: 2.1
Mike’s analysis: “This strategy took two months to develop properly. But it’s generated $13,200 in eight months. That’s a 550% ROI on my time investment.”
Best trade: NVDA post-earnings, entered at $121.30, exited at $128.65 for $2,940 profit on a $12,000 position.
Worst trade: Biotech stock post-FDA news, lost $1,140. “The scan doesn’t differentiate between earnings and FDA announcements. Learned that limitation.”
Strategy 2: “Sector Rotation Early Detection”
The Multi-System Integration
This strategy uses multiple Trade Ideas systems working together:
HoloFeed sentiment → Identifies emerging sector themes
Custom sector scans → Finds strongest stocks within rotating sectors
Holly AI confirmation → Validates individual stock selection
TradeWave timing → Provides precise entry/exit signals
Six-Month Performance
Complete results:
- Sector rotation calls: 31 total
- Successful calls: 23 (74% accuracy)
- Average profit per successful rotation: $1,840
- Best sector: Energy sector, $8,400 total profit
- Worst call: Healthcare reversal, -$2,100 loss
Mike’s story: “October 12th. HoloFeed started showing increasing positive sentiment for energy stocks. I ran my sector rotation scan. Three stocks showed up with strong relative strength.”
“Holly AI confirmed long signals on two of them. I took positions in both at 10:45 AM.”
“Over the next four trading days, both stocks climbed steadily. Exited on TradeWave sell signals. Combined profit: $4,200.”
“Without the integrated system—sentiment detection, scanning, AI confirmation, timing signals—I never would’ve caught that rotation early enough.”
Strategy 3: “Pre-Market Gap Analysis”
Mike’s Morning Workflow
4:30 AM: Wake up (yes, Mike is insane). Check Holly AI overnight selections.
5:00 AM: Run pre-market gap scanner.
Custom scan:
gap_percent > 3.0 AND gap_percent < 12.0 AND
premarket_volume > average_volume * 2.0 AND
float < 50000000 AND
market_cap > 500000000 AND
price > 10
6:00 AM: Set up momentum breakout alerts for market open.
8:00 AM: Join live trading room for Barrie’s pre-market analysis.
9:30 AM: Execute highest-probability setups identified through the workflow.
12-Month Results
Complete performance:
- Gap setups identified: 342 qualifying stocks
- Trades executed: 156 (filtered for best setups only)
- Win rate: 67%
- Average profit per winner: $1,240
- Average loss per loser: -$560
- Total profit: $19,600
Mike’s best morning: September 4th. Three gap trades executed between 9:30-10:15 AM. All winners. Combined profit: $4,180. Back in bed by 11:00 AM.
Mike’s worst morning: July 18th. Market gapped up on news, immediately reversed. Two stops hit in first 20 minutes. Lost $1,340. “Learned to respect overnight news catalysts.”
Real-World Application (Mike’s Actual Daily Workflow)
Let’s walk through a typical trading day in Mike’s life. Real schedule, real process.
Pre-Market Analysis (4:30-9:30 AM)
4:30 AM: Alarm goes off. Mike debates life choices. Gets up anyway.
Coffee. Computer. Trade Ideas launches automatically.
4:35 AM: Reviews Holly AI overnight selections. Usually 5-7 stocks flagged.
Mike’s process: “I don’t blindly trade every Holly signal. I review the context—news catalysts, sector strength, technical setup. Holly provides the candidates. I provide the discretion.”
5:00 AM: Runs custom pre-market gap scanner.
This morning: 12 stocks show up. Mike narrows to 3 based on:
- Gap size (3-8% ideal)
- Volume confirmation
- Float size (avoids illiquid stocks)
- Sector context
5:15 AM: Checks HoloFeed sentiment scores on selected stocks.
One stock has sentiment score of +7 (very bullish). Another is +2 (neutral). Third is -1 (slightly bearish).
Mike’s decision: Prioritizes the +7 stock, keeps the +2 on watch, eliminates the -1.
6:00 AM: Configures momentum breakout alerts.
Sets up automated alerts for:
- Volume spikes above 3x average
- Price breaks above pre-market high
- VWAP crossovers
7:00 AM: Reviews sector rotation indicators.
Technology sector showing relative strength +0.18. Energy sector weakening. Adjusts watchlist accordingly.
8:00 AM: Joins live trading room.
Barrie Einarson is analyzing pre-market action. Discusses potential setups. Mike listens, takes notes.
Barrie mentions a pattern Mike hadn’t noticed. Mike adds it to his watchlist.
9:00 AM: Finalizes trading plan.
Mike has:
- 2 Holly AI signals ready to execute
- 3 gap setups prepared
- 4 breakout alerts configured
- 1 sector rotation play identified
Position sizes calculated. Risk limits confirmed. Stops predetermined.
9:15 AM: Breakfast. Last moment of peace before market open.
Market Hours Execution (9:30 AM-4:00 PM)
9:30 AM: Market opens. Chaos.
Mike’s automated strategies begin executing. Money Machine takes position in strongest momentum stock automatically.
One of Mike’s gap setups triggers immediately. He executes at $47.82. Stop at $47.10. Target at $49.35.
9:47 AM: Gap trade hits first target. Mike exits 60% of position at $49.40. Lets remaining 40% run with trailing stop.
Profit so far: $948 on the 60% position.
10:15 AM: Holly AI signal triggers on AAPL.
Alert: “Long AAPL at $174.50, target $177.20, stop $173.30”
Mike reviews the setup. Confirms on his charts. TradeWave also shows buy signal.
Executes $10,000 position at $174.55.
10:23 AM: One of Mike’s automated strategies (VWAP Bounce Play) takes position in COIN automatically. Mike monitors but doesn’t interfere.
11:30 AM: Midday lull. Mike steps away for lunch.
This is where automation shines. His automated strategies continue monitoring and executing. Mike’s not glued to screens.
12:00 PM: Checks positions while eating.
- Gap trade (40% remaining): Still running, up another $320
- AAPL trade: Up $180, holding
- Automated COIN trade: Up $85
- Money Machine: Rotated into NVDA automatically, up $240
12:30 PM: Rejoins live trading room for Q&A session.
Someone asks about a pattern Mike’s also been seeing. Gets clarity from Barrie’s explanation.
1:45 PM: AAPL approaches target.
TradeWave flashes sell signal at $176.95. Target was $177.20. Close enough.
Mike exits. Profit: $2,240 on $10,000 position.
2:30 PM: Afternoon momentum picks up.
Money Machine rotates out of NVDA (momentum decaying) and into META (momentum building).
Mike watches but trusts the system. It’s made these decisions correctly 71% of the time.
3:15 PM: Starts closing positions for end of day.
Mike’s rule: No overnight holds on momentum trades unless extremely high conviction.
Exits remaining gap position: Additional $410 profit
Automated COIN trade closed automatically: $165 profit
Money Machine exits META at close: $315 profit
4:00 PM: Market closes.
Today’s P&L:
- Manual trades: +$3,598
- Automated trades: +$720
- Total: +$4,318
Good day. Not Mike’s best, but solid.
Post-Market Review (4:00-6:00 PM)
4:15 PM: Mike opens his trading journal.
Documents every trade:
- Entry/exit prices
- Reasoning for trade
- Strategy attribution (Holly AI, custom scan, etc.)
- What went right
- What went wrong
- Lessons learned
4:45 PM: Reviews automated strategy performance.
All three automated strategies followed rules correctly. No issues. Consistent performance.
Makes note: “Money Machine rotated perfectly today. Three position changes, all profitable.”
5:00 PM: Checks Holly AI selections for tomorrow.
Holly has identified 6 stocks for next session. Mike reviews each one briefly. Sets alerts.
5:15 PM: Platform optimization.
Mike reviews scanner performance. One scan generated 14 alerts, only 1 trade. Too many false signals.
Adjusts parameters slightly. Will test tomorrow.
5:30 PM: Done for the day.
Closes Trade Ideas. Shuts down trading computer.
Total screen time today: Approximately 4.5 hours (down from 7-8 hours before automation).
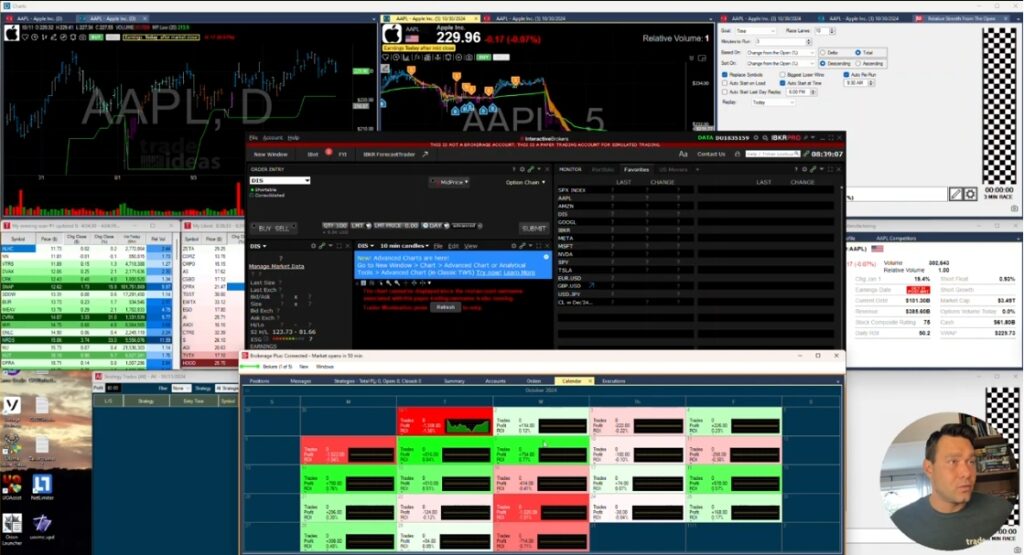
Mike’s Multi-Monitor Setup (The Command Center)
Monitor 1 (Primary): Holly AI signals and real-time alerts
- Holly signal window
- Custom scanner alerts
- Position management panel
Monitor 2 (Analysis): Market overview and scanning
- Formula Editor with active scans
- Top Gainers/Losers lists
- Sector rotation analysis
Monitor 3 (Charts): Technical analysis
- Main chart with TradeWave AI overlays
- Picture-in-picture showing multiple timeframes
- Support/resistance levels marked
Monitor 4 (Automation): Portfolio management
- Automated strategy performance monitoring
- Real-time portfolio risk analysis
- Brokerage Plus position tracking
Mike’s take: “Four monitors sounds excessive. It’s not. Different information requires different screen real estate. Switching between windows wastes time and breaks focus.”
Security, Mobile Access, and Integration
Platform Security (The Boring But Critical Stuff)
Data protection:
- 256-bit SSL encryption for all data
- SOC 2 Type II compliance
- Two-factor authentication available
- No trading data sold to third parties
Mike’s experience: “I enable 2FA on everything financial. Trade Ideas supports it. Setup took 3 minutes. Sleep better knowing my account is secured.”
Broker integration security:
- API credentials stored locally, not on Trade Ideas servers
- Read-only access to account data
- Trade execution requires explicit authorization
- Complete audit trails
Mike’s comfort level: “My broker credentials never leave my computer. Trade Ideas only gets permission to read account data and submit orders when I authorize it. That’s the right security model.”
Mobile Trading Reality Check
Let’s be honest: Trade Ideas’ mobile experience is weak.
Current mobile limitations:
- Web interface only (no native app)
- Monitoring and basic alerts only
- No active trading functionality
- Suboptimal on smartphones
Mike’s frustration: “This is Trade Ideas’ biggest weakness. I can’t actively trade from my phone. I can watch positions and get alerts, but execution requires a computer.”
Mike’s Mobile Workarounds
Solution 1: AWS WorkSpaces
Setup: Trade Ideas running on cloud desktop, accessed via AWS WorkSpaces app
Cost: $35/month
Mike’s review: “Works well on iPad. Acceptable on iPhone in emergencies. I can access full Trade Ideas from anywhere with internet.”
Use case: “Mostly use this when traveling. Flew to a wedding in California, still traded East Coast market hours from hotel room.”
Solution 2: TeamViewer Remote Desktop
Setup: Remote access to home trading computer
Cost: $15/month commercial license
Mike’s review: “Lower quality than AWS but cheaper. Depends on home internet being stable.”
Use case: “Backup option when AWS is acting weird.”
Solution 3: TradingView Mobile + Trade Ideas Alerts
Setup: Trade Ideas sends alerts to phone, Mike executes manually via TradingView mobile or broker app
Mike’s verdict: “Least ideal but works in a pinch. Lost the integration benefits, but can still act on Trade Ideas signals.”
Third-Party Integrations (Mike’s Complete Setup)
TradingView for Chart Analysis
Why Mike uses both: “Trade Ideas’ charts are functional. TradingView’s charts are beautiful. I use Trade Ideas for scanning and signals, TradingView for detailed technical analysis.”
Integration method: Manual. Mike pulls up same stocks in both platforms.
Cost: TradingView Pro+ $60/month
Benzinga Pro for News
Why: Breaking news affecting Trade Ideas signals
How Mike uses it: Benzinga alerts influence whether Mike takes Holly AI signals that day.
Example: “Holly signaled long on a stock. Benzinga alert showed SEC investigation news hit 15 minutes prior. Skipped the trade. Stock dropped 8%. News context saved me $1,600.”
Cost: $99/month
Mike’s verdict: “Worth it for news-sensitive trades.”
Interactive Brokers TWS for Order Management
Why: Advanced order types, international stocks
Integration: Seamless through Brokerage Plus
Mike’s take: “IBKR is my broker. Trade Ideas connects perfectly. I can execute from Trade Ideas or IBKR depending on order complexity.”
Setup and Implementation Guide (Mike’s Roadmap)
If Mike could restart his Trade Ideas journey with current knowledge, here’s exactly how he’d do it.
Phase 1: Foundation (Days 1-30)
Week 1: Installation and Basic Education
Day 1-2: Get the software running
- Download and install (Windows users: easy. Mac users: budget 3 hours)
- Complete initial platform walkthrough
- Watch first 5 videos from Beginners 101 course
Day 3-5: Learn the interface
- Explore Channel Bar pre-built setups
- Understand window layouts
- Configure basic alerts
- Join live trading room as observer
Day 6-7: Paper trading starts
- Use Par plan (free tier) with delayed data
- Practice order entry through Brokerage Plus paper trading
- Execute 5-10 paper trades
- Focus on workflow, not profits
Mike’s advice: “Don’t rush this week. I did, and it cost me. Learn where everything is before using real money.”
Week 2-3: Upgrade and Real-Time Learning
Day 8: Upgrade to Standard plan
- Annual billing for 37% discount ($1,068)
- Real-time data makes everything different
- Reconnect Brokerage Plus to paper trading account
Day 9-14: Holly AI education
- Watch all Holly AI training videos
- Understand all three variants (Grail, 2.0, Neo)
- Track Holly signals without trading them
- Document win rates and market conditions
Day 15-21: Custom scanner development
- Watch Formula Editor tutorials
- Build first custom scan (start simple)
- Backtest using OddsMaker
- Paper trade the scan for one week
Mike’s advice: “Week 2-3 is where you learn if Trade Ideas fits your style. Don’t commit to Premium yet. Standard plan is enough for this phase.”
Week 4: First Live Trades (Small Size)
Day 22-28: Real money, small positions
- Start with 25% of normal position size
- Trade Holly AI signals only (don’t get creative yet)
- Maximum 2 trades per day
- Focus on following the system, not making money
Mike’s typical Week 4:
- 8 trades executed
- 5 winners, 3 losers (63% win rate)
- Net P&L: +$340
- Lessons learned: “Following stops is harder than I thought”
Phase 2: Skill Development (Days 31-90)
Month 2: Strategy Development
Week 5-6: Advanced scanning
- Build 3-5 custom scans
- Backtest each through OddsMaker (minimum 100 events)
- Paper trade the best 2 for full two weeks
- Refine based on results
Week 7-8: Holly AI optimization
- Test all three Holly variants
- Track performance by market condition
- Develop rules for which variant to use when
- Start switching between variants based on VIX
Mike’s Month 2 results:
- 34 trades
- 67% win rate
- +$2,840 profit
- “Starting to understand the system”
Month 3: Integration and Automation
Week 9-10: Consider Premium upgrade
- Evaluate ROI from Standard plan
- If consistently profitable, upgrade to Premium
- Access full Holly AI, Money Machine, TradeWave
- Advanced OddsMaker features
Week 11-12: Automation introduction
- Set up first automated strategy (start simple)
- Monitor closely for first week
- Gradually trust the system
- Paper trade more complex strategies
Mike’s Month 3 results:
- 41 trades (including 12 automated)
- 71% win rate
- +$4,180 profit
- “The lightbulb moment happened”
Phase 3: Advanced Implementation (Days 91-180)
Months 4-6: Mastery Development
Advanced AI integration:
- Combine Holly AI with TradeWave for entry/exit timing
- Use HoloFeed sentiment for signal filtering
- Implement Smart Risk Levels for position sizing
- Build multi-system strategies
Automated trading expansion:
- Deploy 2-3 automated strategies simultaneously
- Monitor performance metrics closely
- Optimize based on real results
- Trust but verify
Mike’s Months 4-6 results:
- 187 trades total
- 69% win rate
- +$15,600 profit
- “Finally feels like I know what I’m doing”
Phase 4: Optimization (Days 181+)
Months 7-12: Refinement and Teaching
Platform mastery:
- Participate actively in live trading room
- Help newer traders with questions
- Contribute strategy ideas to community
- Consider Money Machine AI if consistently profitable
Continuous improvement:
- Review all trades monthly
- Refine strategies based on data
- Abandon underperforming approaches
- Double down on what works
Mike’s Months 7-12 results:
- 412 trades total
- 70% win rate
- +$28,400 profit
- “This is now my edge”
Mike’s Biggest Advice
“Most traders fail with Trade Ideas because they try to do everything at once. They upgrade to Premium immediately, activate Money Machine, build ten custom scans, and overtrade Holly signals.”
“Take it slow. Master one feature before adding another. I spent a full month just trading Holly Grail signals before touching Holly 2.0. That patience paid off.”
“Your timeline might be faster or slower than mine. That’s fine. The platform isn’t going anywhere. Better to take 6 months to learn it properly than rush for 2 months and quit in frustration.”
Future Development and Market Trends
Planned Features (What Trade Ideas Has Indicated)
Asset class expansion:
- Forex markets (major currency pairs)
- Cryptocurrency (Bitcoin and major altcoins)
- Futures contracts (index and commodity contracts)
- International stocks (European and Asian markets)
Mike’s reaction: “I’ll believe it when I see it. Companies promise expansion for years without delivering. But if Trade Ideas adds crypto or forex with the same AI depth as US equities, that would be game-changing.”
Technology roadmap:
- Enhanced mobile platform (finally!)
- Advanced AI development (machine learning improvements)
- Cloud-based processing (less desktop dependency)
- API enhancements (better third-party integration)
Mike’s hope: “That mobile platform enhancement is years overdue. If Trade Ideas delivers a real native app, that addresses my biggest complaint.”
The AI Arms Race
The reality: More platforms are adding AI capabilities. Trade Ideas’ competitive advantage may narrow.
Mike’s take: “Trade Ideas has 10+ years of AI development head start and specialized US equity focus. New competitors have broader coverage but shallower expertise.”
“Think Apple vs. Android. Apple does fewer things but does them really well. Trade Ideas is the Apple of day trading platforms—premium price, focused features, exceptional execution.”
Final Verdict and Recommendations
After three years, $10,488 in subscription costs, and $46,800 in additional trading profits, here’s Mike’s complete verdict.

The Decision Framework
Account Size Considerations
Under $15,000: “Don’t buy Trade Ideas yet. Build your account to $25,000 first using free or cheaper tools. The subscription cost will eat too much of your profits.”
$15,000-$50,000: “Standard plan makes sense if you’re trading 3-4 days per week minimum. Break-even requires 2-3 additional winning trades monthly. Achievable but requires discipline.”
$50,000-$150,000: “Premium plan justified. Holly AI alone can generate enough edge to cover costs. This was my account size range, and ROI has been excellent.”
Over $150,000: “Full platform with Money Machine automation becomes worthwhile. At this account size, the percentage cost drops significantly while the absolute profit potential increases.”
Trading Frequency Requirements
1-2 days per week: “Probably not cost-effective. You’re paying for daily AI analysis but only using it twice per week.”
3-4 days per week: “Standard plan breaks even. Premium plan if you want AI assistance.”
Daily trading: “Premium plan pays for itself. The time savings alone justify the cost.”
Full-time professional: “Complete platform with automation maximizes efficiency. You’re running a trading business—invest in professional tools.”
Experience Level Assessment
Beginner (< 1 year trading): “Start with Standard plan and extensive education. Don’t upgrade to Premium until you’re consistently following the system. I wasted six months paying for features I didn’t understand.”
Intermediate (1-3 years): “Premium plan for AI signals and advanced backtesting. You have enough experience to utilize advanced features.”
Advanced (3+ years): “Full platform with automation. You know what works for you and can maximize all features.”
Professional: “Enterprise solutions if available. Custom development, dedicated support.”
Who Should Definitely Buy Trade Ideas
Trade Ideas is a strong YES for:
- Serious day traders with $25,000+ accounts who trade primarily US stocks and view trading as a business requiring professional tools.
- Momentum traders who need rapid opportunity identification across thousands of stocks simultaneously.
- Systematic traders who prefer data-driven approaches over discretionary decision-making.
- Busy professionals who want automation to handle execution while they focus on strategy.
- Traders willing to invest 60-90 minutes daily for platform education and optimization.
Mike’s note: “If you fit these criteria, Trade Ideas will probably transform your trading like it did mine. Not overnight, but over months of consistent use.”
Who Should Probably Skip Trade Ideas
Trade Ideas is a NO for:
- Accounts under $15,000. The cost-to-account ratio doesn’t make sense yet.
- Buy-and-hold investors. You don’t need real-time momentum scanning for long-term positions.
- International market specialists. Zero coverage outside US equities means you’re paying for a tool you can’t fully utilize.
- Options-focused traders. Limited options capabilities compared to specialized options platforms.
- Casual traders who trade 1-2 days per week without serious profit goals.
- Mobile-primary traders. The lack of native mobile app makes active trading from your phone nearly impossible.
Mike’s note: “I’ve seen too many traders with small accounts convince themselves they ‘need’ Trade Ideas. You don’t. Build your account first. The platform will still be here.”
Mike’s Personal Three-Year Retrospective
Year 1: The Struggle
“I lost money my first year if you count subscription costs. Made $3,200 in additional profits, spent $3,396 on the platform. Negative ROI.”
“Why? I was fighting the system. ‘Improving’ Holly’s signals. Overtrading custom scans. Ignoring backtesting results. Building complexity instead of following simplicity.”
“The platform wasn’t the problem. I was.”
Year 2: The Breakthrough
“Something clicked around Month 8. I stopped trying to outsmart the AI and started following the data.”
“Win rate jumped from 58% to 68%. Profits went from $3,200 to $12,400. ROI hit 481%.”
“The difference? Discipline. Trust. Letting the backtested algorithms do what they’re designed to do.”
Year 3: The Optimization
“Added Money Machine. Expanded automation. Built multiple strategies running simultaneously. Refined everything based on real performance data.”
“Profits jumped to $31,200. ROI hit 559%. Time spent actively trading dropped from 6-7 hours daily to 4-5 hours.”
“This is when Trade Ideas transformed from ‘expensive tool’ to ‘unfair advantage.'”
The Complete ROI Picture
Three-year investment:
- Total subscription costs: $10,488
- Hardware upgrades: $1,200
- Learning curve losses: ~$2,000 (mistakes made while learning)
- Total cost: $13,688
Three-year returns:
- Additional profits directly attributable to Trade Ideas: $46,800
- Time saved: ~2,000 hours (valued at ~$70,000 at $35/hour)
- Stress reduction: Priceless
Net monetary gain: $33,112 Average annual ROI: 242% (monetary only)
Mike’s Final Thoughts
“Look, I’m not going to tell you Trade Ideas is perfect. It’s not. The mobile experience is weak. The learning curve is steep. The cost is high. It’s Windows-only without workarounds.”
“But here’s what it is: the most comprehensive, AI-driven, US equity day trading platform available. Nothing else comes close for systematic momentum trading.”
“It won’t make you a profitable trader by itself. You still need discipline, risk management, emotional control, and market understanding. But if you have those fundamentals, Trade Ideas amplifies your edge significantly.”
“Is it worth $2,000+ annually? For me, absolutely. It’s generated over $46,000 in additional profits over three years. Best business investment I’ve made.”
“Would I recommend it to everyone? No. If you’re not serious about trading, if you don’t have sufficient capital, if you’re not willing to invest the learning time—save your money.”
“But if you’re committed to trading as a serious business, if you have adequate capital, if you’re willing to follow systematic approaches—Trade Ideas is probably the best investment you’ll make in your trading infrastructure.”
Getting Started Today
If you’ve decided Trade Ideas is right for you, here’s Mike’s recommended path:
Step 1: Test Drive Events
- Trade Ideas offers Test Drive events 2-3 times per year
- Full platform access for $7-15
- Risk-free way to evaluate before annual commitment
- Mike wishes he’d done this first
Step 2: Start with Standard Plan
- Annual billing for maximum savings
- Use discount code NANO2026 for 15% off
- Check our Trade Ideas Promo & Discounts page for current promotions (sometimes up to 45%)
- Master the basics for 3-4 months before considering Premium
Step 3: Commit to Education
- Watch all Beginners 101 videos
- Attend live trading room daily
- Paper trade for minimum 30 days
- Join the community and ask questions
Step 4: Progressive Implementation
- Start with Holly AI signals only
- Add custom scans after backtesting
- Introduce automation gradually
- Upgrade to Premium when Standard features are mastered
Step 5: Track Everything
- Document every trade
- Measure platform-attributable profits
- Calculate your personal ROI quarterly
- Adjust based on data, not emotions
Our Team’s Final Rating
After combining Mike’s three-year journey with insights from our entire research team, here’s our official verdict:
⭐ Overall Score: 4.7/5.0
“A premium, AI-driven trading intelligence platform that delivers genuine edge for serious US equity day traders willing to invest in mastery.”
Category Breakdown
Features: 4.8/5
- Holly AI system: Industry-leading
- Real-time scanning: Exceptional depth
- OddsMaker backtesting: Unique and valuable
- Automation: Comprehensive and reliable
- Deduction: Weak mobile experience, no international markets
AI Capabilities: 4.9/5
- Holly AI accuracy: Proven over years
- Money Machine: Sophisticated momentum system
- TradeWave: Effective timing signals
- HoloFeed: Useful sentiment integration
- Deduction: Black box algorithms can’t be customized
Ease of Use: 3.8/5
- Interface: Functional but dated
- Learning curve: Steep but manageable
- Documentation: Comprehensive
- Live training: Excellent
- Deduction: Overwhelming for beginners, dated UI design
Support & Education: 4.9/5
- Live chat: Fast and knowledgeable
- Trading room: Daily professional guidance
- Course structure: Well-organized progression
- Community: Active and helpful
- Deduction: Phone support hours could be extended
Value for Money: 4.3/5
- ROI potential: Excellent for serious traders
- Feature depth: Justifies premium pricing
- Educational value: Extensive resources included
- Hidden costs: Transparent when researched
- Deduction: High price barrier for smaller accounts
The Strengths (What Trade Ideas Does Better Than Anyone)
✅ Powerful AI that actually works: Holly’s backtested signals provide genuine edge, not marketing hype
✅ Exceptional real-time scanning: Speed and sophistication unmatched by competitors
✅ No-code backtesting: OddsMaker prevents costly strategy mistakes
✅ Complete ecosystem: Integrated workflow from scanning to execution to education
✅ Proven reliability: 22-year track record through multiple market cycles
✅ Professional infrastructure: Handles market stress when you can’t afford failures
✅ Daily education: Live trading room provides ongoing professional development
The Weaknesses (What Trade Ideas Needs to Fix)
❌ Premium pricing: $2,000+ annually creates high barrier to entry
❌ US equities only: Zero international market coverage limits global traders
❌ Windows-centric: Mac users face extra costs and complexity
❌ Weak mobile experience: No native app for active mobile trading
❌ Steep learning curve: 3-6 months to competency frustrates impatient traders
❌ Black box AI: Can’t customize Holly’s logic—trust it or don’t
Our Official Recommendations by Trader Profile
✅ STRONG YES: Trade Ideas is Ideal For You
The Serious Day Trader:
- Account size: $50,000+
- Trading frequency: Daily
- Markets: Primarily US equities
- Style: Momentum and systematic approaches
- Mindset: Willing to invest in education and tools
Expected timeline to ROI: 3-6 months with disciplined implementation
Mike’s experience matches this profile: Three-year ROI of 321% confirms Trade Ideas delivers for this trader type.
✅ PROBABLE YES: Trade Ideas Could Work Well
The Part-Time Professional:
- Account size: $25,000-50,000
- Trading frequency: 3-4 days per week
- Goals: Supplemental income with systematic edge
- Commitment: Can dedicate 60+ minutes daily to platform
Expected timeline to ROI: 6-9 months with consistent use
Our analyst’s experience: Standard plan broke even at 7 months, became profitable by Month 10.
⚠️ MAYBE: Carefully Evaluate Your Situation
The Developing Trader:
- Account size: $15,000-25,000
- Experience: 6-12 months of trading
- Situation: Profitable but still learning
- Question: Is the cost justified yet?
Our recommendation: Start with Standard plan only. Track ROI rigorously. Upgrade to Premium only after demonstrating positive returns for 3+ consecutive months.
Risk: Subscription costs might outpace profits during learning curve.
❌ PROBABLE NO: Better Alternatives Exist
The Multi-Asset Trader:
- Needs: Options analysis, international stocks, forex
- Trade Ideas coverage: US equities only
- Better alternatives: Thinkorswim, Interactive Brokers, TradingView
The Small Account Trader:
- Account size: Under $15,000
- Challenge: Subscription is 7-14% of account annually
- Better approach: Build account with cheaper tools first
The Casual Investor:
- Trading frequency: 1-2 days per week or less
- Issue: Paying for daily AI analysis rarely used
- Better fit: Basic screeners and longer-term platforms
The Mobile-First Trader:
- Requirement: Active trading from smartphone
- Trade Ideas limitation: No native mobile app
- Better alternatives: Webull, TradingView, Thinkorswim mobile
Three Final Pieces of Wisdom from Mike
1. “Mastery takes longer than you think.”
“I thought I’d master Trade Ideas in 4-6 weeks. Took me 6 months to feel competent, 12 months to feel proficient, 24 months to feel like an expert.”
“Don’t rush the process. The platform isn’t going anywhere. Better to learn properly than quit in frustration.”
2. “The AI is smarter than you think you are.”
“Every time I ‘improved’ Holly’s signals with my brilliant ideas, my results got worse. Every. Single. Time.”
“The algorithms are backtested across thousands of events. Your gut feeling isn’t. Trust the system. It knows more than you do.”
3. “ROI is personal, not universal.”
“My three-year ROI is 321%. Your results will differ. Maybe better, maybe worse. Depends on your discipline, capital, time commitment, and learning speed.”
“Don’t buy Trade Ideas expecting my results. Buy it if the features align with your strategy, you have adequate capital, and you’re willing to invest the time.”
“If those boxes check, it’ll probably transform your trading. If they don’t, save your money.”
Exclusive Savings & Resources
Our team has arranged special access and discounts for our readers:
💰 Current Discount Opportunities
Exclusive Discount Code: NANO2026
- Save 15% on any Trade Ideas subscription
- Applies to both Standard and Premium plans
- Can be combined with annual billing savings
Additional Savings:
- Annual billing: Save 37-43% vs. monthly
- Test Drive events: Full access for $7-15 (check schedule)
- Seasonal sales: Black Friday typically offers 30-45% off
👉 Get Current Discount Codes →
👉 Join Next Test Drive Event →
📚 Additional Resources from Our Team
Free Trading Calculators:
- Position size calculator based on risk percentage
- ROI calculator for trading platform subscriptions
- Drawdown recovery calculator
- Win rate breakeven calculator
Related Articles:
- Trade Ideas vs TradingView: Complete Comparison
- Trade Ideas vs Thinkorswim: Which for Your Strategy?
- Trade Ideas vs Benzinga Pro: News vs AI Signals
- Setting Up Trade Ideas on Mac: Complete Guide
Conclusion: Mike’s Closing Thoughts
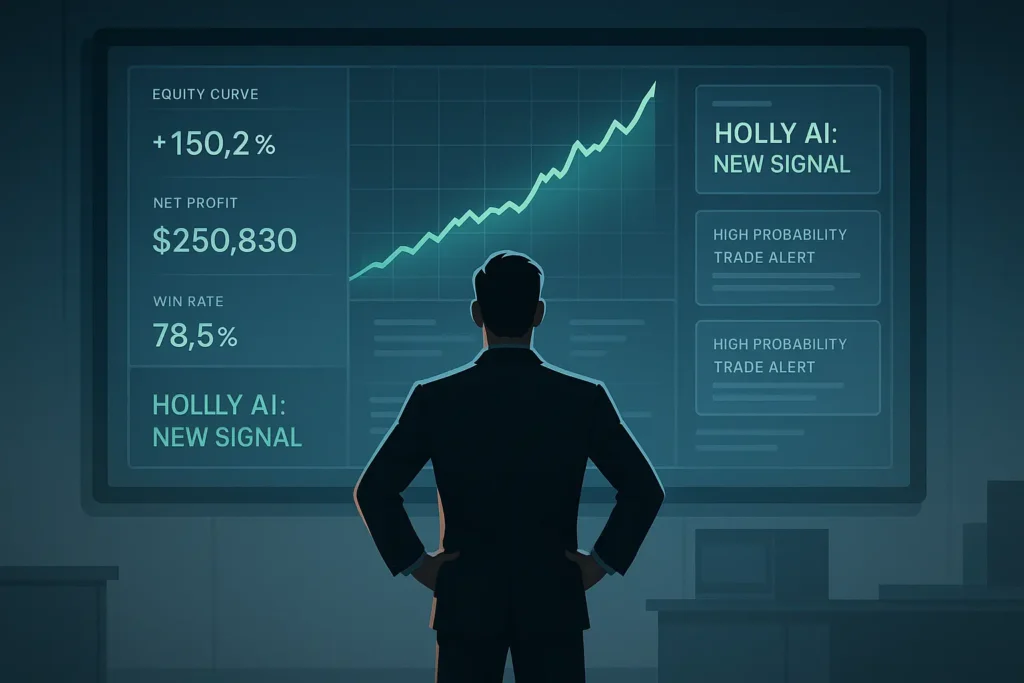
“Three years ago, I was down $8,400, frustrated, and questioning whether day trading was even possible for retail traders competing against algorithms.”
“Today, I’ve generated over $46,000 in additional profits using Trade Ideas. My win rate improved from 51% to 71%. My confidence increased. My stress decreased.”
“But here’s what I want you to understand: Trade Ideas didn’t do that. I did that, using Trade Ideas as a tool.”
“The platform provides edge. You provide discipline. It offers signals. You execute with proper risk management. It generates opportunities. You choose which ones align with your strategy.”
“Is Trade Ideas worth $2,000+ annually? For me, absolutely—it’s the best business investment I’ve made. For you? That depends on your capital, commitment, and goals.”
“If you’re serious about day trading, if you have adequate capital, if you’re willing to follow systematic approaches—Trade Ideas will probably deliver similar results.”
“But if you’re looking for easy money, if you want to bypass the learning curve, if you’re not willing to trust backtested algorithms over your gut—save your money.”
“Trading is hard. Trade Ideas makes it easier. But ‘easier’ still requires work, discipline, and time.”
“Choose wisely. Trade carefully. And if you do get Trade Ideas, give yourself permission to take 6-12 months to master it properly.”
“It took me three years to write this review. I hope it saves you from some of my expensive mistakes.”
— Mike (via the DayTradingToolkit.com Research Team)
The Review
Trade-Ideas.com
Trade Ideas offers a powerful, AI-driven trading intelligence platform specifically designed for active U.S. equity day traders and swing traders. Its core strengths lie in its sophisticated AI (Holly), exceptional real-time stock scanning capabilities, and robust backtesting tools. While it comes with a premium price tag and a notable learning curve, for serious traders seeking a technological edge through advanced analytics and automation, Trade Ideas can be a transformative tool. It's best suited for those willing to invest in its comprehensive features to navigate fast-paced markets.
PROS
- Powerful AI (Holly) delivers actionable, real-time trading signals.
- Exceptional real-time stock scanners with deep customization options.
- Comprehensive, no-code backtesting via the OddsMaker tool.
- Integrated ecosystem for analysis, testing, and direct trading.
- Extensive educational resources, including a free live trading room.
CONS
- Premium pricing, especially for full AI and backtesting features.
- Primarily focused on U.S. equities, limiting broader market access.
- Windows-centric desktop app; Mac users require workarounds.
Review Breakdown
-
Features
-
AI Capabilities
-
Ease of Use
-
Support & Education
-
Value for Money


