Open any charting platform for the first time and you’ll find a menu with 50, 80, sometimes over 100 indicators. Moving averages, RSI, MACD, Bollinger Bands, Stochastic, Ichimoku Cloud, ATR, OBV, CCI, Williams %R — the list goes on until your eyes glaze over.
Here’s what happens next. You add five or six of them to your chart. The screen turns into a rainbow of lines, histograms, and oscillators. Every candle has three arrows telling you to buy and two arrows telling you to sell. You’re more confused than when you started.
We’ve been there. Our team went through that exact phase. And the lesson we learned — the one every experienced trader eventually learns — is devastatingly simple: more indicators don’t make better decisions. In fact, they usually make worse ones.
This guide is going to take the opposite approach from most indicator tutorials. Instead of walking you through a catalog of 20 tools you’ll never use, we’re going to give you a framework for understanding what indicators actually do, then teach you the 3 indicators that will serve you best as a beginner. One for trend direction. One for momentum. One for volume confirmation. That’s it. Master these three, and you’ll have a stronger foundation than the trader with 12 indicators cluttering their screen.
What Are Trading Indicators (And What They’re NOT)
A trading indicator is a mathematical calculation applied to a stock’s price data, volume data, or both — then displayed visually on your chart to help you interpret what’s happening. That’s all it is. Math applied to price, turned into a visual tool.
Here’s the critical thing most beginners misunderstand: indicators do not predict the future. They can’t. Every single indicator is calculated from past price and volume data. They’re looking backward to help you make better forward-looking decisions — but they’re not crystal balls, and anyone who tells you an indicator “predicts” market moves is selling something.
Think of indicators like the gauges on a car’s dashboard. Your speedometer doesn’t predict where you’re going — it tells you how fast you’re currently moving. Your fuel gauge doesn’t predict when you’ll run out of gas — it tells you how much fuel is left right now. Your temperature gauge doesn’t predict an engine failure — it warns you when conditions are getting dangerous.
Trading indicators work the same way. They measure current conditions — trend direction, momentum strength, how overbought or oversold a stock might be, whether volume confirms a move — and that information helps you make better decisions about what to do next.
This distinction matters because it changes how you use indicators. You don’t blindly follow an indicator signal. You use the indicator to confirm or deny what the price action is already telling you. The candlesticks, support and resistance levels, and chart patterns you’ve learned in the previous articles? Those are your primary tools. Indicators are the secondary layer that says, “Yes, what you’re seeing is real” or “Wait — something doesn’t add up.”
The 4 Categories of Indicators Every Trader Should Know
Before you learn any specific indicator, you need the framework that prevents the #1 beginner mistake — stacking redundant indicators that all tell you the same thing.
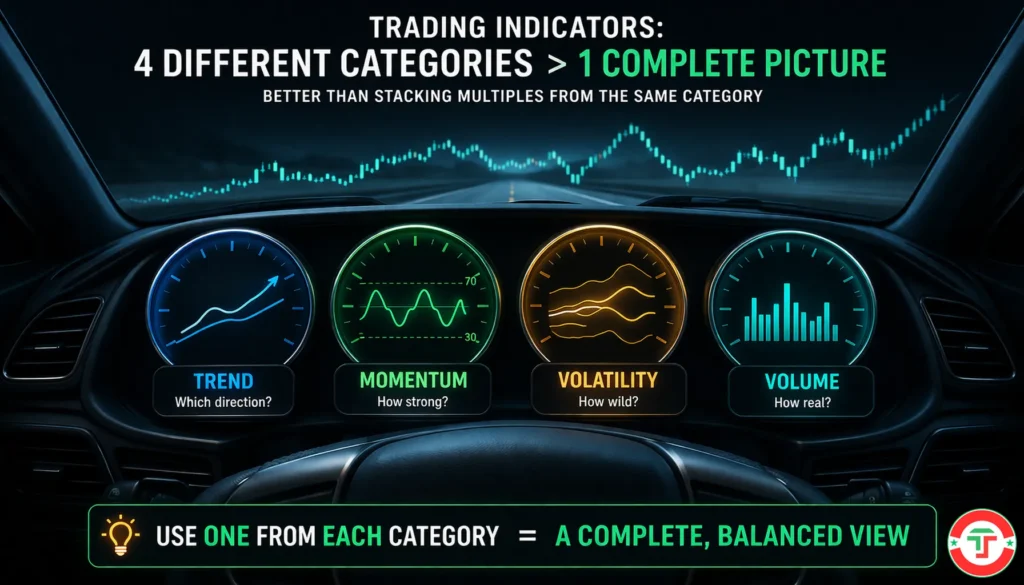
Every trading indicator falls into one of four categories. Understanding these categories is more important than memorizing any individual tool, because it teaches you why you need different types of information.
1. Trend Indicators — “Which direction is the market moving?”
These tell you whether a stock is trending up, down, or sideways. They smooth out price noise and reveal the underlying direction. Examples include moving averages (SMA, EMA), MACD, and the ADX.
Trend indicators are lagging — they confirm a trend after it’s started, not before. That’s not a weakness. It’s their job. You want a trend indicator to tell you “yes, this stock is in an uptrend” so you can trade in the right direction.
2. Momentum Indicators — “How strong is the move, and is it running out of gas?”
These measure the speed and strength of price movement. They help you gauge whether a trend is gaining power or losing it, and whether a stock might be due for a reversal. Examples include the RSI, Stochastic Oscillator, and Williams %R.
Momentum indicators are generally leading — they try to signal potential reversals before they happen. The trade-off is more false signals. In strong trends, momentum indicators can stay “overbought” or “oversold” for extended periods without the price reversing.
3. Volatility Indicators — “How wild are the price swings right now?”
These measure how much a stock’s price is fluctuating. High volatility means big, fast moves. Low volatility means quiet, narrow ranges. Examples include Bollinger Bands and the Average True Range (ATR).
Volatility indicators help you calibrate your expectations and position sizing. A stock with high volatility needs wider stop-losses. A stock with narrowing volatility (like a Bollinger Band “squeeze”) might be coiling for a big breakout.
4. Volume Indicators — “Is there real participation behind this move?”
These measure how much trading activity accompanies a price move. Volume is the market’s conviction meter. A breakout on heavy volume is trustworthy. A breakout on thin volume is suspicious. Examples include simple volume bars, On-Balance Volume (OBV), and the Volume Weighted Average Price (VWAP).
The golden rule: Pick one indicator from each category that’s relevant to your trading. Using two trend indicators (like two different moving averages AND MACD) adds very little value because they’re measuring the same thing — trend direction — using similar math. That redundancy creates the illusion of “confirmation” when really you’re just getting the same signal twice with different packaging.
Leading vs. Lagging Indicators: Your Windshield and Rearview Mirror
This concept trips up beginners, but it’s simpler than it sounds.
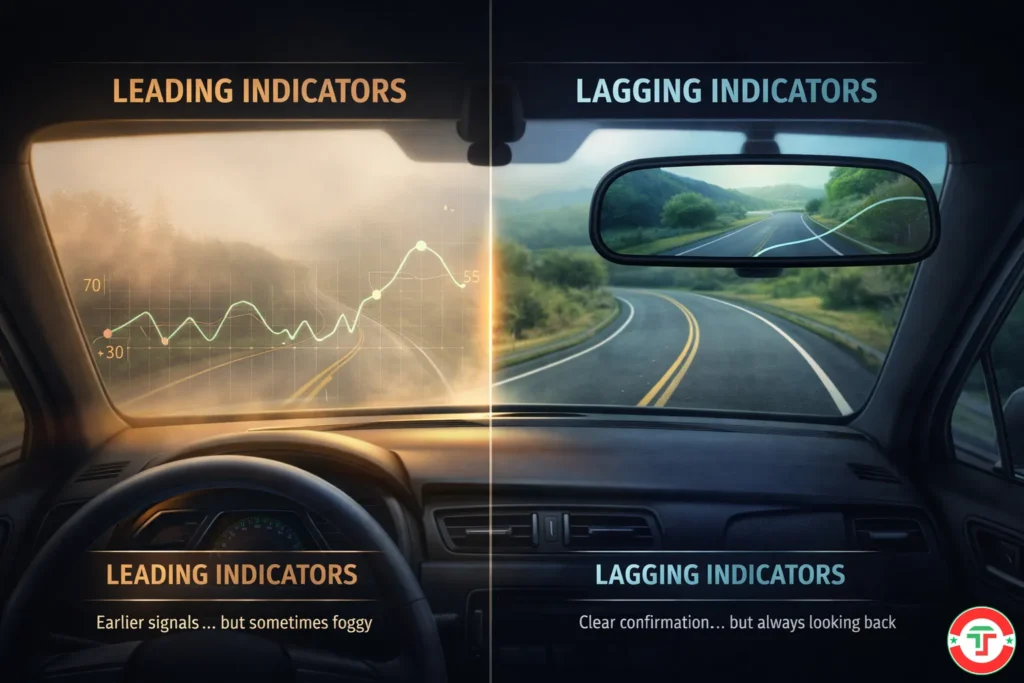
Lagging indicators follow the price. They react to what has already happened. Moving averages are the classic example — they smooth past prices, so by definition they trail behind the current price. Lagging indicators are great at confirming trends, but they’re slow. By the time a lagging indicator tells you a trend has started, you’ve already missed the first part of the move.
Think of lagging indicators as your rearview mirror. They show you where the market has been.
Leading indicators try to anticipate what might happen next. The RSI, for instance, can signal “overbought” before a reversal actually occurs. Leading indicators give you earlier signals — but those early signals come with a cost: more false alarms. A stock can stay “overbought” for days or even weeks in a strong trend without reversing.
Think of leading indicators as your windshield. They try to show you what’s ahead — but sometimes the windshield is fogged up.
Here’s the practical takeaway: you need both. A lagging indicator (like a moving average) confirms the trend direction. A leading indicator (like RSI) warns you when that trend might be getting stretched. Together, they give you a more complete picture than either one alone.
The best trading decisions happen when a lagging indicator says “the trend is up” AND a leading indicator says “the trend still has room to run.” The worst happen when you rely on just one type — either getting in too late (lagging only) or getting faked out too often (leading only).
Moving Averages: Your First Trend Indicator
If you learn only one indicator, make it the moving average. It’s the simplest, most widely used indicator in trading, and it forms the mathematical backbone of many other indicators — including MACD and Bollinger Bands. Master the moving average and you’ll understand the DNA of technical analysis.
What a moving average does: It calculates the average price of a stock over a specific number of periods and plots that average as a smooth line on your chart. As new price data comes in, the oldest data drops off and the average updates. The result is a line that “moves” with price, smoothing out the noise and revealing the underlying trend direction.
SMA vs. EMA — The Two Types You Need to Know
A Simple Moving Average (SMA) gives equal weight to every price in the calculation period. A 20-period SMA adds up the last 20 closing prices and divides by 20. Clean, straightforward, slow to react.
An Exponential Moving Average (EMA) gives more weight to recent prices, making it react faster to new price action. A 20-period EMA still looks at 20 periods, but the most recent closes influence the average more than older ones.
Which is better? Neither — they serve different purposes. EMAs react faster, which is useful for day trading where speed matters. SMAs are smoother and less prone to whipsaws, which is useful for identifying stronger, more established trends. Many day traders use EMAs for short-term signals and SMAs for longer-term context.
The 4 Moving Averages That Matter
You don’t need 15 different moving averages. These four cover everything a day trader needs:
The 9 EMA is the fast, short-term moving average. It hugs price action tightly and reacts quickly. Day traders use it to gauge immediate momentum — if price is above the 9 EMA, buyers have short-term control. If below, sellers do.
The 20 EMA is the most popular short-term trend filter. It represents roughly a month of trading data and smooths out the noise better than the 9 EMA. Many day traders use the 20 EMA as their primary trend reference — trading long only when price is above it and short only when below.
The 50 SMA is the medium-term trend. It represents roughly a quarter of trading. When the price is above the 50 SMA on the daily chart, the intermediate trend is considered bullish. Institutional traders watch this level.
The 200 SMA is the long-term trend — the big picture. It represents roughly a year of trading data. The 200 SMA on a daily chart is one of the most widely watched levels in all of finance. When a stock is above its 200 SMA, the long-term trend is bullish. When below, it’s bearish. You’ve probably heard of the “golden cross” (when the 50 SMA crosses above the 200 SMA — bullish signal) and the “death cross” (the reverse — bearish signal). Those signals make financial news headlines because so many traders and algorithms watch them.
How Day Traders Actually Use Moving Averages
Moving averages serve two practical purposes on a day trading chart:
Trend direction filter: If price is above the 9 and 20 EMA on your intraday chart, the short-term trend is up — look for long (buy) setups. If below both, the trend is down — look for shorts or stay out. This one filter eliminates a huge number of bad trades that go against the trend.
Dynamic support and resistance: Moving averages often act as “moving floors and ceilings.” In an uptrend, price frequently pulls back to the 9 or 20 EMA, bounces off it, and resumes higher. That EMA acts as dynamic support. In a downtrend, rallies often stall at the 9 or 20 EMA — dynamic resistance. This connects directly to the support and resistance concepts from our previous guide.
We go much deeper into moving average strategies — including the difference between using EMAs vs. SMAs for day trading — in our dedicated Moving Averages for Day Trading guide later in this series.
RSI: Your First Momentum Indicator
The Relative Strength Index — RSI — was created by J. Welles Wilder in 1978, and nearly five decades later it’s still one of the most widely used momentum indicators in the world. There’s a reason for that longevity: it’s simple, effective, and versatile.
What RSI does: RSI measures the speed and magnitude of recent price changes on a scale of 0 to 100. It answers the question: “How strong is the current move relative to recent moves?” When RSI is high, price has been rising aggressively. When RSI is low, price has been falling aggressively.
The standard settings: RSI uses a 14-period lookback by default. On a 5-minute chart, that’s the last 70 minutes of data. On a daily chart, it’s the last 14 trading days.
How to Read RSI — The Basics
The two levels every beginner needs to know:
RSI above 70 = “Overbought.” The stock has risen fast relative to recent history. It might be due for a pullback or pause. But — and this is critical — overbought does NOT mean “sell immediately.” In a strong uptrend, RSI can stay above 70 for days. Overbought simply means “momentum is stretched.” It’s a yellow caution light, not a red stop sign.
RSI below 30 = “Oversold.” The stock has fallen fast. It might be due for a bounce. Same caveat: oversold does not mean “buy immediately.” In a brutal downtrend, RSI can camp below 30 for a long time.
The 50-Line — The Underrated Signal
Most beginners fixate on the 70 and 30 levels, but the 50 midline is arguably more useful for day trading. Here’s why:
When RSI is above 50, average gains outpace average losses — buyers have the edge. When RSI is below 50, the opposite is true — sellers have the edge. This simple filter aligns you with the dominant side. If RSI is above 50 and you’re looking for long trades, momentum confirms your bias. If RSI is below 50 and you’re considering a long trade, momentum is working against you.
Using the 50-line as a trend filter is less glamorous than catching “oversold bounces,” but it’s more consistently useful — especially for beginners.
What RSI Does NOT Tell You
RSI doesn’t tell you how far price will move. An RSI at 75 doesn’t mean the stock will drop 5%. It tells you momentum is stretched, but the stock could rally another 10% before pulling back. RSI is a momentum thermometer — it tells you the temperature, not the forecast.
RSI also doesn’t work well in isolation. A stock showing RSI oversold at 25 near a strong support level on the daily chart? That’s a compelling setup — multiple signals aligning. RSI oversold on a stock in freefall with no support in sight? That’s a knife you don’t want to catch.
We cover RSI in much greater depth — including divergence strategies, advanced settings, and combining RSI with other tools — in our RSI, MACD & Bollinger Bands guide later in this series.
Volume: Your First Confirmation Tool
Volume is the most underappreciated indicator in a beginner’s toolkit. Most new traders obsess over price indicators and completely ignore volume — which is like watching a football game with the sound off. You can see the plays, but you miss the crowd reaction that tells you how significant each one is.
What volume measures: Volume counts the number of shares (or contracts) traded during a specific time period. Each bar on a volume chart represents one candle’s worth of trading activity. Tall volume bars = heavy participation. Short volume bars = light participation.
Why Volume Matters
Volume is the market’s conviction meter. It tells you whether a price move has real muscle behind it or whether it’s just a few traders pushing price around in thin conditions.
High volume on an up move = lots of buyers stepping in aggressively. This suggests the move is supported by real demand and is more likely to continue.
High volume on a down move = lots of sellers dumping shares. This confirms selling pressure is real and the decline has conviction.
Low volume on any move = the move lacks participation. Price might be drifting higher or lower, but without conviction behind it. Low-volume moves are more likely to reverse or fizzle out.
Volume confirms breakouts. Remember our chart patterns discussion? A bull flag breakout on high volume is trustworthy. The same breakout on low volume? Suspicious. Volume is the “lie detector” we talked about in the chart patterns guide — and it applies to every single setup you’ll ever trade.
How to Read Volume Bars
Most charting platforms display volume bars directly below the price chart. Green (or hollow) bars typically appear when the candle closes higher than it opened. Red (or filled) bars appear when the candle closes lower. The height of the bar tells you how many shares traded.
Here’s what to look for:
Volume spikes: A sudden bar that’s 2–3 times taller than the surrounding bars signals something significant happening. An institution might be buying or selling. News might have hit. Whatever the cause, a volume spike at a key level — support, resistance, or a chart pattern breakout — demands your attention.
Declining volume in a trend: If a stock is trending higher but volume is gradually declining, the trend may be running out of buyers. This divergence between price (rising) and volume (falling) is a warning sign.
Volume confirming a trend: Healthy trends show volume increasing on moves in the trend’s direction and decreasing on pullbacks. In an uptrend, volume should be highest on the green candles and lower on the red ones. That tells you buyers are more aggressive than sellers.
We cover volume analysis — including On-Balance Volume, relative volume, and advanced confirmation techniques — in much more depth in our Liquidity and Volume guide and our Volume Analysis guide.
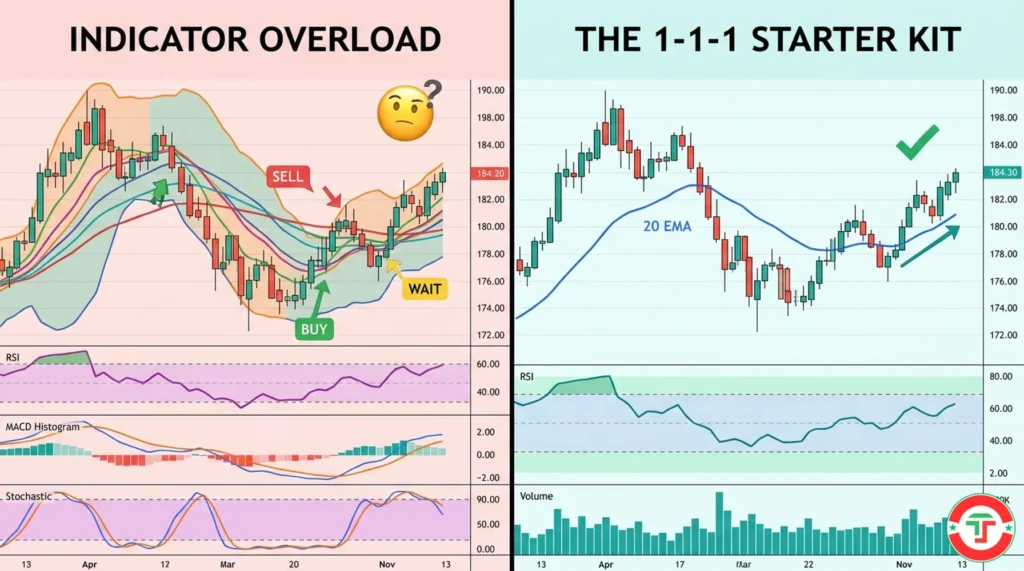
The “1-1-1 Starter Kit” — How to Combine Indicators Without Overload
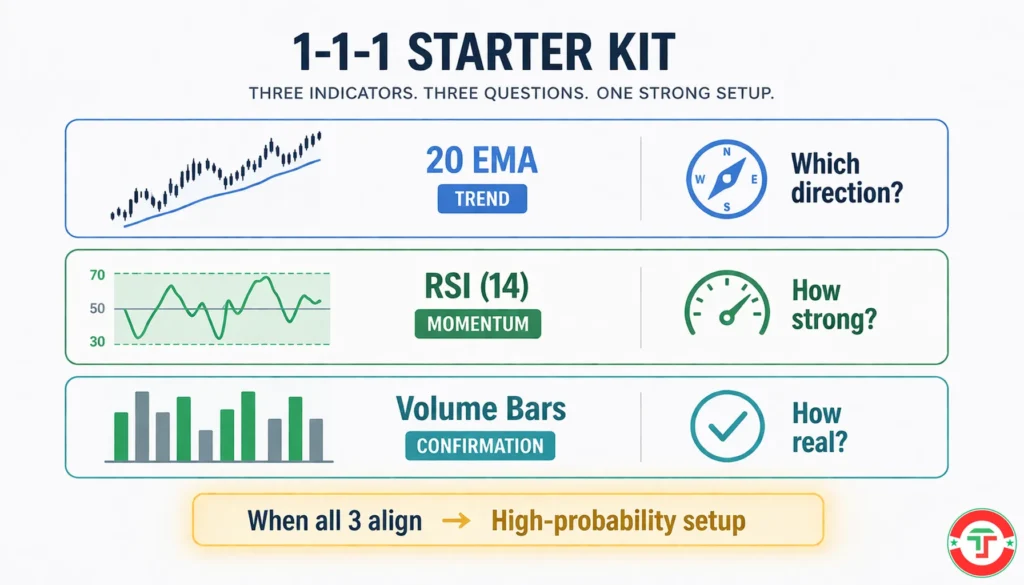
Here’s our concrete recommendation for beginners. We call it the 1-1-1 Starter Kit: one trend indicator, one momentum indicator, one volume tool.
Your starter setup:
- 20 EMA (trend) — plotted on your price chart as a line overlay
- RSI (14-period) (momentum) — displayed in a panel below your price chart
- Volume bars (confirmation) — displayed below the RSI panel
That’s three tools. Three different categories. Three different types of information. And together they answer the three most important questions:
- “What direction is the trend?” → Look at price relative to the 20 EMA. Above = bullish bias. Below = bearish bias.
- “Does momentum support this move?” → Check RSI. Above 50 = buyers have momentum. Overbought (70+) = might be stretched. Below 50 = sellers have momentum. Oversold (30-) = might bounce.
- “Is there real conviction behind this move?” → Check volume. High volume = move is real. Low volume = move is suspect.
When all three align — price above the 20 EMA, RSI above 50, and volume expanding on the move — you have a high-probability setup. When they conflict — price breaking out above resistance but RSI is declining and volume is weak — something doesn’t add up, and you should be cautious.
This framework isn’t fancy. It won’t win any awards for complexity. But it works, and it gives you a structured way to analyze any chart in under 30 seconds. As you gain experience, you can add tools — VWAP (which we cover in our VWAP guide), Bollinger Bands, MACD — but always from a foundation of understanding why you’re adding them and what new information they provide.
You’ll need a charting platform that supports these indicators — virtually all of them do, even the free versions. We compare the best options in our Day Trading Toolkit.
The #1 Indicator Mistake: Why More Lines Means Worse Decisions
We’ve hinted at this throughout the article, but it deserves its own section because it’s that common and that damaging: indicator overload.
Here’s how it typically plays out. A beginner reads five articles about indicators. Each one recommends a “must-use” tool. So the beginner adds all five to their chart: two moving averages, RSI, MACD, Bollinger Bands. Now their chart is a mess of overlapping lines, colored bands, and histogram bars. They think they’re being thorough. In reality, they’ve created analysis paralysis.
Why redundancy hurts:
Adding the MACD and two moving averages to the same chart doesn’t give you three independent opinions. MACD is calculated from moving averages — it’s literally the difference between a 12 EMA and a 26 EMA. So you’re getting the same signal (trend direction) from the same underlying math, displayed three different ways. That feels like “confirmation,” but it’s actually redundancy.
Real confirmation comes from different categories of information agreeing — a trend indicator, a momentum indicator, and volume all pointing the same direction. That’s three independent perspectives. Three different moving averages pointing the same direction? That’s one perspective wearing three hats.
The “dashboard” mindset:
Think of your chart like a car dashboard. You need a speedometer (trend), a tachometer (momentum), a fuel gauge (volume), and maybe a temperature gauge (volatility). You don’t need four speedometers. Four speedometers won’t help you drive better — but they will clutter your view and distract you from the road.
Start lean. The 1-1-1 Starter Kit is all you need. Add tools only when you can articulate exactly what new information the tool provides that your current setup doesn’t already give you. If you can’t answer that question clearly, don’t add it.
When experienced traders add indicators:
Advanced traders do use more tools, but they add them with surgical precision. A scalper might add VWAP because institutional algorithms use it — that’s genuinely new information. A breakout trader might add Bollinger Bands because the “squeeze” pattern helps identify low-volatility compression — also new information. Each addition solves a specific problem. None are added “just because.”
You’ll get there. For now, three indicators and clean charts.
What’s Next in Your Day Trading Journey
You now have the core visual literacy of a day trader: candlestick reading, support and resistance, chart patterns, and basic indicators. These four skills work together as a system — each one adding a layer of context to the others. The next step is understanding the fuel that powers every price move: liquidity and volume. Without understanding why some stocks move fast on heavy volume while others chop around in thin conditions, you’ll keep wondering why the same pattern works on one stock and fails on another.
→ Next Article: What is Liquidity and Volume? Why They Matter to Day Traders
Frequently Asked Questions
What are the best trading indicators for beginners?
Quick Answer: Moving averages (specifically the 20 EMA), RSI (14-period), and basic volume bars are the three best starting indicators for beginner day traders.
These three cover the three most important dimensions of market analysis: trend direction, momentum strength, and participation conviction. They’re simple to understand, available on every charting platform, and widely used by professional traders. Most importantly, they come from different indicator categories — so they provide genuinely independent information rather than redundant signals. Start with these three, learn them deeply, and resist the temptation to add more until you can clearly articulate what new information an additional indicator would provide.
Key Takeaway: Three indicators from three different categories will outperform ten indicators from the same category every time.
What’s the difference between leading and lagging indicators?
Quick Answer: Lagging indicators confirm trends after they start (like moving averages). Leading indicators try to signal reversals before they happen (like RSI). You need both for a complete picture.
Lagging indicators follow price action — they smooth past data and tell you what the trend is. They’re reliable but slow, meaning you’ll always enter a trend after it’s already begun. Leading indicators try to anticipate future moves — they signal overbought or oversold conditions before a reversal occurs. They’re faster but produce more false alarms. The best approach combines one of each: a lagging indicator to confirm the trend direction and a leading indicator to gauge whether that trend is stretched or still has room.
Key Takeaway: Use lagging indicators to confirm the direction you should trade, and leading indicators to time your entries and watch for warning signs.
How many indicators should I use at once?
Quick Answer: Start with 3 — one trend indicator, one momentum indicator, and one volume tool. Adding more than that as a beginner typically hurts more than it helps.
The biggest mistake new traders make is stacking indicators that measure the same thing. Two moving averages plus MACD is really just three versions of the same trend signal. Real confirmation requires indicators from different categories — trend, momentum, and volume — agreeing with each other. Start with three tools that provide genuinely different information, and only add more when you can clearly explain what new insight the addition brings.
Key Takeaway: Clean charts lead to clear decisions. Three carefully chosen indicators beat ten overlapping ones.
What’s the difference between SMA and EMA?
Quick Answer: A Simple Moving Average (SMA) gives equal weight to all prices in the period. An Exponential Moving Average (EMA) gives more weight to recent prices, making it react faster to new price action.
EMAs respond more quickly to price changes, which makes them popular among day traders who need timely signals. SMAs are smoother and less susceptible to whipsaws, making them better for identifying more established, reliable trends. Many day traders use EMAs for short-term analysis (9 EMA, 20 EMA on intraday charts) and SMAs for longer-term context (50 SMA, 200 SMA on daily charts). Neither is universally “better” — they serve different purposes within a complete toolkit.
Key Takeaway: Use EMAs for fast, responsive signals on intraday charts and SMAs for smoother, more reliable trend identification on daily charts.
What does RSI overbought or oversold actually mean?
Quick Answer: RSI above 70 means the stock has risen sharply relative to recent history and might be due for a pullback. RSI below 30 means it’s fallen sharply and might bounce. Neither is an automatic buy or sell signal.
This is one of the most common misunderstandings in trading. “Overbought” does not mean “overpriced” or “about to crash.” It means momentum is stretched. In a strong uptrend, a stock can stay overbought for days or weeks while continuing to climb. Treating RSI 70 as an automatic sell signal in a strong trend will have you selling winners too early. The correct use of overbought/oversold readings is as context — a caution flag, not a trading trigger — combined with price action and support/resistance analysis.
Key Takeaway: Overbought means “stretched,” not “sell.” Oversold means “compressed,” not “buy.” Always combine RSI with price action context before making a trading decision.
Why is volume so important for day traders?
Quick Answer: Volume tells you whether a price move has real conviction behind it. A move on high volume is driven by genuine buying or selling pressure. A move on low volume lacks participation and is more likely to fail.
Volume is the difference between a real breakout and a fake-out. When a stock breaks above resistance on volume that’s 2–3 times the average, that’s thousands of traders simultaneously deciding the breakout is real — and their orders fuel further price movement. When the same breakout happens on weak volume, it means very few traders are participating, and the move is likely to stall or reverse. For a deeper understanding, see our guides on liquidity and volume and volume analysis.
Key Takeaway: Never trust a price move — whether it’s a breakout, a reversal, or a new trend — without checking whether volume supports it.
Can indicators work on any timeframe?
Quick Answer: Yes — indicators work on every timeframe from 1-minute to monthly charts because the underlying math is the same. However, signals on higher timeframes are generally more reliable and carry more weight.
A 20 EMA on a 5-minute chart and a 20 EMA on a daily chart both calculate the average of the last 20 candle closes. The difference is that the daily chart’s 20 EMA represents 20 trading days of data — a much larger sample with more significance. RSI overbought on a daily chart is a stronger signal than RSI overbought on a 1-minute chart. For day trading, use your indicators primarily on 1-minute to 15-minute charts for entries and timing, but always check the daily chart for bigger-picture context.
Key Takeaway: Indicators work on all timeframes, but always check higher timeframes for context — a 5-minute signal that aligns with a daily trend is much more powerful than one that contradicts it.
Do professional traders actually use indicators?
Quick Answer: Yes — but differently than most beginners expect. Professionals use indicators as one layer within a broader system that includes price action, order flow, market structure, and risk management.
Professional traders rarely rely on indicators alone. They use them to confirm what they’re already seeing in the price action — not as standalone trading signals. A professional might use a moving average to quickly confirm trend direction and RSI to gauge how stretched a move is, but the actual trading decision comes from the combination of price action, chart patterns, support/resistance, volume, and the broader market context. Indicators are supporting actors, not the lead.
Key Takeaway: Professionals use indicators as confirmation tools within a complete system — not as the system itself. Build your skills in price action first, then layer indicators on top.
What’s the biggest mistake beginners make with indicators?
Quick Answer: Treating indicators as magic formulas that tell you when to buy and sell — and adding too many of them, creating analysis paralysis instead of clarity.
Two mistakes dominate. First, using indicators as standalone trading signals instead of confirmation tools. “RSI says oversold, so I’ll buy” without checking the trend, support levels, volume, or broader context is gambling with an indicator’s name on it. Second, indicator overload — adding five or six tools that all measure the same thing, creating a cluttered chart that generates conflicting signals and makes decisive action nearly impossible. Both mistakes stem from the same root: expecting indicators to do the thinking for you.
Key Takeaway: Indicators support your analysis — they don’t replace it. Keep your chart clean, use tools from different categories, and always combine indicator signals with price action context.
Should I change indicator settings from the defaults?
Quick Answer: Not as a beginner. Default settings (RSI 14, 20 EMA, 50 SMA, 200 SMA) are popular because they work well and because thousands of other traders use them — which makes the signals more meaningful.
Indicator settings are somewhat self-fulfilling: when thousands of traders watch the 200 SMA, they all react when price touches it, which makes the 200 SMA more significant than, say, a 193 SMA that nobody watches. Custom settings can be useful for advanced traders with specific strategies, but as a beginner, default settings ensure you’re watching the same levels as the majority of the market. Once you have months of screen time and a clear reason to change a setting — backed by your own observations, not a random YouTube video — then experiment.
Key Takeaway: Stick with default settings while you’re learning. The power of standard settings comes partly from the fact that everyone else is watching them too.
Disclaimer
The information provided in this article is for educational purposes only and should not be considered financial advice. Day trading involves substantial risk and is not suitable for every investor. Past performance is not indicative of future results.
For our complete disclaimer, please visit: https://daytradingtoolkit.com/disclaimer/
Article Sources
Our team cross-references multiple authoritative sources to ensure every claim in this guide is accurate. Below are the primary sources that informed this article.
- StockCharts ChartSchool: Introduction to Technical Indicators and Oscillators — Comprehensive educational resource covering the distinction between leading and lagging indicators, oscillator mechanics, and overlay indicators.
- Investopedia: Technical Indicators — Industry-standard definitions and educational content on indicator categories, applications, and limitations.
- Fidelity Learning Center: Technical Analysis Indicators — Professional brokerage educational resources covering moving averages, RSI, and other common indicators with practical examples.
- BabyPips School of Pipsology: Leading vs. Lagging Indicators — Accessible beginner education on the distinction between leading and lagging indicators with clear trading applications.
- Wilder, J. Welles — New Concepts in Technical Trading Systems (1978) — The original source for the Relative Strength Index (RSI), still the foundational reference for momentum oscillator design nearly five decades later.


