
Every chart you’ve ever looked at is telling the same story. Price goes up, hits an invisible ceiling, and falls back down. Price goes down, hits an invisible floor, and bounces back up.
Those “invisible” ceilings and floors? They’re not invisible at all. They’re support and resistance levels — and learning to see them is one of the most important skills you’ll develop as a day trader. Not because they’re magic lines that predict the future, but because thousands of other traders are watching the exact same levels you are. When everyone sees the same floor, everyone puts their buy orders near that floor. And that collective behavior is what makes it real.
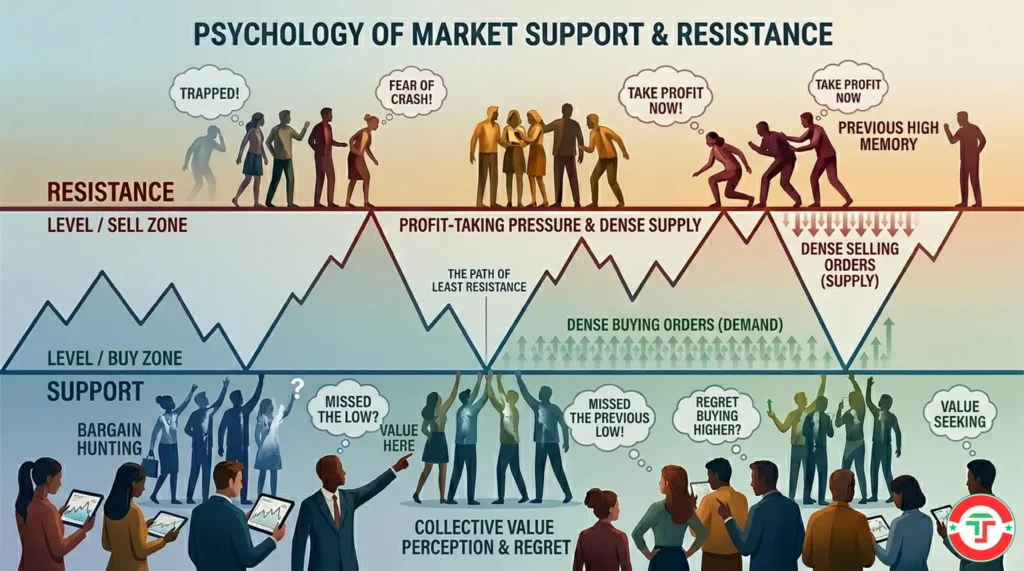
Here’s the thing most guides won’t tell you: support and resistance aren’t about the chart. They’re about human psychology — fear, regret, greed, and the very human tendency to anchor decisions to past prices. Once you understand why these levels form, spotting them becomes almost second nature.
We’ve seen traders overcomplicate this with dozens of indicators and lines drawn everywhere. That’s a trap. By the end of this guide, you’ll understand what support and resistance really are, why they work, how to find them on any chart, and — just as importantly — the mistakes that trip up almost every beginner.
What Are Support and Resistance Levels?
Support and resistance levels are specific price areas on a chart where the direction of price tends to pause, stall, or reverse. That’s the textbook answer. But here’s a better way to think about it.
Support is a price level where a falling stock tends to stop falling. Think of it as a floor. When price drops to this level, enough buyers step in — they see a bargain, essentially — and their collective buying pressure pushes the price back up. Support is always below the current price.
Resistance is the opposite. It’s a price level where a rising stock tends to stop rising. Think of it as a ceiling. When price climbs to this level, enough sellers decide “that’s high enough for me” and their collective selling pressure pushes the price back down. Resistance is always above the current price.
Here’s a real-world analogy that makes this click instantly.
Imagine you’re at an auction for a vintage guitar. Bidding starts at $500 and climbs quickly. At $800, several bidders drop out — they’ve hit their personal ceiling. At $900, only two bidders remain. At $950, the last competitor gives up. That $950 price? That’s resistance. Nobody was willing to pay more.
Now imagine that same guitar goes up for auction again the following week. What do you think happens when bidding approaches $950? Buyers get nervous. They remember what happened last time. Some drop out early. That previous high becomes a psychological barrier — a resistance level — even though nothing about the guitar has changed.
That’s exactly what happens in the stock market, thousands of times per day.
The key insight — and this is what separates traders who understand markets from those who don’t — is that support and resistance levels aren’t created by the chart. They’re created by people. Real humans making real decisions about when to buy and when to sell, all anchored to prices they remember from the past.
Why Do Support and Resistance Levels Form?
This is the question most beginner guides skip entirely. They show you lines on a chart and say “here’s support, here’s resistance” without ever explaining the mechanics underneath. But if you understand the why, the how becomes almost obvious.
Support and resistance levels form because of three forces working together: supply and demand economics, market psychology, and the self-fulfilling prophecy effect.
Supply and Demand — The Engine
Every price on a stock chart represents a balance between buyers (demand) and sellers (supply). When there are more buyers than sellers at a given price, the price rises. When sellers overwhelm buyers, the price falls. Simple enough.
Support forms at a price where demand concentrates. Maybe the stock fell to $25 three times over the past month, and each time, buyers flooded in because they considered $25 a great value. That buying pressure — that concentration of demand — creates a floor.
Resistance forms where supply concentrates. If the stock rallied to $35 twice and sellers dumped shares both times, that selling pressure creates a ceiling.
Market Psychology — The Real Driver
Here’s where it gets fascinating. Fidelity’s research on market psychology behind support and resistance identifies several emotional forces at work.
Imagine you bought a stock at $50. It rises to $55 and you’re happy — you wish you’d bought more at $50. What happens if the stock pulls back to $50 again? You buy more. So does everyone else who had the same experience. That collective “I’m buying more at $50” mentality is what creates support.
Now flip it. You own the stock at $50. It rises to $55, but you don’t sell — you’re greedy, you want more. The stock drops back to $50. Then it rises to $55 again. This time, you sell. So does everyone else who felt the regret of not selling the first time. That collective “I’m not making that mistake again” mentality is what creates resistance at $55.
These aren’t theoretical scenarios. They’re happening constantly, with thousands of traders, at every significant price level. Fear of loss, regret over missed opportunities, the hope of getting a better price — these emotions cluster around specific price points and make those points significant.
The Self-Fulfilling Prophecy
Here’s the part that surprises most beginners: support and resistance levels work, in part, because so many people believe they work.
When enough traders identify $50 as support, they all set buy orders near $50. Those clustered orders actually create the buying pressure that makes the price bounce. The level becomes real because traders collectively made it real.
This isn’t some fringe theory. Carol Osler’s study from the Federal Reserve Bank of New York examined actual support and resistance levels provided by six foreign exchange firms and found statistically significant evidence that these levels predict intraday trend interruptions. In other words — the levels work. Not perfectly, not every time, but enough to be a meaningful edge.
Round numbers amplify this effect dramatically. Think about it: if a stock is approaching $100, how many traders have their buy orders set at exactly $100? How many have stop-losses triggered at $100? How many are watching that number simply because it’s a round number that’s easy to remember? This is why levels like $10, $25, $50, $100, and $200 tend to act as natural support or resistance — they’re psychological magnets.
How to Identify Support and Resistance on a Chart
Now for the practical part. You understand what these levels are and why they form. Here’s how to actually find them on a chart. We’ll keep this simple — no fancy indicators needed, just your eyes and a charting platform.
Step 1: Zoom Out First
Before looking for anything, zoom out. If you’re a day trader using 5-minute charts, start by pulling up the daily chart. Why? Because levels that formed on higher timeframes — daily, weekly — carry more weight than levels on a 5-minute chart. More traders see them, more orders cluster around them, and they’re harder to break through.
Start on the daily chart. Identify the major levels there. Then zoom into your intraday chart and add the shorter-term levels. This top-down approach prevents you from getting lost in noise.
Step 2: Look for Repeated Bounces
Scan the chart for price areas where the stock reversed direction — not once, but multiple times. You’re looking for places where price fell, stopped, and bounced back up (support) or rose, stopped, and fell back down (resistance).
The more times price has bounced off a level, the more significant it becomes. A level that’s been tested three or four times carries more weight than one tested only once.
Step 3: Mark Previous Swing Highs and Swing Lows
A swing high is a price peak — the highest point before the stock reversed downward. A swing low is the opposite — the lowest point before price reversed upward. These swing points are your primary building blocks for support and resistance.
On a daily chart, identify the most prominent swing highs and lows from the past few months. On an intraday chart, focus on the day’s highs and lows, plus the previous day’s high, low, and close. These prior-day levels are particularly powerful for day traders because institutional algorithms often reference them.
Step 4: Draw Zones, Not Lines
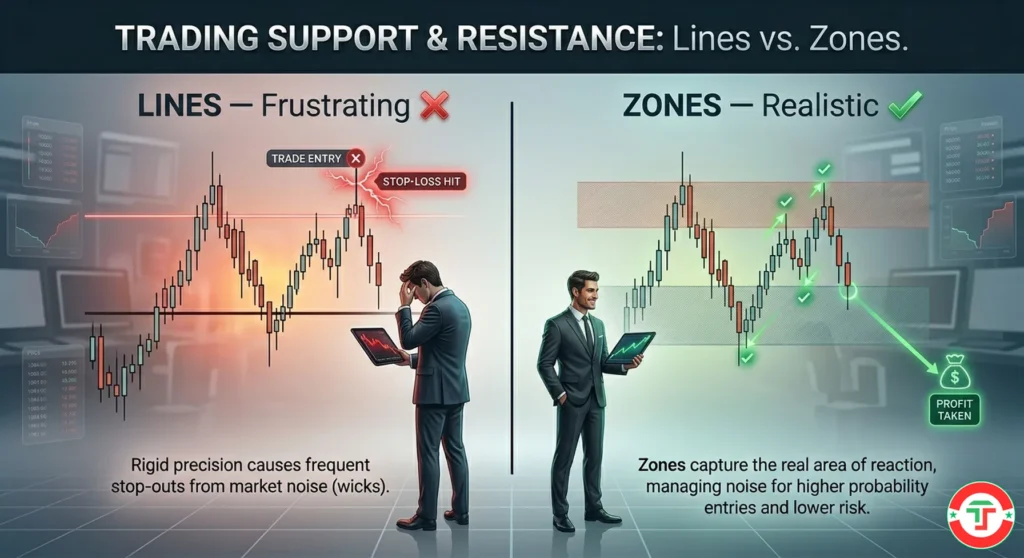
This is critical and we can’t stress it enough: support and resistance are zones, not exact price lines.
New traders love drawing a thin horizontal line at an exact price and then getting frustrated when the stock overshoots by 15 cents before reversing. That’s because markets are messy. Support at “$25” might really mean a zone between $24.85 and $25.15. Price will sometimes poke through the zone slightly — what traders call a “wick” or “fake-out” — before reversing.
Draw a narrow band or rectangle on your chart instead of a single line. This small shift in thinking eliminates a huge amount of frustration.
Step 5: Look for Confluence
The strongest support and resistance levels are ones where multiple signals overlap. If a horizontal support level at $50 also happens to coincide with a rising trendline and a key moving average — that’s confluence. Three reasons to believe $50 will hold versus just one. Confluence levels tend to produce the most reliable reactions.
A Quick Note on Tools
You’ll need a charting platform that lets you draw horizontal lines, trendlines, and rectangles on your charts. Most platforms offer these basic drawing tools for free. We compare the best options — including TradingView and other popular platforms — in our Day Trading Toolkit.
Types of Support and Resistance Every Day Trader Should Know
Not all support and resistance is created equal. There are several types, and understanding the differences helps you know which levels to prioritize.
Horizontal Support and Resistance
This is the most common and most important type. Horizontal levels are flat, straight lines drawn across the chart at specific price points where the stock has repeatedly bounced or reversed. If a stock has bounced off $42 three times, you draw a horizontal line (or zone) at $42.
Horizontal levels are powerful because they’re easy for every trader to see — regardless of what indicators or timeframes they use. The more visible a level is, the more traders act on it, and the stronger it becomes.
Trendline Support and Resistance
Unlike horizontal levels, trendlines are diagonal. In an uptrend, draw a line connecting two or more rising swing lows — that line acts as dynamic support. The stock “rides” this trendline upward, bouncing off it each time it pulls back. In a downtrend, connect two or more falling swing highs to create a trendline that acts as resistance, capping rallies.
Trendlines are useful, but they’re more subjective than horizontal levels. Two traders can draw the same trendline slightly differently and get different results. Start with horizontal levels — they’re the foundation. Add trendlines once you’re comfortable.
Dynamic Support and Resistance (Moving Averages)
Moving averages — particularly the 9 EMA, 20 EMA, 50 SMA, and 200 SMA — often act as support or resistance that moves with the price. When a stock is trending above its 20 EMA, price often bounces off that moving average on pullbacks. When a stock falls below its 200 SMA, that average can become a ceiling that blocks rallies.
We cover moving averages in depth in our Introduction to Basic Indicators guide. For now, just know that these indicators create “moving floors and ceilings” that many institutional traders watch.
Psychological Levels (Round Numbers)
As we discussed earlier, round numbers like $10, $25, $50, $100, and $200 carry outsized psychological importance. Traders cluster their orders around these numbers. Algorithms reference them. News headlines use them. When a stock approaches a major round number, expect it to act as support or resistance — even if no historical bounces have occurred there.
A stock that’s never traded above $100 before will often struggle to break through that level the first time. Not because of any technical reason, but because sellers pile in at round numbers.
Previous Day’s High, Low, and Close
For day traders specifically, yesterday’s high, low, and closing price are some of the most important support and resistance levels you’ll use daily. These levels represent the extremes and settlement of the most recent full trading session. Professional traders and algorithms reference them heavily.
If a stock opens above yesterday’s high, that old high often becomes support. If it opens below yesterday’s low, that old low often becomes resistance. Add these three levels to your chart every morning before the market opens. It takes 30 seconds and gives you an immediate framework for the day.
The Role Reversal Rule: When Support Becomes Resistance (and Vice Versa)
This is one of the most powerful concepts in all of technical analysis, and it trips up beginners constantly. Here’s the principle:
When a support level breaks, it becomes the new resistance. When a resistance level breaks, it becomes the new support.
Read that again. It’s that important.
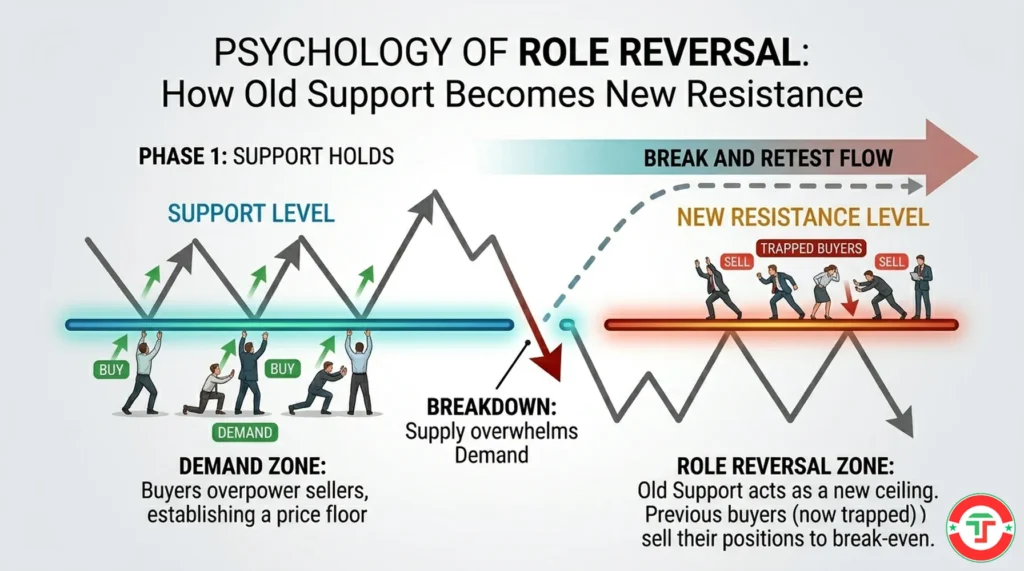
Think of it like this: imagine a building with two floors. You’re standing on the second floor — the floor beneath your feet is support. If that floor collapses and you fall through, what’s above you now? That same floor — except now it’s the ceiling (resistance) above your head. The physical structure hasn’t changed. Your position relative to it has.
In market terms, here’s why this happens. Say a stock has support at $50. Lots of traders bought at $50, expecting a bounce. But this time, the stock breaks below $50 and falls to $45. Now all those traders who bought at $50 are sitting on losses. They’re frustrated. They’re hoping the stock climbs back to $50 so they can sell and get out at breakeven. What happens when price eventually rallies back to $50? Those trapped traders sell — and their selling creates resistance at the very level that used to be support.
This polarity flip — as experienced traders call it — is one of the most reliable and actionable patterns in the market. When you see a former support level get broken, mark it. When price comes back to retest that level from below, expect selling pressure. The reverse is equally true: a broken resistance level that gets retested from above often holds as new support.
Understanding role reversal gives you a massive advantage when planning trades. It helps you anticipate where price is likely to react after a breakout — and that’s when many of the best day trading opportunities occur.
What Makes a Support or Resistance Level Strong?
Not all levels are equal. Some hold like a brick wall. Others crumble on the first test. Here’s how to evaluate which levels deserve your attention.
Number of Touches
A level that’s been tested and held four or five times is generally stronger than one tested only once. Each successful bounce reinforces the level in traders’ minds and attracts more orders for the next test.
That said — and this is a nuance most guides miss — there’s a limit. A level tested too many times (seven, eight, or more) can eventually weaken. Each test absorbs some of the buy or sell orders clustered there. Think of it like a wall being hit by a battering ram. It holds for the first few hits, but each impact weakens it slightly. Eventually, it breaks.
Timeframe
A support level visible on the weekly chart is far stronger than one visible only on a 5-minute chart. Why? More traders see it, more capital is staked on it, and it took more buying or selling pressure to create it. When day trading, always check the daily chart first for the “big” levels. Then use your intraday chart for finer-grained levels.
Volume at the Level
If a level was established during a high-volume session, it carries more weight than one formed during a low-volume, quiet day. High volume means more traders participated in creating that level — more orders were filled, more traders have a stake in that price.
Recency
More recent levels tend to be more relevant than ancient ones. A support level from last week matters more than one from six months ago, because more current traders remember it and have active positions tied to it. That said, long-term levels (especially on the weekly or monthly chart) can remain significant for years.
Confluence with Other Signals
As we mentioned earlier, a level that aligns with multiple technical signals — a horizontal level, a moving average, a trendline, and a round number all converging at $50 — is significantly stronger than a level supported by just one signal. When multiple reasons exist for a level to hold, the probability increases.
5 Common Support and Resistance Mistakes Beginners Make
We’ve watched new traders make these same errors over and over. Every single one is avoidable.
Mistake #1: Drawing Too Many Levels
This is the most common mistake, and it’s devastating. You open your charting platform, start drawing lines, and 15 minutes later your chart looks like a spider web. Every possible level is marked. The result? You can’t see the forest for the trees. Every price movement hits “a level,” which means none of them are useful.
The fix: Limit yourself to 3–5 key levels on any given chart. If a level isn’t obvious — if you have to squint and argue with yourself about whether it’s real — it probably isn’t significant enough to mark. The best levels jump off the chart.
Mistake #2: Treating Levels as Exact Prices
Price doesn’t bounce off $50.00 with surgical precision. It bounces off the area around $50 — maybe $49.85 one time, $50.12 the next. Traders who draw a single thin line and expect perfection either miss trades (because price reversed 10 cents before their line) or take unnecessary losses (because price briefly spiked through their line before reversing).
The fix: Think in zones. Draw narrow rectangular bands instead of single lines. Give the market room to breathe.
Mistake #3: Ignoring Higher Timeframes
A support level on your 1-minute chart might feel important in the moment, but a resistance level on the daily chart will steamroll right through it. Traders who only look at their intraday chart miss the bigger structural levels that actually drive large moves.
The fix: Always check the daily chart first. Mark the major levels there. Then zoom into your trading timeframe and add any significant intraday levels. If a level on your 5-minute chart conflicts with a level on the daily chart, the daily chart wins.
Mistake #4: Assuming a Level Will Hold Forever
Support and resistance levels are probable reaction zones, not guarantees. They hold until they don’t. Every level eventually breaks — that’s how trends continue and new price ranges form. Traders who treat levels as certainties end up holding losing positions far too long, hoping for a bounce that never comes.
The fix: Always have a plan for what happens if the level breaks. This means using stop-loss orders — which we cover thoroughly in our What is a Stop-Loss Order guide. Think in probabilities, not certainties.
Mistake #5: Not Watching How Price Approaches a Level
It matters how the stock arrives at a support or resistance level. A slow, grinding move into a level on decreasing volume is very different from a sharp, high-volume plunge into the same level. The speed, volume, and candlestick patterns at the moment of contact tell you a lot about whether the level is likely to hold or break.
Our guide to reading candlestick charts covers how to interpret the price action at these critical moments. The chart pattern as price touches a level is often more important than the level itself.
How Day Traders Use Support and Resistance Levels
You understand the theory. You know how to find the levels. Now — so what? What do you actually do with this information? Here’s how day traders apply support and resistance to real trading decisions.
Planning Entries
Day traders look for opportunities to buy near support and sell (or short) near resistance. The logic is straightforward: if a level has held multiple times, the probability of another bounce is high. Buying near support gives you a natural place for a stop-loss (just below the level) and a clear target (the next resistance above).
This doesn’t mean blindly buying every time price touches support. You need confirmation — a candlestick reversal pattern, an increase in volume, some evidence that buyers are actually stepping in. Support tells you where to look. Price action tells you whether to act.
Setting Stop-Losses
Support and resistance levels provide logical placement for stop-loss orders — the protective orders that limit your loss if a trade goes wrong. If you buy near support at $50, a stop-loss just below that support zone (say, $49.70) makes sense. If support breaks, your assumption was wrong, and the stop gets you out before the damage grows.
Position sizing — calculating exactly how many shares to buy based on your stop-loss distance — turns this framework into precise dollar amounts. We cover that math in our Position Sizing for Beginners guide.
Identifying Breakout Opportunities
When price breaks through a resistance level — especially on high volume — it often signals the start of a new move higher. Breakout traders watch for these moments specifically. The key is confirming the breakout is real and not a fake-out. Volume is usually your best confirmation tool; we’ll cover this in depth in our Liquidity and Volume guide.
Creating a Framework for the Entire Day
Many professional day traders start each morning by marking the key support and resistance levels on their primary chart: the previous day’s high, low, and close; any significant horizontal levels; and any major round numbers nearby. This takes maybe two or three minutes. But it creates a roadmap for the entire session — you know in advance where price is likely to react, which removes a huge amount of guesswork.
That daily level-marking routine is essentially a simplified version of building a daily watchlist and game plan. As you progress through this series, you’ll layer additional tools — volume analysis, indicators, and eventually full strategies — onto this support and resistance foundation. But the foundation always comes first.
A Word of Caution
Support and resistance levels are powerful tools, but they’re not crystal balls. They work most of the time, not all of the time. Even the strongest level will eventually break. The goal isn’t to predict the market perfectly — it’s to trade on the side of probability and manage your risk when you’re wrong. That distinction is what separates traders who survive from those who blow up their accounts.
Risk management isn’t optional — it’s the #1 survival skill in day trading. Our Introduction to Risk Management guide covers this in depth, and it’s arguably the most important article in this entire series.
What’s Next in Your Day Trading Journey
Now that you can read candlesticks and identify the key support and resistance levels where price is likely to react, the next step is recognizing the patterns that form between those levels. Chart patterns like triangles, flags, and double tops are essentially support and resistance in motion — and they signal what’s likely to happen next.
→ Next Article: Simple Chart Patterns Every Beginner Should Recognize
Frequently Asked Questions
What is the simplest way to find support and resistance levels?
Quick Answer: Look for price areas where the stock has reversed direction at least two or three times — those repeated bounces mark your support and resistance zones.
The simplest approach requires no indicators at all. Pull up a chart, zoom out slightly, and scan for obvious areas where price has reversed multiple times. Those “turning points” are your levels. Mark the swing highs (peaks) and swing lows (valleys) that jump off the chart most clearly. If you have to squint or debate whether a level is real, it probably isn’t significant enough to trade. Start with 3–5 obvious levels and build from there.
Key Takeaway: The best support and resistance levels are obvious to anyone looking at the chart — if you have to hunt for them, they’re probably not strong enough to matter.
Do support and resistance levels actually work?
Quick Answer: Yes — research from the Federal Reserve Bank of New York found statistical evidence that support and resistance levels predict intraday trend reversals. But they’re probabilities, not certainties.
Carol Osler’s study examined actual support and resistance levels from six foreign exchange firms and confirmed that these levels help predict intraday trend interruptions. The reason they work is rooted in collective behavior: when enough traders watch the same level and place orders near it, those clustered orders create the very buying or selling pressure that makes the level hold. That said, no level holds forever. Markets evolve, and levels that worked yesterday can fail today if conditions change.
Key Takeaway: Support and resistance levels have a real statistical edge, but they must always be combined with proper risk management — never bet the farm on any single level holding.
What is the difference between support and resistance zones vs. lines?
Quick Answer: A line is a single exact price; a zone is a narrow band or area around that price — and zones are far more accurate for real-world trading.
Price almost never bounces off an exact penny. It bounces off an area — maybe a 20–50 cent range depending on the stock’s price and volatility. Drawing a thin line sets you up for frustration because you’ll constantly see price “overshoot” or “undershoot” by a small amount. Drawing a zone (a narrow rectangle on your chart) accounts for this natural messiness and gives you a much more realistic framework.
Key Takeaway: Always think in zones, not lines — this one shift eliminates a huge amount of frustration for new traders.
What happens when a support level breaks?
Quick Answer: A broken support level typically becomes the new resistance level — this is called the “role reversal” or “polarity flip” principle.
When support breaks, it means the buyers who were defending that level have been overwhelmed by sellers. The traders who bought at that support level are now holding losing positions. When price eventually rallies back to that old support level, those trapped traders often sell to breakeven — and that selling pressure turns the former support into new resistance. This principle works in reverse, too: broken resistance often becomes new support.
Key Takeaway: When a level breaks, don’t erase it from your chart — mark it as a new potential level in the opposite direction and watch for the retest.
How many support and resistance levels should I draw on a chart?
Quick Answer: Keep it to 3–5 key levels for any given chart — enough to create a useful framework, few enough to keep your chart clean and actionable.
One of the most common beginner mistakes is drawing every possible level, which turns the chart into a maze. Focus on the most obvious, most tested, and most recent levels. If you’re day trading, your primary levels should include the previous day’s high and low, plus 1–3 significant horizontal levels visible on the daily chart. Add intraday levels only if they’re clearly significant.
Key Takeaway: Less is more — a few strong levels give you a clear trading framework, while too many levels create paralysis and confusion.
Do round numbers really act as support and resistance?
Quick Answer: Yes — round numbers like $10, $50, $100, and $200 consistently act as psychological support and resistance because traders naturally cluster their orders around them.
This phenomenon exists because human beings gravitate toward round numbers. Retail traders set their stop-losses and profit targets at round numbers. Algorithms reference them. News headlines highlight them (“Stock XYZ breaks $100 for the first time!”). The result is a measurable concentration of buy and sell orders at these levels, which creates real support or resistance — even if no historical bounce has occurred at that exact price before.
Key Takeaway: Always be aware of major round numbers near the current price — they’ll often cause hesitation or reversal even without any other technical reason.
How do I know if a support or resistance level is strong or weak?
Quick Answer: Strong levels show multiple touches, appear on higher timeframes, were created during high-volume sessions, and align with other technical signals (confluence).
Evaluate a level’s strength using these factors: how many times has it been tested and held (2–5 successful tests is strong), which timeframe it’s visible on (daily/weekly > 5-minute), how much volume was present when it formed, and whether it aligns with other indicators like moving averages or round numbers. A level that scores high on multiple criteria deserves more weight in your analysis.
Key Takeaway: Not all levels are equal — prioritize the ones with the most confirming evidence and allocate your attention accordingly.
Should I use support and resistance alone, or combine it with other tools?
Quick Answer: Always combine support and resistance with other tools — particularly volume analysis, candlestick patterns, and at least one or two indicators for confirmation.
Support and resistance tells you where to look for a potential trade setup. But you need additional confirmation to decide whether to actually take the trade. Volume tells you if enough participation backs the move. Candlestick patterns — covered in our candlestick charts guide — show you how buyers and sellers are behaving at that level. Indicators like VWAP or moving averages add another layer of evidence. The more confirmations you stack, the higher your probability.
Key Takeaway: Support and resistance is the foundation, but it works best as part of a toolkit — not as a standalone decision-maker.
What’s the difference between support/resistance and supply/demand zones?
Quick Answer: They’re closely related concepts — support/resistance focuses on specific price levels based on past bounces, while supply/demand zones focus on broader areas where large institutional orders created imbalances.
Support and resistance is the simpler, more accessible version of the concept. You find levels where price historically reversed and draw a line or zone. Supply and demand analysis goes deeper — it looks for the origin of sharp moves, where institutional buying or selling created an imbalance that hasn’t been fully absorbed. For beginners, support and resistance provides everything you need. Supply and demand is a more advanced refinement you can explore later as your skills develop.
Key Takeaway: Start with support and resistance — it’s simpler, widely used, and perfectly effective for beginning day traders. Supply and demand is a natural next step once you’ve mastered the basics.
Can support and resistance levels be used for any market, or just stocks?
Quick Answer: Support and resistance works on virtually every traded market — stocks, forex, futures, crypto, commodities — because it’s based on universal human psychology, not any feature specific to one market.
The principles of support and resistance are rooted in how humans make buying and selling decisions. Those psychological patterns — anchoring to past prices, clustering orders at round numbers, the regret/relief cycle — are present everywhere humans trade. Whether you’re looking at Apple stock, the EUR/USD currency pair, Bitcoin, or gold futures, the same concepts apply. The specific levels will differ, but the mechanics are identical.
Key Takeaway: Learn support and resistance once, and you can apply it to any market you ever trade — it’s truly universal.
Disclaimer
The information provided in this article is for educational purposes only and should not be considered financial advice. Day trading involves substantial risk and is not suitable for every investor. Past performance is not indicative of future results.
For our complete disclaimer, please visit: https://daytradingtoolkit.com/disclaimer/
Article Sources
Our team builds every article on a foundation of authoritative research and verified data. Below are the primary sources that informed this guide to support and resistance levels.
- Fidelity Learning Center: Support and Resistance — Comprehensive overview of support and resistance psychology from one of the largest U.S. brokerages.
- Investopedia: Support and Resistance Basics — Industry-standard definitions and explanations of S/R concepts including role reversal and round number psychology.
- Osler, C. (2000): “Support for Resistance: Technical Analysis and Intraday Exchange Rates” — Federal Reserve Bank of New York research paper providing statistical evidence for the predictive power of support and resistance levels.
- Britannica Money: Support and Resistance in Stock Prices — Clear beginner-friendly explanation of S/R as psychological price floors and ceilings.
- StockCharts ChartSchool: Support and Resistance — Technical analysis education from a widely-used charting platform, covering level identification methods.
- BabyPips School of Pipsology: Support and Resistance — Accessible beginner guide covering bounce and break strategies at key levels.


