

DayTradingToolkit
  • Home
  • Learn
    • Beginner’s Guide
    • Psychology & Risk
    • Strategies
  • Reviews & Comparisons
  • Blog
  • Trading ToolkitMust Check
DayTradingToolkit — Day Trading Education & Tools
  • Home
  • Learn
    • Beginner’s Guide
    • Psychology & Risk
    • Strategies
  • Reviews & Comparisons
  • Blog
  • Trading ToolkitMust Check
DayTradingToolkit — Day Trading Education & Tools
No Result
View All Result

Home » Reviews

TrendSpider Review 2026: The Brutally Honest Truth About Every Feature

Kazi Mezanur Rahman by Kazi Mezanur Rahman
May 14, 2026
in Reviews
Reading Time: 45 mins read
A A
TrendSpider Review 2026

Our team has been holding off on rewriting this TrendSpider review for one specific reason: the platform that older reviews described in 2024 isn’t the same platform you’re signing up for today. Half the features they graded it on have been overhauled, replaced, or absorbed into something bigger. The pricing structure is completely different. There’s an entire AI agent layer that didn’t meaningfully exist eighteen months ago. And the “TrendSpider can’t execute trades” complaint? That’s not really true anymore either.

So we wiped the slate. This is a from-scratch TrendSpider review based on the current 2026 platform — every plan, every tool, every limitation. We’re going to walk through what TrendSpider actually does in 2026, what the four new pricing tiers really get you, where Sidekick AI fits in, how backtesting and Strategy Bots tie together with broker integration, and — most importantly — whether the price tag is justified for your specific trading style.

If you’ve read older TrendSpider reviews (including our own previous one), set them aside. They’re describing a different product.


Quick Verdict — Score: 4.5/5 TrendSpider in 2026 is one of the most complete automated technical-analysis platforms in the category, with depth that goes well beyond charting into AI-assisted research, no-code backtesting, machine learning models, and webhook-driven execution. It’s not cheap, and the learning curve is real. But for systematic swing and intraday traders willing to put in the first two weeks of setup, the time saved is substantial. TrendSpider can help traders make their research, scanning, testing, alerts, and automation workflows more structured and repeatable. It does not guarantee trading results, and users should validate any strategy before risking capital.


Want to see the platform for yourself before reading the rest? Use coupon code START5 to get a 14-day full-access trial for just $5 (any plan). Plus, you’ll get 25% off your subscription for the next 12 months. — start your TrendSpider trial here and read the rest at your own pace.

What TrendSpider Actually Is in 2026

TrendSpider is a cloud-based, all-in-one market research and trading platform built around one organizing idea: automate every part of technical analysis that doesn’t require human judgment, so traders can spend their time on the part that does. That’s the elevator pitch. But describing it as a “charting platform” or — worse — “a scanner” sells the 2026 version short.

A more honest description: TrendSpider is a single workspace that combines real-time charting (with automatically drawn trendlines, Fibonacci levels, and support/resistance zones), a market scanner that accepts plain-English prompts, a no-code backtesting engine, a machine-learning lab for training custom signal models, a fleet of strategy bots that can route orders to your broker via webhook, and an AI assistant called Sidekick that can do most of the above for you from a chat box. It covers US equities and ETFs (NYSE, NASDAQ, AMEX), US options (OPRA, CBOE), US futures (CME Group, ICE — including NYMEX, COMEX, CBOT), OTC and pink sheets, plus global forex, cryptocurrency, and major global indices. TrendSpider includes broad real-time market data access, with some data depending on user status, asset class, and exchange requirements. Non-pro users should review the pricing and market data pages for current futures, OPRA options, OTC, index, and professional data fees.

One scope note worth flagging up front: TrendSpider is purpose-built for US-listed instruments plus major global macro data. Single-stock coverage on international exchanges like NSE India, LSE, TSX, and HKEX is not currently supported. If your workflow depends on trading individual stocks on those exchanges, this is a hard constraint.

That’s a lot. And it’s worth pausing on, because most platforms in this category pick a lane. TradingView is best-in-class for manual charting and community indicators. Trade Ideas is best-in-class for real-time idea discovery. Finviz is best-in-class for screening and overview. TrendSpider is trying — and as of 2026, largely succeeding — to be competitive in all of those lanes simultaneously, while adding automation and AI layers the others don’t have.

The platform is built for systematic traders — people who want rules, data, and repeatability instead of gut calls. If you’re a discretionary tape reader who lives off Level 2 and order flow at the millisecond level, this isn’t your tool. But if you’re a swing trader, an intraday rules-based trader, a strategy developer, or an active retail investor who wants to test ideas before risking capital on them, TrendSpider is a genuine candidate for the center of your workflow.

What’s New in 2026 (and Why the Old Reviews Are Wrong)

Three changes since our previous review fundamentally alter the value proposition, and any TrendSpider review written before mid-2025 will get them wrong:

1. The plan structure was rebuilt. TrendSpider used to sell Essential / Elite / Master plans. Those are gone. The current lineup is four tiers — Standard, Premium, Enhanced, and Advanced — plus a separate Business plan for teams. Every plan now includes full feature access; what changes between tiers is capacity (number of bots, alerts, workspaces, backtest depth, and lowest scanning timeframe). We’ll break the full pricing table down further down the article.

2. Sidekick AI was added. Sidekick is an agentic AI assistant — not a chatbot bolted on for marketing — that lives inside your TrendSpider workspace. It can read your open chart and annotate it, write custom JavaScript indicators from plain-English prompts, build and run scans, manage watchlists, and configure alerts across symbols. Under the hood it’s powered by frontier models from Anthropic (Claude), Google (Gemini), and OpenAI (ChatGPT), with Claude Sonnet as the default. Every plan includes 25 free Sidekick messages per month; heavier use requires a paid Sidekick subscription on top.

3. Broker integration is real now. The single biggest complaint in older TrendSpider reviews — including ours — was the lack of broker integration. That’s no longer accurate. TrendSpider supports manual and automated trade-routing workflows through SignalStack. Users can connect supported brokerages and crypto exchanges, send webhook-based orders from alerts or Strategy Bots, and manually place supported orders through the Trading Widget. Current support docs describe the Trading Widget as a beta feature, so users should review supported brokers, exchanges, and asset classes before relying on it.

TrendSpider 2026 Pricing: The Honest Breakdown

This is where the old review pricing was just flat wrong, so let’s get it right. TrendSpider offers four individual plans plus an enterprise tier. All four individual plans include full access to every feature — the same charts, the same data, the same Sidekick, the same Strategy Tester. What you’re paying more for is capacity: how many bots can run simultaneously, how many alerts can be active, how granular your scanning timeframe can go, and how deep your backtests can run.

Here’s the current 2026 pricing when billed yearly:

PlanAnnual Price (per month)Trading BotsActive AlertsLowest Scan/Backtest TimeframeBacktest Depth
Standard~$52/mo510 (30-day life)2-hour2,000 candles
Premium (Most Popular)~$66/mo1050 (90-day life)5-minute10,000 candles
Enhanced~$88/mo50100 (180-day life)1-minute20,000 candles
Advanced~$154/mo100400 (365-day life)1-minute30,000 candles

(Monthly billing is significantly more expensive — roughly $89, $149, $199, and $349 respectively. The annual discount is real: it’s where the platform becomes financially defensible.)

A few things to know before picking a tier:

The 14-day trial is paid, not free. TrendSpider replaced its old free trial with a 14-day full-access trial that costs $19 for Standard, $29 for Premium, $39 for Enhanced, and $49 for Advanced. That fee is non-refundable, but it covers everything for the full two weeks. We actually think the paid trial is the right approach — it filters out tire-kickers and gets you full-priority support during the trial period.

The 72-hour refund window after your first full charge. If you let the trial roll into a real subscription and decide within 72 hours that it’s not for you, you can request a refund (minus the trial fee). Miss the 72-hour window and you’re committed for the billing cycle.

Non-Pro market data is free. Retail traders trading their own accounts pay nothing extra for real-time US equities, ETFs, forex, and crypto data. Real-time futures is an optional $7.50/month (or $90/year) add-on. Real-time OPRA options data is $9.50/month for non-pro. OTC and some index data carry a 10–15 minute delay by default, which matters for some workflows and is worth knowing before you sign up. Professional traders (registered, trading firm capital, etc.) pay separate exchange fees — $29/month for NASDAQ on equities.

Sidekick AI has its own pricing layer. All plans include 25 free Sidekick messages per month with Claude Sonnet only. If you want more — or access to Gemini and ChatGPT — there are four Sidekick tiers: Free (25 messages), Basic ($49/mo for 100 messages + Gemini), Plus ($129/mo for 300 messages + ChatGPT), and Max ($349/mo for 1,000 messages). Most retail traders never need to upgrade past Free, but heavy AI users should price this in.

Which plan should you actually pick? Our take: Standard is fine for hobbyists and part-time swing traders who’ll set a few alerts and run a couple of bots. Premium is the sweet spot for most serious retail traders — the jump to 50 alerts and 5-minute scanning is what most people actually need, and it’s TrendSpider’s most popular tier for a reason. Enhanced makes sense if you scalp, run more than ten bots, or need 1-minute backtests for intraday strategies. Advanced is for systematic and quantitative traders running dozens of bots simultaneously.

Try TrendSpider for just $5 (14-Day Full Access) — Use coupon code START5 to unlock every feature on every plan for two weeks. If you want to test Sidekick AI, the Strategy Tester, and the AI Strategy Lab before committing, start your $5 trial here.

Core Features Deep Dive: What You’re Actually Paying For

We’ve broken this into nine pillars, because trying to summarize TrendSpider in three bullet points is what the old reviews got wrong.

A detailed technological infographic titled "TrendSpider 2026: Core Features Visual Overview," illustrating an integrated automated trading workflow. The central core node connects eight primary panels with glowing digital lines: Automated Charting & Technical Analysis with AI Coding Assistant; Multi-Timeframe Analysis showing overlapping trendlines; Raindrop Charts visualizing volume; Sidekick AI chatbot; Market Scanner & Smart Watch Lists; Strategy Tester for No-Code Backtesting; AI Strategy Lab for training machine learning models; and Alerts, Strategy Bots, & Broker Integration via SignalStack. A final side panel lists Market Research & Alternative Data types like insider trades and unusual options flow.

Automated Charting and Technical Analysis

This is still TrendSpider’s foundation, and it’s still excellent. The platform automatically draws trendlines, Fibonacci retracements, and support/resistance zones (rendered as heatmaps showing zone strength) on every chart. You can adjust sensitivity, which timeframes the algorithm scans, and which patterns it flags. The math behind it is consistent and objective — the lines either exist algorithmically or they don’t.

TrendSpider includes 400+ pre-built technical indicators across trend, momentum, volume, volatility, and market-breadth categories, plus automated trendlines, Fibonacci retracements, support/resistance zones, and standard drawing tools. The chart library includes every standard type — candlesticks, bars, line, area, point-and-figure, Heikin Ashi — and TrendSpider’s proprietary Raindrop® Charts (more on these below).

The pattern recognition engine detects classic chart formations — head and shoulders, cup and handle, pennants, wedges, triangles — plus candlestick patterns in real time. You can use any of those detections as scan conditions or alert triggers.

For traders who want custom indicators, TrendSpider supports JavaScript-based custom code with full data access. And if you can’t code? The AI Coding Assistant accepts plain-English prompts and writes the JavaScript for you. Describe what you want, get a working indicator on your chart. A simple custom overlay — a relative-volume indicator, a session-VWAP-deviation band, a custom momentum oscillator — can be generated in minutes from a plain description, without the manual Pine Script or developer work that used to be required on other platforms. You can read more about how moving averages, RSI, and other indicators work in our beginner’s guide if you need a refresher on the building blocks.

Multi-Timeframe Analysis (The Real Differentiator)

This is TrendSpider’s killer feature for swing traders, and it’s the feature most users credit with changing how they read charts. Multi-Timeframe Analysis lets you overlay indicators, candlestick patterns, trendlines, and Fibonacci retracements from a higher timeframe directly onto a lower-timeframe chart. So you can plot the daily 50-period EMA on a 15-minute chart, or detect weekly hammer candles on a daily chart, without opening a second window or flipping between layouts.

Why this matters: most retail traders make timeframe mistakes — taking a 5-minute entry without checking the daily trend, or chasing a daily setup without seeing that the hourly is rolling over. MTF analysis collapses that workflow into one chart, which is exactly the kind of operational improvement that compounds over hundreds of trades. You can dive deeper into the technique in our guide to multi-timeframe analysis for day traders.

Raindrop® Charts (Not Just a Marketing Gimmick)

Raindrop Charts are TrendSpider’s proprietary chart type, and they tend to get dismissed as a marketing flourish until you actually understand what they’re showing. A Raindrop is a volume-weighted candle: instead of just showing Open, High, Low, Close, it splits the bar into two halves and shows the volume-weighted average price (VWAP) for each half of the session.

The practical use case is spotting hidden distribution and accumulation. When a stock makes a new daily high but the Raindrop shows the bulk of the session’s volume happened at the lows, that’s a strong “ran out of buyers” signal that a standard candlestick won’t show you. The same logic in reverse applies to capitulation lows on heavy volume. Raindrops are particularly useful for reversal setups, where standard candlestick analysis often misses the internal session dynamics that telegraph the turn.

Sidekick AI: The 2026 Game-Changer

Sidekick is TrendSpider’s agentic AI assistant, and it’s the single biggest reason older reviews are out of date. It’s not a generic ChatGPT wrapper. Sidekick runs inside your TrendSpider account with full access to your charts, drawings, indicators, watchlists, backtests, and the platform’s entire market data stack — real-time prices, fundamentals, SEC filings, earnings transcripts, insider and Congressional trades, options activity, analyst ratings, news.

What you can actually do with it:

  • “What’s happening on this chart?” — Sidekick reads your open chart in context and gives you an analytical breakdown including trend structure, key levels, indicator readings, and likely scenarios. Not generic platitudes — it’s looking at your chart.
  • Build a scan from a sentence — “Scan the NYSE Composite for stocks breaking out of an ascending triangle with bullish unusual options activity above the 50-day SMA.” Sidekick translates the prompt into Market Scanner conditions, runs it, and shows you the matches.
  • Write a custom indicator — Describe the logic, Sidekick generates the JavaScript, plots it on your chart, and saves it to your indicator library.
  • Configure alerts in bulk — “Notify me when any stock on my swing watchlist crosses below its 50-day SMA on the daily.” Done. Across the entire watchlist.
  • Compare and analyze watchlists — Find overlapping symbols, surface fundamental differences, run technical scans across them.

Sidekick is a meaningful productivity multiplier, particularly for traders who don’t want to learn TrendSpider’s full UI before getting value from it. If you’re an active retail trader exploring how AI tools fit into trading workflows, Sidekick is one of the more substantive AI-for-trading implementations currently available to retail.

The Market Scanner and Smart Watch Lists

Scanning is one of the areas where older TrendSpider reviews understated the platform. The Market Scanner runs your technical, fundamental, and alternative-data conditions across the full universe of supported symbols and returns matches in real time. You can combine conditions — a breakout pattern plus a volume spike plus a positive analyst revision — and save scans for reuse.

A few features that matter:

  • Natural-language scan input — Type what you’re looking for in plain English directly into the Scanner. The platform converts it into conditions automatically. You don’t have to learn a query language.
  • Multi-timeframe scan logic — Build conditions that span timeframes (e.g., “daily flag breakout on a stock whose weekly trend is up”).
  • Scheduled scanners — Set scans to run automatically (pre-market, hourly, EOD) and email you the matches. Your morning watchlist arrives in your inbox before you log in.
  • Real-time updates — Scans run on live data, including conditions that trigger inside the current bar before it closes.

Smart Watch Lists are dynamic watchlists where the symbols update automatically as the market changes. TrendSpider ships with 700+ pre-built Smart Watch Lists out of the box — sector and industry groups, top retail-traded names, recent halts, 52-week highs/lows, ETF and 13F holdings, WallStreetBets mentions, insider buying, and dozens more — and you can create your own from any scan or filter rule.

For alternative-data signals like unusual options flow, insider buys, and dark pool prints, TrendSpider has a dedicated What’s Happening Now panel that monitors and filters those events in real time, separate from the Market Scanner. You can also visualize them as custom market heat maps.

For traders looking to build out their broader research workflow, our guide on stock scanners covers the foundational filters every day trader should understand.

Strategy Tester (No-Code Backtesting)

The Strategy Tester is TrendSpider’s no-code backtesting engine and one of the most valuable parts of the platform if you’re serious about validating your edge before risking capital. You define entry conditions, exit conditions, and risk rules (take-profit, stop-loss, trailing stops) through point-and-click menus — or describe the strategy in natural language and let the platform translate it. Then you run it on decades of historical data.

A single backtest is bounded either by date range or by candle count — 2,000 candles on Standard, 10,000 on Premium, 20,000 on Enhanced, 30,000 on Advanced. (Up to 50+ years of historical data is stored, so while one run won’t span the entire history, you can backtest across different windows.) The lowest backtest timeframe also varies by plan: 2-hour on Standard, 5-minute on Premium, 1-minute on Enhanced and Advanced.

The performance report includes everything you’d expect — total return, Sharpe ratio, Sortino ratio, win rate, average win/loss, reward-to-risk, maximum drawdown — plus a trade-by-trade log and equity curve. The Price Behavior Explorer lets you step through each individual trade to see what happened around every signal. And the KPI table is customizable, with “Go” / “No Go” flags on critical metrics so you can spot a thin sample or extreme drawdown at a glance.

A couple of things we particularly value:

  • Cross-symbol conditions. You can build a strategy that only triggers when SPY or QQQ confirms the regime — long NVDA only when SPY is above its 50-day, for example. No more maintaining separate market-filter scans.
  • Cost modeling. A unified “trade cost” input (percentage or flat dollar) bakes commissions and slippage into the backtest, so the equity curve reflects realistic friction. This is more important than most beginners realize, and we covered it in detail in our piece on the hidden costs of automated trading.
  • Cross-asset portability. Strategies use the same data, indicators, and conditions as the charting engine, so a strategy you build for an equity can be pointed at a futures contract, ETF, or crypto pair without rewriting it. This matters for traders who want to test the same setup across multiple instruments.
  • Variance testing. You can test a strategy across multiple timeframes, date horizons, and markets simultaneously to see if the edge is robust or curve-fit.

For a deeper dive on the methodology behind validating strategies properly, our step-by-step backtesting guide walks through the pitfalls (overfitting, look-ahead bias, survivorship bias) that most beginners trip over.

AI Strategy Lab (Different From Strategy Tester — Don’t Confuse Them)

This is the part most reviewers miss entirely, and it’s where TrendSpider goes from “good charting platform” into territory most retail tools don’t touch.

The AI Strategy Lab is a separate environment for training custom machine learning models that generate predictive trading signals. You choose a prediction target (e.g., “will this stock close higher over the next 5 bars?”), define input features using TrendSpider’s market data (technicals, fundamentals, alternative data, custom indicators), and pick a model type. Available models include Random Forest, K-Nearest Neighbors, Naive Bayes, and Logistic Regression — standard ML algorithms suited to different prediction problems.

You don’t need to know any of this if you don’t want to. The AI Strategy Lab includes an LLM-powered feature engineering helper that will suggest and configure inputs for you if you describe what you’re trying to predict. An advanced feature called cross-breeding combines multiple trained models and retrains the combined result, producing a new strategy with reduced bias and stronger performance than the individual models would produce alone. It’s how the platform helps you iteratively improve a model rather than settling for the first one that trains successfully.

Once trained, a model outputs signals you can use anywhere in the platform — paint them on charts, scan with them, plug them into rules-based strategies as conditions, fire alerts, or deploy them as fully automated Strategy Bots.

To be crystal clear on the difference:

  • Strategy Tester = rules-based backtesting. You define the logic.
  • AI Strategy Lab = machine learning. The model learns the logic from data.
  • Strategy Bots = forward deployment. Either approach can be deployed as a live bot.

Alerts, Strategy Bots, and Broker Integration

The execution layer is where TrendSpider has changed the most since older reviews were written. Three things stack on top of each other:

Dynamic alerts attach directly to chart objects — a trendline, a moving average, a horizontal level, a Bollinger Band. Right-click the object, configure trigger / buffer / sensitivity / time period, done. Multi-factor alerts go further: you can combine technical conditions, candlestick patterns, and fundamental events into a single trigger so the alert only fires when everything aligns. Alerts run on TrendSpider’s cloud, so they continue triggering even with your browser closed.

Delivery channels: text message, email, push notification, in-app notification, and webhook. The webhook is the unlock — fire an alert to Discord, Telegram, X, Slack, or any service that accepts an HTTP POST. Including order-routing services.

Strategy Bots are position-aware alerts deployed from your backtested strategies and run forward forever on live data. They track whether you’re long, short, or flat, and manage the full trade lifecycle — entry, scaling, exits, risk — instead of firing isolated signals. When a bot’s conditions trigger, it fires a webhook, SMS, or email.

Broker integration is where the old “you can’t trade from TrendSpider” criticism finally falls apart. Your TrendSpider account connects to 30+ brokerages and crypto exchanges through the Trading widget, with a free SignalStack account included for manual trading. For automation, you get 5 free SignalStack automated trades per month, scaling to paid tiers if you trade more frequently. SignalStack’s broker list is long — Interactive Brokers, E*TRADE, TradeStation, Robinhood, Tradovate, cTrader, and others. We have a broader take on how to think about automated execution and trading bots if you want context on where TrendSpider sits in the automation landscape.

To be honest about the limit: this isn’t direct market access at the level of a Cobra or Interactive Brokers TWS native integration, and it’s not appropriate for very high-frequency execution (sub-second). But for swing and intraday traders running multi-bar setups, it works. And the workflow gap that used to define TrendSpider has effectively closed.

Market Research and Alternative Data (Yes, There’s a Fundamentals Layer)

A lot of older TrendSpider coverage frames the platform as purely technical — automated trendlines, charting, backtesting. The current version is much broader, and softening that framing matters because it changes who the platform is right for.

Inside TrendSpider you get a full corporate fundamentals layer (EPS, revenue, EBITDA, share counts), analyst estimates, earnings and dividend data, plus a deep alternative-data library that includes:

  • Insider trading transactions
  • Unusual options flow
  • FINRA Reg SHO short-volume data
  • Dark pool and ATS volume
  • Market breadth indicators
  • Federal Reserve economic data (FRED)
  • US Congressional trading disclosures
  • Benzinga Pro news headlines
  • Social sentiment from StockTwits and WallStreetBets

You can also import your own data via CSV or API, which is useful for traders who maintain proprietary datasets, alternative data subscriptions, or want to integrate signals from external sources. Combined with technicals in scans and strategies, this makes the platform competitive for traders who want to blend technical setups with fundamental and alternative-data context — not just for pure chart-only systems.

That said, TrendSpider is still strongest for technical, systematic, and active traders. If you’re a buy-and-hold value investor doing nothing but DCF analysis, the platform isn’t built for your workflow. But the older characterization that it’s “useless for fundamental investors” is too strong — there’s a real fundamentals and research layer here.

Want to see Sidekick AI, the Strategy Tester, and the AI Strategy Lab in action? Use coupon code START5 to get a 14-day full-access trial for just $5. This unlocks every tool on every plan for two weeks and gives you 25% off for the next year. Start your $5 TrendSpider trial here

How the TrendSpider Workflow Comes Together

Rather than walking through specific trades, the more useful exercise for evaluating any platform is understanding how its tools interact. Here are two workflow patterns that show what TrendSpider is actually built to do — and, just as importantly, what it cannot do for you.

Workflow 1: From Setup Identification to Alerted Entry

A common systematic workflow on TrendSpider for a multi-day swing setup looks something like this:

  1. Scan for the candidate. Using the Market Scanner — either through built-in conditions or a natural-language prompt — you filter the universe of supported assets for setups matching your strategy. For example, stocks consolidating above a rising 50-day SMA with volume contraction and at least one bullish unusual options flow event in the past five sessions.
  2. Pull the chart and let automation do the analysis. Open a result. TrendSpider’s algorithm draws the trendlines, Fibonacci retracements, and support/resistance zones automatically. You see the technical structure rendered objectively, without the bias that creeps into hand-drawn analysis.
  3. Confirm with multi-timeframe context. Overlay the daily structure onto the hourly chart, or the weekly EMA onto the daily. If the higher-timeframe trend disagrees with the setup, the trade fails the confluence check before you take it.
  4. Set the alert with confirmation conditions. Place a multi-factor alert on the breakout level with a volume filter (e.g., the breakout candle must close on at least 125% of the 20-day average daily volume). The alert runs on TrendSpider’s cloud, so it fires whether your browser is open or not.
  5. When the alert fires, you act. Notification arrives via push, email, SMS, or webhook. You execute the trade through your connected broker via the Trading widget, or — if you’ve automated this part — let the Strategy Bot fire the order through SignalStack.

The key thing this workflow demonstrates: TrendSpider does the time-consuming, repetitive parts of the analysis 24/7, so the trader’s job collapses to (a) define the strategy upfront, (b) decide whether to take the trade when the alert fires, and (c) manage the position. For a part-time trader with a day job, this is the whole value proposition.

Workflow 2: From Idea to Validated Strategy

The second pattern is the strategy development loop — and it’s where the no-code backtesting and AI Strategy Lab earn their keep. The flow:

  1. Define the strategy rules. Either through the Strategy Tester’s point-and-click menus (entry conditions, exit rules, stops, take-profit, trailing stops) or by describing it in natural language and letting the platform translate.
  2. Backtest on historical data. Run the strategy across decades of history with realistic cost assumptions (commissions, slippage). The performance report includes Sharpe, Sortino, win rate, average win/loss, reward-to-risk, max drawdown, and a trade-by-trade equity curve. “Go” / “No Go” flags surface red flags like thin trade samples or extreme drawdowns.
  3. Variance test. Run the same strategy across multiple timeframes and markets to see if the edge is genuine or curve-fit to a specific window. If a strategy looks great on one ticker over one date range but falls apart elsewhere, that’s a warning.
  4. (Optional) train a machine learning model on it. If your strategy lends itself to pattern learning rather than fixed rules, the AI Strategy Lab can train a Random Forest, KNN, Naive Bayes, or Logistic Regression model on your inputs and use the trained signal as a condition.
  5. Deploy forward. Wrap the validated strategy into a Strategy Bot that runs forward forever on live data. The bot tracks whether you’re long, short, or flat, and fires execution signals via webhook (or alert-only mode) when conditions trigger.

What this workflow forces is honesty about your edge. A lot of retail traders skip backtesting entirely or run a single positive backtest and call it validated. The Strategy Tester’s variance testing, combined with cost modeling, makes it harder to fool yourself. Several setups that look great on a single eyeballed chart show negative expectancy across a proper backtest — and TrendSpider will show you that before you risk capital on them.

What the Platform Cannot Do

A clear-eyed framing of the limitations matters here, because no platform is magic. Even the cleanest setup, with every confluence checked and every backtest validated, fails at predictable base rates. A 60% win-rate strategy still loses 40% of the time. A 40% win-rate strategy with strong reward-to-risk loses most of the time and is still profitable. Sector rotation, macro shocks, quiet distribution, wrong-cohort buyers — any of these can kill a textbook A+ setup, and none of them show up in advance on a chart.

This is not a flaw in TrendSpider. It’s the base rate of trading. The platform’s job is to improve your ability to find, time, test, and manage setups. It cannot — and no platform can — change the underlying probability that any individual trade fails. Which is why risk management is the only thing standing between a methodical trader and a blown account, regardless of how good your tools are. If you’re not comfortable with stop-loss placement, position sizing, and the math of expectancy and risk-of-ruin before adding TrendSpider to your stack, fix that foundation first. The platform amplifies whatever you bring to it — in both directions.

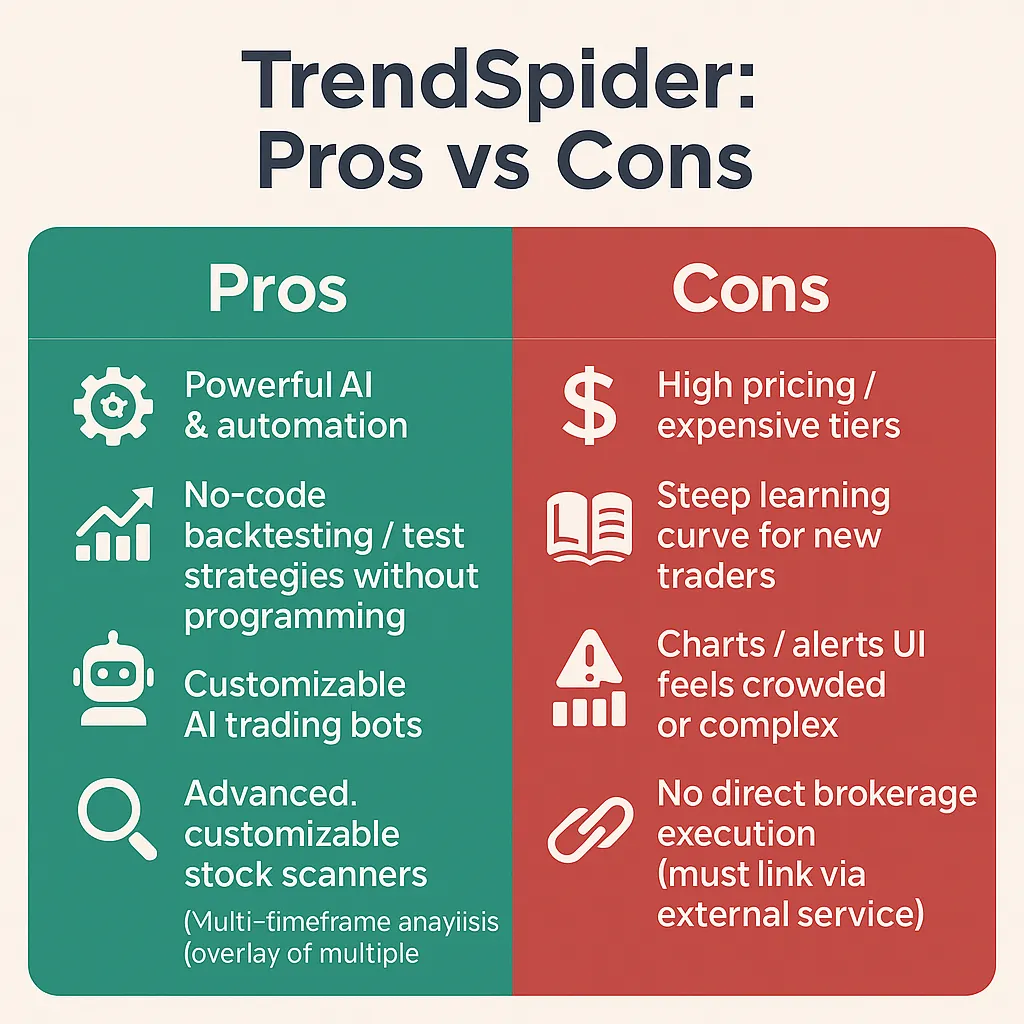
TrendSpider Pros and Cons (Updated for 2026)

A professional 16:9 infographic summarizing the pros and cons of the TrendSpider 2026 trading platform. The left column details six "PROS" using green text and icons: time-saving automated charting (trendlines, S/R zones), no-code backtesting and variance testing, Agentic AI integration (Sidekick AI and Strategy Lab), comprehensive data layer for stocks, crypto, and futures, direct manual and automated broker connectivity, and continuous weekly updates. The right column details five "CONS" with amber text and icons: a significant learning curve, premium subscription costs, platform latency not suitable for scalping or HFT, constraints on AI messaging with paid tiers, and high information density causing visual noise.

Pros

  • Genuinely time-saving automation. Automated trendlines, Fibonacci, support/resistance, and pattern recognition replace hours of manual charting per week. For a part-time trader with a day job, this is the entire reason to buy.
  • No-code backtesting that actually works. The Strategy Tester is one of the few backtesters we’d trust without writing custom code, and the variance testing feature catches curve-fitting before it costs you money.
  • AI integration that isn’t a gimmick. Sidekick reads your charts, builds your scans, writes your indicators. The AI Strategy Lab trains real machine learning models on your data. Both are substantial, not marketing veneer.
  • Comprehensive data layer. Real-time US equities/ETFs/forex/crypto on every plan (no per-feature paywall for retail), plus a deep alternative-data library covering options flow, dark pools, insider trading, Congressional trades, and more.
  • Broker integration via SignalStack. 30+ brokers and exchanges supported, with 5 free automated trades per month included. The old “can’t trade from the platform” criticism is no longer accurate.
  • Continuous platform updates. TrendSpider ships weekly. New features arrive without you doing anything.

Cons

  • Real learning curve. Plan on two to four weeks before you’re getting full value out of the platform. The number of tools is the source of both its power and its onboarding friction.
  • Premium-tier pricing. Even at the annual discount, TrendSpider is not cheap. Standard at ~$52/month is the floor; most serious users land on Premium at ~$66/month or Enhanced at ~$88/month. If you’re not actively trading, you’ll struggle to justify the cost.
  • Not built for scalping or HFT. The platform supports 1-minute charts and scans, but for true sub-minute Level 2 / time-and-sales scalping, you need a different tool. TrendSpider’s analysis-first design isn’t optimized for that latency profile.
  • Sidekick message limits. 25 free messages per month is generous for casual use but won’t be enough for heavy AI-driven workflows. Paid Sidekick tiers add real cost on top of your base subscription.
  • Information density. With every layer active — multi-timeframe overlays, indicators, automated trendlines, pattern detection — charts can get visually crowded fast. You have to be disciplined about turning things off.

TrendSpider vs. The Alternatives

Three comparisons matter most:

TrendSpider vs. Trade Ideas

This is the comparison we get asked about more than any other, and the framing that matters is: Trade Ideas is built for discovery; TrendSpider is built for analysis and automation.

Trade Ideas is, in our opinion after using it for years, the best real-time idea-discovery engine available to retail traders. Its Holly AI runs nightly backtests on thousands of strategies and delivers high-probability setups in real time, all day, across every US-listed stock. It’s a complete day trading platform with built-in paper trading, brokerage execution via TradeStation/E*TRADE/Interactive Brokers/CenterPoint/Cobra, one-click order entry, auto-trading, and OddsMaker backtesting. If your edge depends on getting in front of moves as they form intraday, Trade Ideas is the tool.

TrendSpider is the better fit if your edge depends on systematic chart analysis, deep backtesting, custom indicator development, and AI-assisted research on stocks you already know you want to trade. Where Trade Ideas surfaces opportunity, TrendSpider analyzes it.

A lot of serious traders use both — Trade Ideas to find what’s moving today, TrendSpider to plan the swing trade entries on what Trade Ideas surfaced. They solve different parts of the same problem.

Our verdict: For active day traders whose edge depends on real-time discovery, Trade Ideas is the better choice. For systematic swing and rules-based traders, TrendSpider wins.

TrendSpider vs. TradingView

This one’s closer than it used to be, and it depends on what you value.

TradingView is the world’s best manual charting platform, has the largest user community (thousands of free user-built indicators in Pine Script), and offers cleaner, simpler charts. It also has direct broker integration to a long list of brokers and excellent multi-device support.

TrendSpider wins on automation, depth, and AI. Its automated trendline detection, no-code backtesting, AI Strategy Lab, and Sidekick AI assistant are functionally a generation ahead of TradingView’s equivalents (where they exist at all).

Our verdict: If you want clean manual charting, the biggest community, and the best multi-broker integration, TradingView is hard to beat. If you want automation, AI-assisted research, and deep no-code backtesting, TrendSpider has the edge.

TrendSpider vs. Finviz

Finviz is a stock screener and market-overview tool — heat maps, fundamental and technical screens, sector visualization. It’s outstanding at what it does and the free version alone is genuinely useful for daily market context.

TrendSpider is a deep analysis and trading workflow platform.

These aren’t really competitors; they’re complementary. Many retail traders use Finviz to find stocks worth watching and TrendSpider to analyze, plan, and execute on them. Our day trading toolkit hub covers how these tools fit together in a complete stack.

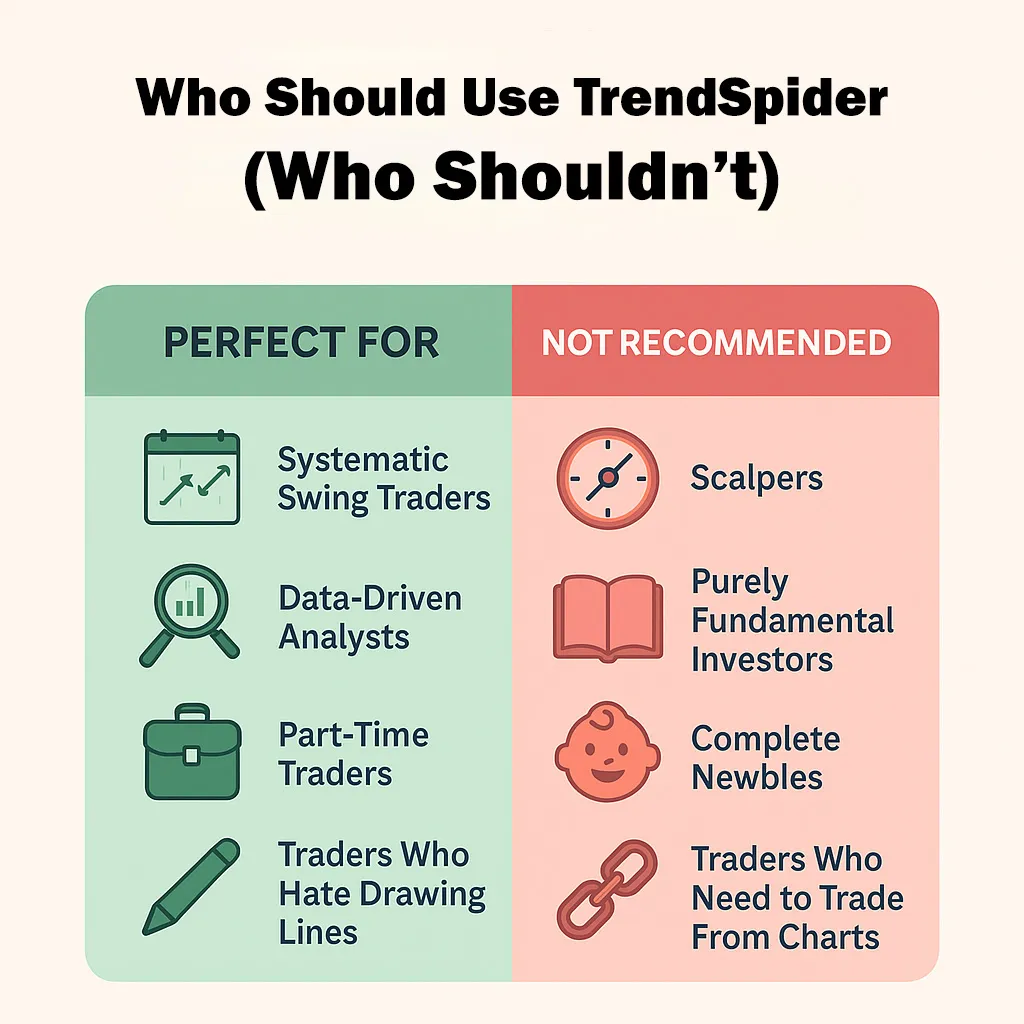
Who TrendSpider Is Built For (And Who Should Skip It)

TrendSpider is an excellent fit for:

  • Systematic swing traders who trade rules-based setups over multi-day to multi-week holds. The automated trendlines, multi-timeframe analysis, and Strategy Tester are tailor-made for this workflow.
  • Strategy developers who want to validate ideas with no-code backtesting before risking capital. The Variance Tester alone is worth meaningful money.
  • Part-time traders with a day job. Scheduled scanners deliver your morning watchlist to your inbox. Cloud alerts fire even with the browser closed. The platform does work for you while you’re not at your desk.
  • Active retail traders exploring AI. Sidekick and the AI Strategy Lab are some of the more substantive AI-for-trading implementations available to retail in 2026.
  • Technical-and-fundamental hybrid traders who want to combine chart setups with options flow, insider activity, analyst data, or alternative signals in a single workflow.

TrendSpider is probably not the right fit if:

  • You’re a tape-reading scalper. You need direct market access, Level 2 depth, and sub-second execution. TrendSpider is analysis-first, not execution-first.
  • You’re a pure long-term value investor. If you’re running DCF models and holding for years, you don’t need automated trendline detection.
  • You’re a complete beginner who doesn’t know what a candlestick is. Build your foundation with simpler tools first — see our day trading for beginners guide for the right starting point. TrendSpider rewards traders who already have a strategy and want to systematize and automate it.
  • You expect “set and forget” autopilot trading. Strategy Bots can automate signals and order routing, but no responsible trader leaves a bot unsupervised. The platform amplifies your edge — it doesn’t replace it.

If you fit the profile, the 14-day full-access trial is the cleanest way to evaluate it on your own setups. Start your TrendSpider trial here — you’ll know within two weeks whether it’s right for your workflow.

Final Verdict: Is TrendSpider Worth It in 2026?

After working through the entire current platform, our team’s call is a clear yes — for the right kind of trader.

If you’re a systematic, data-driven trader who believes in rules over gut feelings, TrendSpider in 2026 is one of the most complete platforms available in this category. The automated technical analysis saves real time. The no-code Strategy Tester forces you to validate your edge before risking capital. Sidekick AI and the AI Strategy Lab open up workflows that weren’t available to retail traders even eighteen months ago. And the broker integration gap that used to be the platform’s biggest weakness has effectively closed.

It is not cheap. Premium at roughly $66/month annual ($792/year) is the floor for serious use, and Enhanced at $88/month is where most active traders end up. That’s a real expense — and our honest take is that if you can’t articulate three specific workflows you’d use the platform for, you’re not ready to subscribe yet.

If you can — if you’ve got a backtestable strategy, a watchlist worth scanning, and the discipline to act on alerts — TrendSpider can help traders make their research, scanning, testing, alerts, and automation workflows more structured and repeatable. After working through every feature on the current platform, the score we’d give it is 4.5 out of 5, with the only friction being the price tag and the learning curve.

Ready to test it on your own setups? Start your TrendSpider 14-day full-access trial — every plan’s trial unlocks every feature. If it’s not for you within the first 72 hours of your first full subscription, you can request a refund (less the trial fee).

TrendSpider FAQs

Is TrendSpider worth it in 2026?

Quick Answer: Yes, if you’re a systematic technical trader; probably not if you’re a casual investor or pure tape reader.

The platform’s automated charting, no-code backtesting, AI assistant, and broker integration via SignalStack have made it a much stronger value than its older reviews suggest. The catch is the price tag — Premium at roughly $66/month annual is the floor for serious use, and not everyone trades enough to justify it.

Key Takeaway: TrendSpider rewards traders who already have a strategy and want to systematize, automate, and validate it.

Does TrendSpider offer a free trial?

Quick Answer: No — TrendSpider replaced its free trial with a 14-day paid trial starting at $19.

The trial fee is non-refundable but unlocks full access to every feature on the plan you choose ($19 for Standard, $29 Premium, $39 Enhanced, $49 Advanced). After the trial, if you let it convert to a full subscription and change your mind, you have 72 hours to request a refund (less the trial fee).

Key Takeaway: The paid trial is the most efficient way to evaluate the platform — start a TrendSpider trial here.

How accurate are TrendSpider’s automated trendlines?

Quick Answer: Mathematically precise, but not predictive.

TrendSpider’s trendline algorithm is deterministic — the lines either exist statistically or they don’t, eliminating the subjectivity of hand-drawn analysis. However, like every technical tool, accurate trendlines identify areas of likely support or resistance, not guaranteed price reactions. They break regularly.

Key Takeaway: Use TrendSpider’s automated analysis to remove bias, not to predict outcomes — which is why risk management is everything.

Can TrendSpider actually execute trades for me?

Quick Answer: Yes, in 2026 — through Strategy Bots and SignalStack webhook integration with 30+ brokers and crypto exchanges.

Older reviews said TrendSpider couldn’t execute trades. That’s outdated. Your subscription includes a free SignalStack account for manual trading and 5 free automated trades per month via webhook. Strategy Bots can fire entry/exit signals to your broker without you touching the keyboard. Higher SignalStack tiers scale with your trade frequency.

Key Takeaway: TrendSpider in 2026 supports real automated execution, though it’s still not appropriate for sub-second high-frequency strategies.

What’s the difference between Strategy Tester, AI Strategy Lab, and Strategy Bots?

Quick Answer: They’re three separate tools that work together — backtesting (Strategy Tester), machine learning (AI Strategy Lab), and live deployment (Strategy Bots).

The Strategy Tester is for rules-based no-code backtesting on historical data. The AI Strategy Lab trains custom machine learning models that generate predictive signals from your data. Strategy Bots deploy either approach forward, running 24/7 on live market data and firing webhooks, SMS, or email when conditions trigger.

Key Takeaway: Most retail traders start with the Strategy Tester. The AI Strategy Lab is for more advanced users who want machine learning without coding.

Is Sidekick AI worth the extra cost?

Quick Answer: The free tier (25 messages/month) is enough for most retail traders. Paid tiers make sense only for heavy AI users.

Sidekick’s free tier on Claude Sonnet covers casual analysis, occasional scan-building, and chart questions. If you’re using AI for dozens of workflows per week — bulk indicator generation, frequent multi-watchlist analysis, heavy chart annotation — the Basic ($49/mo) or Plus ($129/mo) tiers add real capacity plus access to Gemini and ChatGPT.

Key Takeaway: Try the free tier first. You’ll know within a few weeks whether the upgrade is justified by your actual usage.

Which TrendSpider plan should I pick?

Quick Answer: Premium for most active retail traders. Standard for hobbyists. Enhanced for scalpers or anyone running more than ten bots.

The Standard plan ($52/mo annual) caps scanning and backtesting at 2-hour timeframes, which is fine for hobbyists and pure swing traders. Premium ($66/mo annual) drops that to 5-minute and bumps you to 50 alerts and 10 bots — the sweet spot for most serious users. Enhanced ($88/mo annual) unlocks 1-minute backtests/scans and 50 bots. Advanced ($154/mo annual) is for quantitative and high-bot-count systematic traders.

Key Takeaway: Start with Premium unless you’re certain you need more or less — every plan can be upgraded or downgraded at any time.

Is TrendSpider good for beginners?

Quick Answer: Only if you’re a beginner who’s already committed to a systematic, data-driven trading approach.

The platform is powerful but dense. A complete beginner still learning what a candlestick means will find it overwhelming, and the monthly cost is hard to justify at the very-beginner stage. But a beginner who’s already done the homework — read the fundamentals, paper traded, built a basic strategy — and wants to systematize from day one can use TrendSpider productively.

Key Takeaway: Build your foundation first; see our day trading for beginners guide for the right starting point. Add TrendSpider when you have a strategy worth automating.

Does TrendSpider work for options, futures, or crypto traders?

Quick Answer: Yes — all three are supported with real-time data and full charting/backtesting/scanning capabilities.

Real-time futures data is an optional $7.50/month add-on for non-pro users. Real-time OPRA options data is $9.50/month non-pro. Crypto data from major exchanges is included free across every plan. The same indicators, scanners, alerts, and strategies that work on equities work on futures, options, and crypto without rewriting them.

Key Takeaway: TrendSpider is one of the more genuinely multi-asset platforms available to retail traders in 2026.

What are the biggest complaints about TrendSpider?

Quick Answer: Learning curve and price. The “no broker integration” complaint from older reviews is no longer accurate.

The two consistent friction points are the time it takes to become proficient (two to four weeks for most users) and the monthly cost (especially monthly billing, which is meaningfully more expensive than annual). Both are real — but both are functions of the platform’s depth, not bugs to be fixed.

Key Takeaway: Budget two to four weeks of onboarding before judging whether TrendSpider is worth it for your workflow.

Disclaimer

This TrendSpider review is for educational purposes only and does not constitute financial advice. Subscription pricing, plan features, and platform capabilities can change at any time — always verify current pricing and terms directly on TrendSpider’s website before subscribing. Automated technical analysis, backtesting results, and AI-generated signals do not guarantee future performance: a strategy that worked historically can fail in live markets, and even mathematically precise tools cannot predict price action. Trading, including the use of automated alerts, Strategy Bots, and webhook-routed orders, involves substantial risk of loss and may not be suitable for every investor. Never risk capital you cannot afford to lose, and consult a qualified financial professional before making investment decisions. DayTradingToolkit.com participates in TrendSpider’s affiliate program and may earn a commission on subscriptions started through links in this article, at no additional cost to you. For our full disclosure and risk policy, see our disclaimer page.

Article Sources

Our review of TrendSpider was built from verified pricing and feature documentation on TrendSpider’s official website, the platform’s published product specifications, and regulatory resources on technical analysis and automated-trading risk. Below are the primary references used.

  1. TrendSpider Platform Pricing and Service Plans — Official pricing page, plan tiers, capacity limits, add-on fees, and trial terms. https://trendspider.com/pricing/
  2. TrendSpider Market Data Catalog — Real-time data coverage, supported exchanges, asset classes, and alternative data feeds. https://trendspider.com/marketdata/
  3. TrendSpider Sidekick AI Product Page — Capabilities, supported language models, and integration architecture. https://trendspider.com/product/sidekick-ai-trading-assistant/
  4. SignalStack — Order routing partner used by TrendSpider for webhook-based broker integration; supported broker list and automation tier details. https://signalstack.com/
  5. SEC Investor.gov — Technical Analysis Resources — Regulator guidance on the limitations of technical analysis and automated tools for retail investors. https://www.investor.gov/
  6. FINRA — Day Trading Risk Disclosures — Regulator framework on the risks of active trading, including automated and algorithmic approaches. https://www.finra.org/investors/insights/day-trading

If you’ve made it this far, you already know whether TrendSpider fits your workflow. Use coupon code START5 to get a 14-day full-access trial for just $5. This unlocks every feature on every plan—Sidekick AI, the Strategy Tester, the AI Strategy Lab, automated trendlines, multi-timeframe analysis, and Strategy Bots. Start your $5 TrendSpider trial here.

The Review

TrendSpider

4.5 Score

TrendSpider in 2026 is one of the most complete automated technical-analysis platforms in the category, with depth that goes well beyond charting into AI-assisted research, no-code backtesting, machine learning models, and webhook-driven execution. It's not cheap, and the learning curve is real. But for systematic swing and intraday traders willing to put in the first two weeks of setup, the time saved is substantial. TrendSpider can help traders make their research, scanning, testing, alerts, and automation workflows more structured and repeatable. It does not guarantee trading results, and users should validate any strategy before risking capital.

PROS

  • Genuinely time-saving automation
  • No-code backtesting that actually works
  • AI integration that isn't a gimmick
  • Comprehensive data layer
  • Broker integration via SignalStack
  • Continuous platform updates

CONS

  • Real learning curve
  • Premium-tier pricing
  • Not built for scalping or HFT
  • Sidekick message limits
  • Information density

Review Breakdown

  • Ease of Use
  • Features & Tools
  • Charting Accuracy
  • AI & Automation
  • Backtesting Quality
  • Broker Integration
  • Mobile Experience
  • Customer Support
  • Value for Money
Tags: TrendSpider
ShareTweetShare
Kazi Mezanur Rahman

Kazi Mezanur Rahman

Founder. Developer. Active Trader. Kazi built DayTradingToolkit.com to cut through the noise in day trading education. We use AI-powered research and analysis to produce honest, data-backed trading education — verified through real market experience.

Next Post
Compare Trade Ideas vs TradingView for day traders!

Trade Ideas vs TradingView 2025: Which Day Trading Platform Is Better?

Trade Ideas vs Benzinga Pro for Day Traders

Trade Ideas vs. Benzinga Pro (2025): Data-Driven AI vs. Raw News Speed

Trade Ideas vs Scanz for Day Traders

Trade Ideas vs. Scanz (2025): AI Intelligence vs. Raw Market Data

Trade Ideas vs thinkorswim for Day Traders

Trade Ideas vs. Thinkorswim (2025): Is the Free Powerhouse Enough?

Trade Ideas vs Stock Rover Stock Platform Showdown for Day Traders

Trade Ideas vs. Stock Rover (2025): A Trader's Scalpel or an Investor's Microscope?

🔥Save Up To $320.40 With Promo: NANO2026
Our #1 Recommended Tool

Trade Ideas

Holly AI scans every stock in real time so you never miss a high-probability setup. Our team runs it live every single trading day.

Holly AI signals high-probability setups live
500+ real-time filters — find stocks first
Paper trading + live broker execution
OddsMaker backtesting before you risk capital
Claim My Discount
💰 Latest discount codes 📖 Our full review
Tested in Live Markets

Day Trading Toolkit

Our team's hand-picked tools for scanners, charting, education, and more.

Scanners Charting Education Journals AI Tools
Explore the Full Toolkit

Free comparison guides included

Disclaimer & Affiliate Disclosure
Transparency & risk details — please read
Read the disclaimer & affiliate disclosure ▸

Disclaimer: All content on DayTradingToolkit.com is for educational purposes only and does not constitute financial advice. Day trading is a high-risk activity, and you should not trade with money you cannot afford to lose. Please consult with a qualified financial advisor before making any investment decisions.

Affiliate Disclosure: DayTradingToolkit.com may receive a commission if you sign up for a product or service through one of our affiliate links. This comes at no extra cost to you and helps us to continue creating high-quality content. We only recommend products our team has personally used and vetted.

Read Full Disclaimer

© 2026 DayTrading Toolkit

Legal & Support

  • Privacy Policy
  • Disclaimer
  • Contact Us
  • About

Follow Us

Join 2,000+ traders

One Email. Every Setup That Matters.

Every Monday, our team breaks down the week ahead: which sectors are in play, what setups we're watching, and the one mistake most traders will make. When a market-moving event breaks mid-week, subscribers hear about it first.

We respect your inbox — No spam, no fluff — just the prep work that saves you time.

No Result
View All Result
  • Home
  • Learn
    • Beginner’s Guide
    • Psychology & Risk
    • Strategies
  • Reviews & Comparisons
  • Blog
  • Trading Toolkit

© 2026 DayTrading Toolkit