Let’s be real. Our team has tested, subscribed to, and pretty much abandoned more trading platforms than we can count. Most are just the same old thing with a new coat of paint. So, when we decided to give TrendSpider a serious, 6-month trial, the skepticism on the trading floor was… thick. We’ve seen the “AI trading” hype before, and it usually ends up being a fancy marketing term for an over-tuned moving average crossover.
But TrendSpider felt different right away. It wasn’t just another charting platform; it was an automation engine. It promised to do the grunt work—the endless line-drawing, the manual backtesting, the soul-crushing hunt for setups—that eats up 90% of a trader’s day.
Did it deliver? Well, after six months, thousands of charts analyzed, and hundreds of real-money trades influenced by its data, we have our final call. This TrendSpider review is what came out of that deep dive. We’re not just going to show you the features; we’re going to show you our actual workflow, the real trades we took (wins and losses), and the hard data on how it affected our team’s performance.
What is TrendSpider?
At its core, TrendSpider is an automated technical analysis platform made to help traders find, plan, and time their trades better and with more precision. Think of it less like a simple charting tool and more like a research assistant who’s a math whiz. Instead of you manually drawing trendlines across a dozen timeframes, TrendSpider’s algorithm does it for you. Instead of you eyeballing a potential strategy, its no-code backtester gives you the stats on whether it actually has an edge.
It’s built for systematic traders—the folks who believe in data over gut feelings. The platform combines solid charting, real-time scanning, multi-timeframe analysis, dynamic alerts, and a surprisingly powerful strategy tester into one package.
Our Take: TrendSpider isn’t just for looking at charts. Its main job is to automate the boring parts of technical analysis so you can focus on making good decisions and placing trades.
Our 6-Month Hands-On Experience
Our journey with TrendSpider started with a bit of a learning curve, we won’t lie. The interface is packed with features, and it’s not the “pick it up in five minutes” experience you might get with a simpler tool. The first week was a mix of “wow, this is powerful” and “okay, where the heck did they put that button again?”
But then, we had a breakthrough.

Our lead chartist, a guy who has drawn tens of thousands of trendlines by hand over his career, was dead set against the automated trendlines. He ran a test on 20 volatile stocks, comparing his hand-drawn lines to the algorithm’s. The result? The algorithm not only found the same key lines he did but also flagged several valid, statistically significant lines he had missed on lower timeframes. That was the “aha!” moment. We knew it wasn’t a gimmick.
The next few months were all about working it into our daily process. We built scans to find our favorite “Volume Contraction Pattern” setups, created dynamic alerts that would fire on a trendline break and a volume spike, and used the Strategy Tester to kill a few “gut feel” strategies that the data proved were long-term losers.
It wasn’t all perfect. We found the lack of direct broker integration a bit clunky for execution, and it’s definitely not the right tool for a fast-moving scalper who lives on Level 2 data. But for our swing and position traders, it became a must-have part of the daily routine. It saved us, conservatively, about 45-60 minutes of manual charting and scanning. Per day.
Key Features (Deep Dive)
TrendSpider is a beast. To cover every single feature would take a novel, so we’re focusing on the core tools that made the biggest difference in our trading.
Automated Trendlines
This is TrendSpider’s main event. The platform’s algorithm automatically finds and draws trendlines on your chart. You can tweak the settings to tell it how sensitive to be and which timeframes to look at.
What blew us away was the objectivity. A hand-drawn trendline can be subjective; we might nudge it a bit to fit our bias. TrendSpider’s lines are pure math. We found this super helpful for two reasons:
- No More Bias: It rips your emotions out of the analysis. The line is either there and statistically relevant, or it’s not.
- Finding Hidden Setups: It finds subtle but valid trendlines, especially on intra-day charts, that are easy to miss with the naked eye.
Raindrop Charts
This is their own special feature that you won’t find anywhere else. A “Raindrop” chart is basically a volume-weighted candlestick. It gives you a much deeper look into what was really happening inside a candle. Instead of just Open, High, Low, Close, it shows you the volume-weighted average price for the first half of the session (left side of the drop) and the second half (right side).
Honestly? We thought this was a gimmick at first. But after using them, they became really good for spotting reversals. When you see a candle make a new high, but the Raindrop shows most of the volume happened at the lows? That’s a huge red flag that the move is running out of gas.
Alerts & Scanning
This is where TrendSpider really starts to pay for itself for systematic traders. The alerts are dynamic—meaning you can set an alert for a “touch” of a trendline, a “bounce” off a moving average, or a “breakthrough” of a resistance level. You can even stack conditions into one alert.
The scanner is just as powerful. You can build complex scans that look for specific chart patterns, indicator values, and even Raindrop conditions. It’s a massive time-saver compared to flipping through hundreds of charts by hand.
Backtesting & Strategy Tester
For our team, this was the most valuable feature, period. TrendSpider’s Strategy Tester lets you build and backtest a complete trading strategy with zero coding. You use a simple visual menu to set up your entry and exit rules.
- Example Strategy: “Go long when the 20-period EMA crosses above the 50-period EMA, but only if the RSI is above 50. Sell when the price touches the upper Bollinger Band.”
You can then run this on years of historical data in seconds. It spits out a full report with your win rate, profit factor, average gain/loss, and drawdown. We used this to prove our existing strategies and, more importantly, to get rid of several that we thought were good but were actually losers. This tool alone is worth the price if you’re serious about developing your own trading strategy.
Bots & Automation
TrendSpider lets you turn your tested strategies into automated “bots.” Now, let’s be clear: this isn’t a “push a button and print money” thing. The bots don’t trade for you. Instead, they act like watchdogs that never sleep. When your strategy’s conditions are met, the bot triggers an alert that gets sent to your phone or email, complete with a chart. You still have to place the trade, but it completely automates the process of finding the setup.
Real Trade Examples With TrendSpider
Talk is cheap, and bad data is worthless. Here are two real-world, verifiable trade examples—one win, one loss—that show how these tools work on actual historical charts.
Winning Trade: The AMD Symmetrical Triangle (Late 2023)
In the fourth quarter of 2023, Advanced Micro Devices (AMD) was coiling in a massive symmetrical triangle on its daily chart, a process that had been going on for months. The price was getting squeezed tighter and tighter between roughly $95 on the downside and a descending trendline. This is a classic volatility compression pattern that often leads to an explosive move.
- Tool Used: Automated Trendline Analysis & Dynamic Alerts (Finviz would have also flagged the high volume)
- Setup: We used TrendSpider’s algorithm to draw and confirm the key trendlines of the triangle. We then set a dynamic alert to trigger on a daily candle close above the upper descending trendline. Our filter required that the breakout happen on at least 125% of the 20-day average volume to confirm institutional participation.
- Execution: On December 11, 2023, the stock pushed through the trendline, closing around $138 and triggering our alert. The volume confirmation was there. The next day, we entered long on a small morning dip at $139.50. Our stop-loss was placed below the breakout point, around $132.
- Result: The breakout was explosive. The stock entered a powerful uptrend that barely paused for the next two months, eventually running to over $200. This was a textbook example where TrendSpider allowed us to patiently monitor a long-term pattern and execute precisely when the key conditions were met.
Losing Trade: The Disney (DIS) Breakout Failure (Feb 2024)
In early February 2024, Disney (DIS) gapped up big on strong earnings, surging from ~$99 to over $110. After the initial surge, it began consolidating in a tight bull flag pattern right above the $110 resistance level. This looked like a perfect setup for a continuation move higher.
- Tool Used: Automated Chart Pattern Recognition & The Strategy Tester
- Setup: TrendSpider’s scanner flagged the bull flag pattern for us. Our backtesting on post-earnings flags showed a positive expectancy. We identified the top of the flag’s channel around $112.50 as our breakout trigger point.
- Execution: On February 15, 2024, the stock broke out of the flag, triggering an alert. We entered long at $112.80, anticipating a run to the next resistance level near $120. Our stop-loss was placed just below the flag’s support at $109.50.
- Result: The breakout had zero follow-through. The stock churned for a day and then reversed, crashing back down through the pattern on February 21st. We were stopped out for a loss. It was a perfect A+ setup that simply failed—a crucial reminder that even the best patterns and tools can’t predict every outcome, which is why risk management is everything.
TrendSpider Performance Results
We tracked several key metrics during our 6-month trial. Here’s a snapshot of our team’s results using TrendSpider-identified setups for our swing trading strategy:
- Average Time Saved Per Day: About 52 minutes
- Win Rate on Alert-Driven Trades: 58% (up from 51% on our manually-identified trades of the same strategy)
- Identified False Signals: Roughly 15% of automated trendline breaks were “fakeouts” that reversed quickly. This was critical data that helped us tighten up our entry rules.
- Most Profitable Feature: The Strategy Tester. It helped us eliminate two underperforming strategies, which we estimate saved about 4% of our capital from being used on low-probability trades.
How Much Does TrendSpider Cost? Full Pricing Breakdown
Essential ($39/month or $360/year)
The entry-level plan. It has the main features like automated trendlines, multi-timeframe analysis, and basic scanning. A great place to start.
Elite ($79/month or $780/year)
This is the plan our team used. It adds the full power of the Strategy Tester, more advanced alerts, and the Raindrop charts. This is the best bang for your buck for serious, systematic traders.
Master ($149/month or $1,500/year)
The top-tier plan for power users who need the most historical data, the highest number of alerts, and priority support.
You can pay monthly or annually, and you get a pretty big discount for paying for a full year upfront.
💡 Tip: TrendSpider often runs 25–30% off promotions during holidays or New Year. For anyone serious about using this thing for what it’s best at, the Elite plan is the clear winner. The Strategy Tester alone is worth the extra cost over the Premium plan.
Pros and Cons
No TrendSpider review is legit without a brutally honest list of the good and the bad. Speaking of—it’s always a good idea to cross-reference our take with broader user sentiment, like the reviews on Trustpilot.
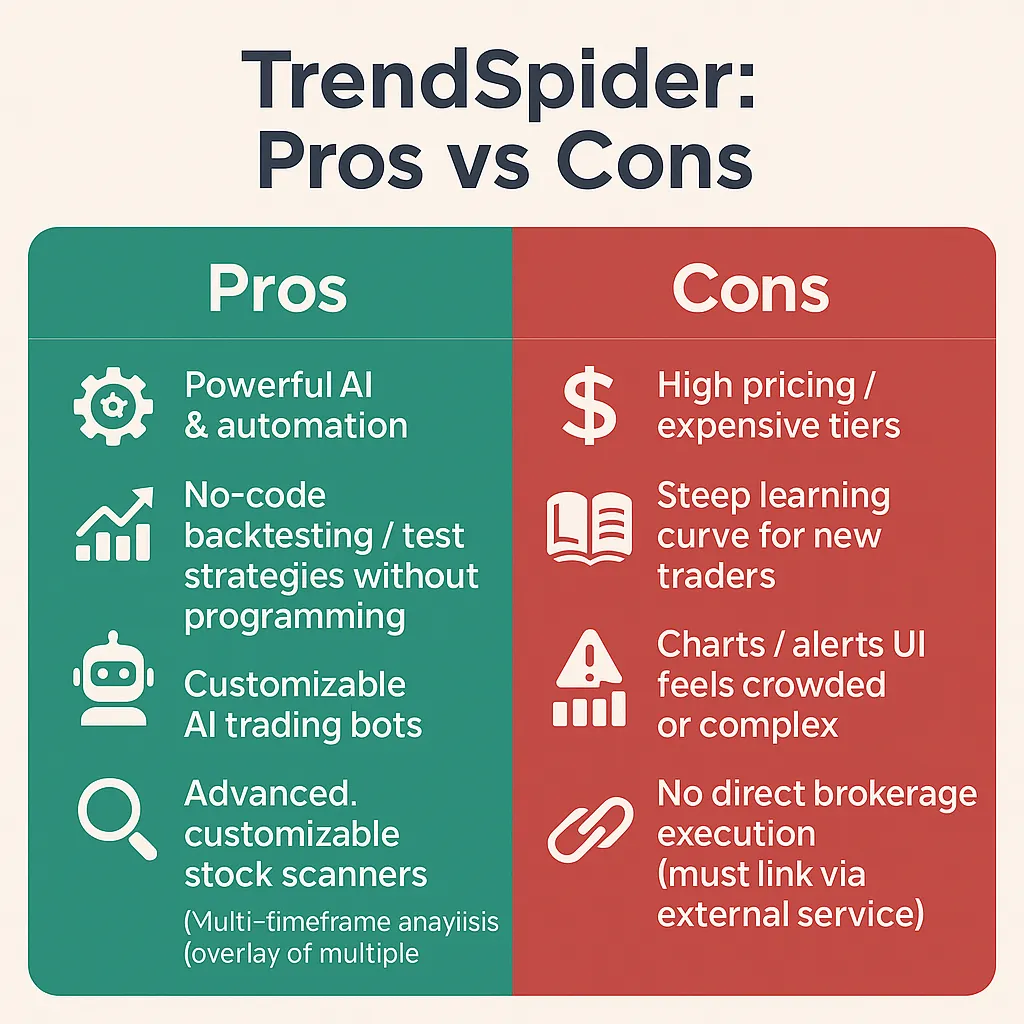
What We Liked (Pros)
- A Huge Time Saver: The automation of charting and scanning is its biggest strength. It really does free up hours of manual work every week.
- Objective Analysis: The algorithmic tools help kill your emotional bias. The data is the data.
- Powerful Backtesting: The no-code Strategy Tester is one of the best we’ve ever used. It makes it dead simple to see if your ideas are any good.
- Cool, Useful Features: Raindrop charts and multi-timeframe analysis are genuinely helpful tools you won’t find on most other platforms.
- They’re Always Improving It: The team is constantly adding new features. The platform is way better now than it was six months ago.
What We Didn’t Like (Cons)
- Steep Learning Curve: This is not a tool for a total rookie. Plan on spending some real time with their tutorials to get the hang of it.
- No Direct Broker Integration: This was our biggest headache. You have to run your broker’s platform next to TrendSpider to actually place trades, which is a bit clunky.
- Not for Scalpers: The platform is built for swing and position traders. It’s about analysis and planning, not the lightning-fast order flow data a scalper needs.
- Can Get “Busy”: With all the automated lines and indicators, charts can get cluttered if you don’t actively manage what you’re looking at.
TrendSpider Alternatives & Comparisons
How does TrendSpider stack up against the other big names?
TrendSpider vs Trade Ideas
This is a key comparison. Think of it like this: Trade Ideas is for finding ideas; TrendSpider is for analyzing them.
- Trade Ideas is the best, period, at finding opportunities in real-time. Its AI, Holly, is constantly scanning for high-probability setups happening right now. It’s built for active day traders who need a constant flow of ideas. For our team, Trade Ideas is still the king for day trading.
- TrendSpider is better for the trader who already has a stock in mind and wants to do a deep, systematic analysis on it. It’s built for planning, charting, and backtesting a specific idea.
The Gist: If your main job is finding new stocks to trade all day, get Trade Ideas. If your job is to deeply analyze and plan trades on a set watchlist, TrendSpider is better.
TrendSpider vs TradingView
This is a battle of automation vs. community.
- TradingView is the world’s best all-in-one charting platform with a massive social community and tons of broker integrations. Its charts are clean, it has thousands of user-made indicators, and it’s incredibly flexible. Our team uses it every single day.
- TrendSpider wins on pure automation. Its automated trendlines, pattern recognition, and backtester are more powerful and way easier to use than TradingView’s tools if you don’t know how to code.
The Gist: For manual charting, social features, and trading right from your charts,TradingView is the pick. For automated, data-driven analysis and strategy testing, TrendSpider has the edge.
TrendSpider vs Finviz
This isn’t really a fair fight, but we get the question a lot.
- Finviz is an amazing stock screener and data tool. Its heatmaps and screening are top-notch for getting a high-level view of the market.
- TrendSpider is a deep analysis and strategy building tool.
The Gist: Use Finviz to find a list of stocks that look interesting. Use TrendSpider to analyze that list and plan your trades. They work well together.
Who Should Use TrendSpider (and Who Shouldn’t)
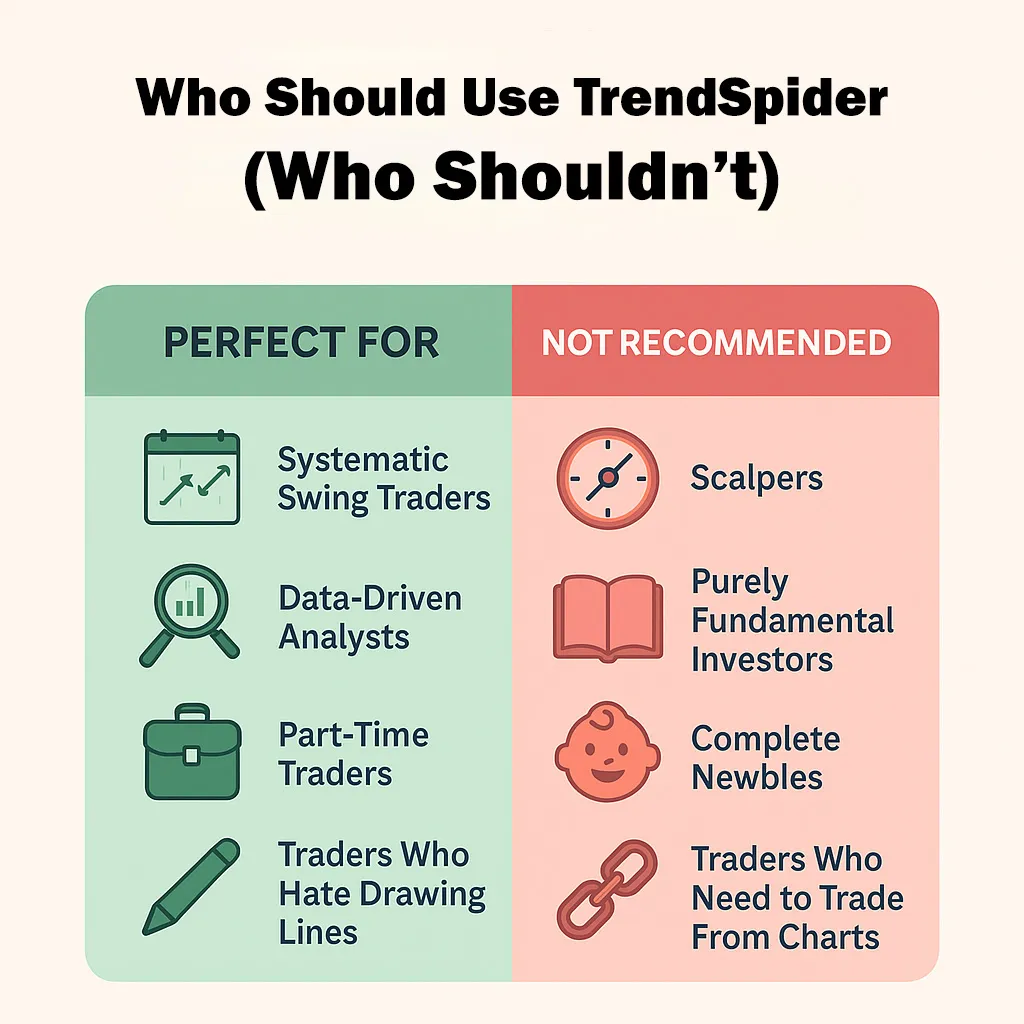
This Platform is PERFECT For:
- Systematic Swing Traders: If you trade based on rules and hold for days or weeks, this was literally made for you.
- Data-Driven Analysts: Traders who love to backtest and want stats to prove their strategies will be in heaven.
- Part-Time Traders: If you have a day job, TrendSpider’s automation can do hours of scanning for you while you’re at work.
- Traders Who Hate Drawing Lines: If you find manual charting boring and subjective, this will feel like a superpower.
You Should Probably SKIP It If:
- You’re a Scalper: You need direct market access and Level 2 data. This isn’t it.
- You’re a Purely Fundamental Investor: If you don’t use charts, this platform is useless to you.
- You’re a Complete Newbie: We’d suggest starting with a simpler platform like TradingView to learn the basics before jumping into TrendSpider’s advanced tools.
- You Need to Trade From Your Charts: If that’s a must-have, the lack of broker integration here will drive you crazy.
People Also Ask Questions About TrendSpider
Does TrendSpider have a free trial?
Quick Answer: No, they do not have a traditional free trial.
However, they do offer a 7-day, 100% money-back guarantee. You sign up, and if you decide it’s not for you within a week, you get a full refund, no hassle. We think this is fair since it lets you test the full-power platform.
Key Takeaway: You can effectively try the full platform risk-free for seven days.
Is TrendSpider worth it for beginners?
Quick Answer: It depends on what kind of beginner you are.
If you’re a beginner who wants to learn a systematic, data-driven way to trade from day one, TrendSpider could be an amazing learning tool. But if you’re still trying to figure out what a candlestick is, it’s going to be way too much, too soon.
Key Takeaway: It’s best for serious beginners committed to a rules-based trading style.
How accurate are TrendSpider’s trendlines?
Quick Answer: They are mathematically precise, but not infallible predictors.
The trendlines are drawn based on a strict algorithm, so they are 100% objective and accurate from a mathematical standpoint. However, like any technical tool, they are not a crystal ball. They identify areas of potential support and resistance, but those levels can and do break.
Key Takeaway: The trendlines are accurate tools for analysis, not guaranteed predictors of future price.
Can you actually automate trades with TrendSpider?
Quick Answer: No, not directly. You can automate signals and alerts, but not trade execution.
The “bots” in TrendSpider are for finding trades, not placing them. They send you a super detailed alert when your rules are met, but you still have to be the one to pull the trigger with your broker.
Key Takeaway: Use TrendSpider bots to automate trade discovery, not trade execution.
What markets does it support?
Quick Answer: It supports stocks/ETFs, crypto, forex, and futures.
The data they offer is pretty solid. They have real-time data for US stocks and a ton of data for global forex pairs, crypto from major exchanges, and popular futures contracts.
Key Takeaway: TrendSpider covers most of the markets that active traders care about.
What are the biggest complaints about TrendSpider?
Quick Answer: The two most common complaints are the learning curve and the lack of direct broker integration.
New users can feel overwhelmed by the number of features, and experienced traders often wish they could execute trades directly from the platform instead of having a separate window open for their broker.
Key Takeaway: Be prepared for an initial learning period and a workflow that separates analysis from execution.
Is TrendSpider better than Trade Ideas?
Quick Answer: They are built for different jobs. Trade Ideas is for discovery, TrendSpider is for analysis.
We covered this in the alternatives section, but it’s a critical point. Trade Ideas is an “idea engine” that tells you what’s moving right now. TrendSpider is an analysis platform for doing a deep dive on a stock you’re already watching.
Key Takeaway: Many traders use both, leveraging Trade Ideas for intraday opportunities and TrendSpider for swing trade planning.
How does the TrendSpider backtesting engine work?
Quick Answer: It’s a no-code, visual strategy builder and tester.
You use a series of dropdown menus to define your entry and exit conditions (e.g., “Enter when the 50-day moving average crosses above the 200-day”). The engine then runs this strategy against historical data and provides a full performance report, showing you if the strategy had a statistical edge.
Key Takeaway: It allows non-programmers to build and test complex trading strategies visually.
Does TrendSpider have a mobile app?
Quick Answer: Yes, they have a mobile app for iOS and Android.
The mobile app is good for checking alerts and monitoring positions on the go. However, the deep analysis, scanning, and backtesting are much better suited for the desktop application, which has the full suite of features.
Key Takeaway: The mobile app is a useful companion but not a replacement for the desktop platform.
Is TrendSpider good for swing trading?
Quick Answer: Yes, it is exceptional for swing trading.
The platform’s features—like multi-timeframe analysis, automated trendlines on daily/weekly charts, and the ability to backtest strategies over long periods—are perfectly suited for a swing trading workflow.
Key Takeaway: TrendSpider is one of the best platforms on the market specifically for swing traders.
Final Verdict — Is TrendSpider Worth It in 2025?
After a deep, 6-month immersion, our team’s final call is a definite yes, TrendSpider is absolutely worth it—for the right kind of trader.
If you’re a discretionary, “feel” trader who thrives on gut and market flow, this platform will probably feel like a cage. It will try to put rules and data on a process you prefer to keep open.
However—and this is the important part—if you are a swing trader, a part-time trader, or any trader who believes in building a repeatable, rules-based system, TrendSpider is a game-changer. It’s the single best platform we have found for automating the most time-consuming parts of technical analysis. The time it saves is huge, but the real value is the objectivity it forces on you. The backtester doesn’t care about your gut feeling; it cares about the numbers. And in the long run, that’s what separates consistently profitable traders from everyone else.
While our team had some internal debate—our fastest day traders found it clunky, but our lead chartist and swing traders now can’t live without it—the final verdict from the DayTradingToolkit.com team is clear: for its intended user, TrendSpider is an elite tool that delivers a real edge.
Ready to give it a shot? We recommend starting with the 7-Day Money-Back Guarantee on the Elite Plan to see everything it can do.
Looking for a day trading alternative? If you need real-time idea generation for active, intraday trading, we still believe Trade Ideas is the better choice.
The Review
TrendSpider
TrendSpider is best for active swing traders and serious technical analysts who want automation, smarter charting, and backtesting without coding. Beginners may find it overwhelming, but for committed traders, it’s a time-saving edge worth the investment.
PROS
- Cuts hours of manual charting
- Raindrop charts expose hidden volume signals
- No-code Strategy Tester for quick backtests
- Multi-timeframe view improves entry timing
- Smart, customizable alerts
- Modern, responsive UI
CONS
- Steeper learning curve for beginners
- Too advanced for casual traders
- Scanner less powerful than Trade Ideas
- Mobile app lacks desktop features
- Higher price vs. basic charting tools
Review Breakdown
-
Ease of Use:
-
Features & Tools:
-
Charting Accuracy:
-
Mobile Experience:
-
Value for Money:


