
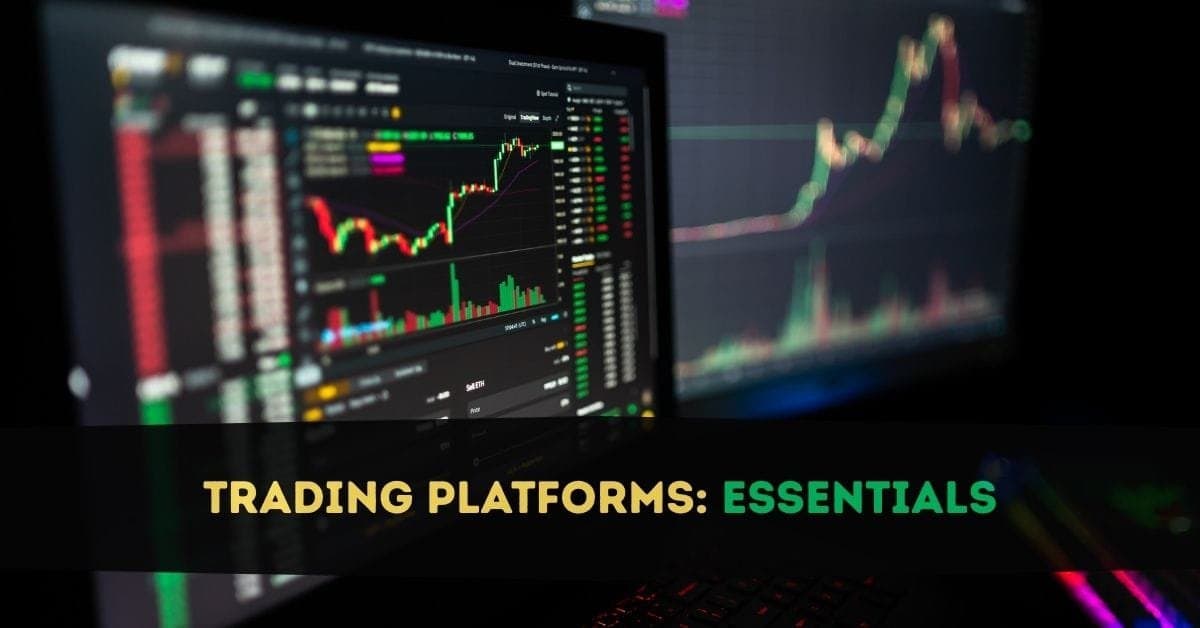
Day Trading Platforms: The 5 Essential Features for Your Cockpit
A pilot doesn't fly blind. Every instrument in the cockpit exists for a reason — altitude, speed, fuel, heading, engine status. Remove one, and the pilot is guessing. Add too many, and the cockpit becomes a distracting mess that slows reaction time when seconds matter.
Your trading platform is your cockpit. It's where you see the market, analyze opportunities, execute trades, and manage risk — all in real time. And just like a cockpit, what matters isn't having the most instruments. It's having the right instruments, in the right place, working reliably every time you need them.
Here's the problem most beginners face: they either choose a platform so simple they outgrow it within weeks, or they choose one so complex they spend more time learning the software than learning to trade. Both mistakes cost time and money.
This guide teaches you the five essential feature categories your platform must have — and equally important, what you don't need yet. We're not ranking specific platforms. We're giving you the knowledge to evaluate any platform, so you can find the cockpit that fits your trading style.
What Is a Day Trading Platform? (And How It Differs From a Broker)
This distinction trips up nearly every beginner, so let's clear it up immediately.
Your broker is the financial institution that holds your money, processes your trades, and connects you to the stock market. Think of the broker as the airline company.
Your platform is the software interface you use to interact with your broker — placing orders, viewing charts, managing positions, and analyzing data. Think of the platform as the cockpit inside the airplane.
Here's where it gets slightly complicated: some brokers build their own proprietary platform (Schwab's thinkorswim, Fidelity's Active Trader Pro). Others let you choose from third-party platforms (DAS Trader, Sterling Trader Pro). And some platforms — like TradingView — connect to multiple brokers, so you can use the same software interface regardless of who holds your account.
A few platforms go even further, combining scanning, charting, execution, and education into one integrated environment. Trade Ideas, for example, isn't just a scanner — it's a full day trading platform with AI-powered scanning, built-in charting, paper trading, and direct order execution through brokers like Interactive Brokers and E*TRADE via its Brokerage Plus feature. That kind of all-in-one approach eliminates the need to juggle multiple software windows, which is a genuine advantage once you know what you're doing.
The key insight? Choosing a broker and choosing a platform are sometimes one decision and sometimes two separate decisions. If you picked your broker using the framework from our broker selection checklist, now it's time to evaluate the platform options available through that broker — or alongside it.
Feature #1: Real-Time Data — Your Eyes on the Market
If the platform is your cockpit, real-time data is your windshield. Without it, you're flying blind.
What Real-Time Data Actually Means
Real-time data means the prices you see on your screen are current — updating tick by tick as trades happen on the exchange. This sounds obvious, but many free platforms and basic brokerage apps provide delayed data by default, where quotes are 15-20 minutes behind. That's fine for long-term investors checking their portfolio once a week. For a day trader, a 15-minute delay is an eternity. The stock you think is at $45.00 might already be at $46.50.
The Three Levels of Market Data
Level 1 data shows you the basic information: the current bid price (highest price a buyer will pay), the ask price (lowest price a seller will accept), the last traded price, and volume. This is the minimum for day trading. Most brokers provide Level 1 streaming data for free with a funded account.
Level 2 data (also called depth of market or the "order book") shows you all the pending buy and sell orders at every price level, not just the best bid and ask. This reveals the supply and demand dynamics behind the price — how many shares are waiting to be bought or sold at each level. Level 2 is valuable for understanding short-term price pressure, but it's not essential for absolute beginners. It typically costs $10-30/month extra if your broker doesn't include it.
Time and Sales data (the "tape") shows a real-time stream of every completed trade — price, size, and time. Combined with Level 2, this gives you a complete picture of who's buying, who's selling, and how aggressively. Again, powerful but advanced. We cover reading Level 2 and Time & Sales in depth later in our order book guide.
What to Look For
At minimum, your platform must provide free, real-time Level 1 streaming data for U.S. equities. If you have to pay extra for real-time quotes, factor that cost into your total trading expenses. Some brokers include it free; others charge $10-25/month. Ask before you commit.
Feature #2: Charting — Your Map of Price Action
Charts are how day traders read the market. A candlestick chart — the standard visual format — shows you where price has been, where it is now, and gives clues about where it might go next. Your platform's charting capability determines how clearly you can see these patterns and how quickly you can analyze them.
Essential Charting Features for Beginners
Multiple chart types: At minimum, your platform should offer candlestick, bar, and line charts. Candlestick charts are the standard for day trading — each candle shows the open, high, low, and close for a specific time period. We teach candlestick reading in our introduction to candlestick charts.
Adjustable timeframes: You need to view the same stock at different time intervals — 1-minute, 5-minute, 15-minute, daily. Day traders typically use the 1-minute or 5-minute chart for entries and exits, with a daily chart for broader context. Your platform should let you switch timeframes instantly without reloading the chart.
Technical indicators: Indicators are mathematical overlays on the chart that help identify trends, momentum, and potential reversals. Your platform should include at least these basics: moving averages (SMA and EMA), volume, VWAP (volume-weighted average price), and RSI (relative strength index). We cover the most useful beginner indicators in our basic indicators guide.
Drawing tools: You need the ability to draw horizontal lines (for support and resistance), trendlines, and basic shapes on your charts. These tools let you mark important price levels and visualize patterns. They should be intuitive — click, drag, done.
Multiple charts simultaneously: You should be able to view at least 2-4 charts at the same time. Watching a single chart in isolation limits your ability to see context. Even beginners benefit from having a 5-minute chart and a daily chart side by side.
What Separates Good Charting From Great Charting
Beyond the essentials, more advanced platforms offer features like chart linking (clicking a symbol on a watchlist automatically updates all your charts), custom indicator building, annotation saving across sessions, and dozens of chart types beyond candlesticks. You probably don't need these on day one, but you'll appreciate them within a few months. That's why we recommend the "grow-into" approach (more on this below).

Feature #3: Order Entry — Your Hands on the Controls
This is where the money moves. Order entry is how you tell your broker what to buy, what to sell, at what price, and under what conditions. A slow or confusing order entry system is like a steering wheel that sticks — you know where you want to go, but you can't get there fast enough.
Essential Order Types Your Platform Must Support
Market order: Buys or sells immediately at the current best available price. Fast but imprecise — you might not get exactly the price you see on screen, especially in volatile stocks. This is the order type most beginners start with.
Limit order: Buys or sells only at a specific price or better. You control the price, but the order might not fill if the market doesn't reach your price. Essential for controlling execution quality.
Stop order (stop-loss): Triggers a market order when the stock reaches a specified price. This is your emergency exit — it automatically sells your position if the price drops to your predetermined loss limit. Non-negotiable for risk management.
Stop-limit order: Combines a stop trigger with a limit price. More control than a basic stop, but carries the risk of not filling in a fast-moving market.
We break down each order type in full detail — including when to use each and common mistakes — in our order types guide.
Speed and Workflow Features
Beyond the basic order types, pay attention to how you enter orders:
One-click or two-click execution: How many clicks does it take from "I want to buy" to "order submitted"? Some platforms require navigating menus and confirmation pop-ups. Others let you execute with a single click or keyboard shortcut. Fewer clicks = faster execution = less slippage.
Hot key support: The fastest traders don't click at all — they use keyboard shortcuts (hot keys) to enter, exit, and modify orders. If you plan to trade actively, hot key support is a significant advantage. We cover setting up hot keys in our hot keys guide.
Bracket orders: A bracket order lets you set your entry, your profit target, and your stop-loss all at once, as a single order package. When one side fills, the others activate automatically. This is incredibly useful for enforcing your trading plan without needing to manually enter stop-losses after every entry — a step beginners often forget when emotions are running high.
Order confirmation settings: Most platforms let you toggle confirmation pop-ups on or off. Beginners should keep confirmations on to prevent accidental orders. As you gain experience and speed becomes more important, you may choose to disable them.
The "Wrong Button" Test
Here's something nobody talks about: your platform's order entry design should make it hard to make catastrophic mistakes. Buying when you meant to sell. Entering 5,000 shares instead of 500. Submitting a market order when you meant to submit a limit order.
Before trading with real money, test your platform's order entry in paper trading mode. Try to intentionally make mistakes. Can you cancel an order quickly? Can you flatten all positions with one button? Is the "buy" and "sell" distinction visually clear? These design details matter more than you'd think.
Feature #4: Position Management — Your Dashboard Gauges
Once you're in a trade, you need to monitor it — and your overall account — in real time. Position management features are the dashboard gauges that show you how you're performing, what's at risk, and when something needs attention.
What Your Platform Must Show You
Current positions: A clear, real-time view of every open position — what you own, how many shares, your average cost, and the current profit or loss on each position. This should update continuously, not on a refresh-and-wait basis.
Unrealized P&L (profit and loss): How much you're up or down on positions you haven't closed yet. This number changes tick by tick. Your platform should display it prominently — not buried three menus deep.
Realized P&L: Your actual profits and losses on trades you've already closed, for the day, week, or any custom period. This is your scorecard. Being able to see your daily P&L in real time helps you enforce daily max-loss rules — a critical risk management practice we cover in our risk management guide.
Buying power: How much capital you have available for new trades. This accounts for your cash, any margin available, and the capital tied up in open positions. Knowing your buying power prevents you from accidentally overextending.
Order status: A live feed showing the status of all orders — pending, partially filled, filled, cancelled. You need to know instantly whether your order went through. A "pending" order that you forgot about can surprise you with an unintended fill.
The Flatten Button
Many active trading platforms include a "flatten" or "close all" button that liquidates all open positions instantly. This is your emergency brake. In a worst-case scenario — a flash crash, a surprise news event, a platform glitch — one click exits everything. Not every platform has this feature, and its absence should be a factor in your decision.
Feature #5: Customization and Layout — Building Your Personal Cockpit
No two pilots set up their cockpit exactly the same way. The instruments are the same, but the layout, preferences, and visual priorities reflect individual style. Your trading platform should let you arrange your workspace to match how you think and trade.
Essential Customization Features
Window arrangement: You should be able to move, resize, and dock different panels — charts, watchlists, order entry, positions — wherever you want on your screen. A platform that locks you into a fixed layout forces you to adapt to its workflow instead of the other way around.
Watchlist creation and management: Your watchlist is the list of stocks you're monitoring each day. You should be able to create, save, and modify multiple watchlists easily. Look for platforms that let you sort watchlists by custom criteria — price change, volume, relative volume — and display them alongside your charts.
Saved layouts: The ability to save your entire workspace arrangement — which windows are open, where they're positioned, what charts you're viewing — so you can load the same setup instantly every morning. Setting up your workspace should be a one-time task, not a daily chore.
Color and visual settings: The ability to change chart colors, background themes (light vs. dark mode), and candlestick colors. This sounds cosmetic, but spending 6+ hours looking at charts means visual comfort directly affects your focus and fatigue.
Linking: Window linking means that selecting a stock in one window — like your watchlist — automatically updates all linked windows (charts, Level 2, order entry) to that same stock. This saves enormous time. Without linking, you're manually typing the same ticker symbol into five different windows.
We go deeper into how to actually arrange these features for maximum efficiency in our trading screen layout guide.
Desktop vs. Web vs. Mobile: Which Platform Type Do You Need?
Trading platforms come in three formats, and each has genuine tradeoffs.
Desktop Applications
Pros: Fastest execution speed, most features, best multi-monitor support, most customization options, typically includes hot keys and advanced order types. Desktop platforms are the standard for serious day trading.
Cons: Windows-only in many cases (DAS Trader, Sterling Trader Pro). Requires installation and updates. Tied to one computer unless you install on multiple machines. Heavier on system resources.
Best for: Dedicated home-office day traders who prioritize speed and features. If you're trading from a fixed setup with one or more monitors, this is the standard choice.
Web-Based Platforms
Pros: Works on any operating system (Windows, Mac, Linux, Chromebook) through a browser. No installation needed. Access from any computer with internet. Always up-to-date.
Cons: Slightly slower than dedicated desktop apps. May have fewer features or customization options. Depends on browser stability. Can be affected by browser extensions or memory issues.
Best for: Mac users, traders who need flexibility across multiple devices, and beginners who want to start without committing to a desktop installation. TradingView is the most popular web-based platform.
Mobile Apps
Pros: Trade from anywhere. Monitor positions on the go. Useful for alerts and quick checks.
Cons: Screen size severely limits chart analysis. Fat-finger mistakes are more likely on touchscreens. Not suitable for active day trading — you can't effectively manage multiple charts, order entry, and position monitoring on a 6-inch screen.
Best for: Monitoring positions and handling emergencies when away from your desk. Mobile should be your backup, not your primary trading environment.
Our recommendation for beginners: Start with your broker's desktop or web platform. Use mobile only as a backup for monitoring and emergency exits. As you advance, you'll naturally gravitate toward the platform type that fits your style. Most professional day traders use desktop platforms at home and keep the mobile app as a safety net — the same approach we recommended in our trading setup guide.

The "Outgrow vs. Grow Into" Framework
This is the framework most beginners need but no one teaches.
When choosing a platform, you're making a tradeoff between simplicity and capability. Simpler platforms are easier to learn but have fewer features. Complex platforms have more features but take longer to learn. The mistake is optimizing for one extreme.
The "Outgrow" Trap
If you start with a platform that's too simple — say, a mobile-first app with basic charting and only market/limit orders — you'll outgrow it within weeks. You'll want better charts, faster execution, more order types, and the ability to customize your layout. Then you'll have to switch platforms, learn a new interface, and potentially even transfer your brokerage account. That transition costs time, momentum, and sometimes money.
The "Overwhelm" Trap
If you start with a platform that's too complex — say, a professional-grade desktop app with 200+ indicators, custom scripting, and a learning curve measured in months — you'll spend more time fighting the software than learning to trade. Features you don't understand become distractions, not advantages.
The Sweet Spot: "Grow Into"
Choose a platform that's slightly more capable than what you need right now. You should be able to do everything you need today with ease, while knowing that there are features you'll unlock as you progress. You want a platform you'll grow into over the next 6-12 months — not one you'll outgrow in 6 weeks.
Signs you've found the sweet spot:
- Basic operations (place orders, view charts, manage watchlists) feel intuitive within 1-2 days
- You notice features and settings you don't fully understand yet — but they're there when you're ready
- The platform has an active user community, tutorials, or documentation you can reference as you learn
- Hot keys, bracket orders, and advanced charting are available but not required for basic use
Think of it like buying a car you'll drive for five years. You don't need every feature immediately — but you don't want to outgrow it in six months either.
The Platform Test-Drive Checklist: 10 Things to Try Before Committing
Before committing real money to any platform, take it for a test drive using paper trading or a demo account. Here are 10 specific things to test:
1. Place a market order and a limit order. How many clicks does it take? Is the process intuitive? Can you distinguish clearly between buy and sell?
2. Set a stop-loss on a position. Can you do it quickly? Can you modify it after placement? This will be something you do on every single trade.
3. Cancel a pending order. How fast can you cancel an order that hasn't filled yet? In a fast-moving market, this needs to be instant.
4. Close all positions at once. Does the platform have a "flatten" or "close all" button? Try it. Know where it is before you need it in an emergency.
5. Switch between chart timeframes. Click from a 5-minute chart to a daily chart and back. Is it seamless, or does the chart take seconds to reload?
6. Add an indicator to a chart. Add a moving average and VWAP. Is the process drag-and-drop easy, or buried in menus?
7. Create and save a watchlist. Add 10 stocks. Sort them by volume. Save the watchlist. Close the platform and reopen — is the watchlist still there?
8. Link your windows. Click a stock on your watchlist. Do your charts automatically update? If not, check the settings for window linking.
9. Check your P&L display. Open and close a paper trade. Can you see your realized and unrealized P&L clearly? Is it updated in real time?
10. Test during market hours. This is critical. A platform that runs smoothly on Saturday might lag at 9:31 AM on Monday when the market opens and data volume spikes. Test during the real thing.
If any of these ten tests frustrate you or take more than a few seconds, consider that frustration multiplied by 20 trades per day. Platform friction compounds. For a full guide to the best tools across every trading category, explore our Day Trading Toolkit.
What's Next in Your Day Trading Journey
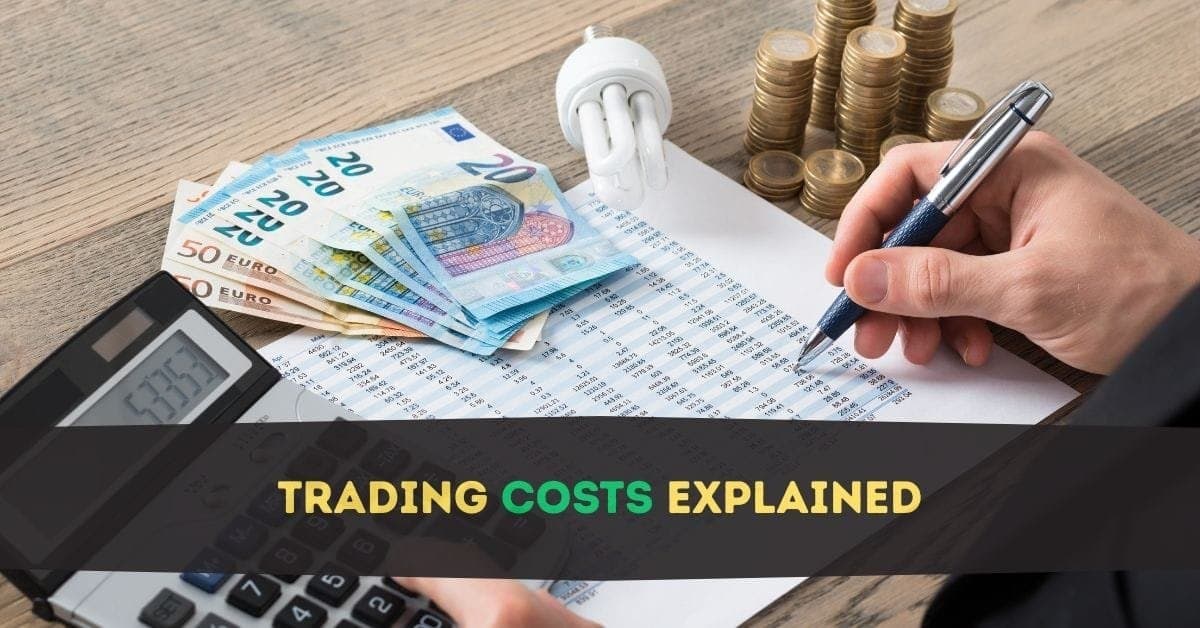
You now understand the five instruments that make up your trading cockpit — and how to test-drive any platform before committing real money. But the cockpit is only useful if you understand the cost of operating it. Commissions, data fees, spreads, margin interest — the costs of trading add up, and they eat into your profits in ways most beginners don't realize until it's too late.
→ Next Article: Understanding Brokerage Costs: Commissions, Fees, and Spreads
Frequently Asked Questions
What is the best day trading platform for beginners?
Platforms that consistently rank well for beginners include thinkorswim (via Schwab) for its education and paper trading, TradingView for its web-based accessibility and free tier, and Trade Ideas for its all-in-one scanning, charting, and execution capabilities. But more important than the name is whether the platform passes your personal test-drive checklist and fits the "grow into" framework — slightly more capable than you need today, with room to expand as your skills develop.
Key Takeaway: Evaluate platforms on the 5 features from this guide, then test-drive your top 2-3 options with paper trading before committing.
Do I need to pay for a trading platform?
Your broker's built-in platform handles the basics — order entry, basic charting, position management. Free web-based platforms like TradingView's free tier add better charting. Premium platforms become worth the cost when you've developed a specific workflow that demands features the free platforms don't offer — like advanced scanning, automated trading, or direct market access.
Key Takeaway: Start with free platforms. Upgrade when you've identified a specific feature you need that free tools can't provide.
What's the difference between a trading platform and a charting platform?
For example, TradingView is primarily a charting platform that also offers trading through connected brokers. DAS Trader is primarily an execution platform with basic charting. Trade Ideas combines scanning, charting, and direct execution into a single platform. Many traders use a combination — their broker's platform for execution and a separate charting tool for analysis. The trend is toward all-in-one platforms, but the best setup depends on your needs.
Key Takeaway: You need both charting and execution capabilities. They can come from one platform or two — what matters is that both work well.
How important are hot keys for day trading?
If you're placing 2-3 trades per day while learning, clicking through an order entry window is fine. Once you're placing 10+ trades daily with tighter profit targets, the time saved by hot keys directly impacts profitability. The time to learn hot keys is during paper trading — not with real money on the line. We walk through hot key setup in our hot keys guide.
Key Takeaway: Start without hot keys, learn them in paper trading, and implement them as your trade frequency increases.
Should I use a desktop platform or a web-based platform?
If you're on a Mac and your broker only offers a Windows desktop app, a web-based platform is the practical choice. If you're trading from a dedicated desk with a fast computer, a desktop platform gives you the speed edge. The real answer depends on your hardware, operating system, and how actively you plan to trade. Many traders use both — desktop at home, web or mobile on the go.
Key Takeaway: Desktop for primary trading, web for flexibility, mobile for emergencies only.
What is Level 2 data and do beginners need it?
Level 2 data becomes useful when you're ready to read order flow — understanding whether buyers or sellers are more aggressive at a given moment. For beginners focused on learning chart patterns, indicators, and basic order execution, Level 1 data (best bid, best ask, last price, volume) is sufficient. Add Level 2 once you've mastered the basics and want to refine your entry timing. We cover reading the order book in our Level 2 and Time & Sales guide.
Key Takeaway: Skip Level 2 at first. Add it after you're comfortable reading charts and executing trades confidently with Level 1 data.
Can I use my phone as my primary trading platform?
Mobile apps are designed for monitoring and occasional trades — checking your positions, setting alerts, or making an emergency exit. They're not designed for analyzing five charts simultaneously, managing bracket orders, and executing trades within seconds of a signal. Think of mobile as your backup cockpit — useful in emergencies, but not where you want to fly the plane every day. For your primary setup, use a desktop or web platform as we outlined in our trading setup guide.
Key Takeaway: Mobile is a backup, not a primary platform. Day trading requires screen space and speed that phones can't deliver.
How do I know when I've outgrown my current platform?
Specific signs: you're constantly switching between apps because your platform lacks a feature (like bracket orders or customizable layouts). You're losing time on order entry because the process requires too many clicks. You can't view enough charts simultaneously. The platform freezes or lags during high-volume market opens. Your charting tools don't support the indicators your strategy requires. If these frustrations happen daily, they're not minor annoyances — they're costing you money.
Key Takeaway: Upgrade when platform limitations become daily obstacles to your strategy execution, not before.
What's the most overlooked platform feature for beginners?
In a worst-case scenario — a flash crash, unexpected news, or a platform glitch — you need the ability to exit all positions instantly with a single action. Before you trade live, locate this button (or keyboard shortcut) on your platform. Some platforms call it "flatten," others "close all," others "liquidate." Practice using it in paper trading so your muscle memory is there when the adrenaline kicks in.
Key Takeaway: Find the flatten/close-all button on day one of paper trading. Practice until you can hit it with your eyes closed.
Can I use multiple platforms at the same time?
Running multiple platforms simultaneously requires more screen space, more computer resources, and more mental bandwidth. When you're still learning what each instrument in the cockpit does, adding more instruments doesn't help — it creates noise. Start with one platform that covers the five essential features. As you identify specific weaknesses (maybe the charting is basic but the execution is fast), you can selectively add a second tool for that specific purpose.
Key Takeaway: One platform to start. Add specialized tools later as your workflow demands them.
Disclaimer
The information provided in this article is for educational purposes only and should not be considered financial advice. Day trading involves substantial risk and is not suitable for every investor. Past performance is not indicative of future results.
For our complete disclaimer, please visit: https://daytradingtoolkit.com/disclaimer/
Article Sources
- SEC: Trade Execution — What Every Investor Should Know — The SEC's guidance on how broker order execution works, including order routing and best execution obligations.
- FINRA: Brokerage Accounts — FINRA's investor education on account types, margin accounts, and what to expect when setting up a trading account.
- SEC Investor.gov: Executing an Order — The SEC's explanation of the trade execution process, including how brokers route orders and why execution speed matters.
- StockBrokers.com: Best Day Trading Platforms 2026 — Independent, hands-on platform comparison with detailed methodology and real-money testing across major brokers.
- Investopedia: Trading Platform — Comprehensive definition of trading platforms, key features, and the distinction between broker platforms and third-party tools.
- CME Group: Trading Technology — CME Group's educational resource on trading technology infrastructure and platform requirements for active traders.
Was this helpful?

Written by
Kazi Mezanur RahmanFounder, independent researcher, and editor of DayTradingToolkit, a one-person publication focused on risk-first trading education, documented tool research, and clear explanations.
Keep Reading

Beginner’s Guide
How to Set Up Your Trading Screen Layout (Single & Multi-Monitor Guides)
Learn how to set up your day trading screen layout — zone-by-zone templates for 1, 2, and 3+ monitors. The cockpit principle, virtual desktops, and layout mistakes to avoid.

Beginner’s Guide
Your Essential Day Trading Setup: Computer, Internet, and Software Needs
Build your day trading setup without wasting money. Computer specs, internet requirements, essential software categories, and backup plans — everything beginners need.
Beginner’s Guide
Understanding Brokerage Costs: Commissions, Fees, and Spreads
Learn the real cost of day trading — commissions, spreads, slippage, PFOF, and hidden fees. Our breakdown shows what every trade actually costs you in 2026.

Beginner’s Guide
Choosing Your First Day Trading Broker: A Beginner's Checklist
Don't get trapped. Our 7-point checklist shows you how to choose the best day trading broker by evaluating regulation, platforms, and hidden costs.
Comments
No comments yet. Be the first to share your thoughts.