You have 200 trades sitting in a spreadsheet. Maybe more. You logged every entry, every exit, every emotional note you scrawled at 10:47 AM after that disastrous reversal on NVDA. And now what?
Most traders—ourselves included, for longer than we’d like to admit—review their journals the same way every time. Scroll through. Nod at the winners. Wince at the losers. Promise to “stop overtrading on Fridays.” Change nothing.
Here’s the problem: you’re asking a human brain to find patterns in its own behavior. That’s like asking a fish to describe water. Your ego filters what you see. Your memory distorts the sequence. And the subtle, repeating patterns—the ones actually destroying your edge—stay invisible.
That’s where AI trading journal analysis changes the game. Not as some magical oracle, but as a tool that reads your raw data without the emotional baggage you bring to it. Think of it as a behavioral mirror—one that reflects patterns you genuinely cannot see in yourself.
Our team has been testing this approach for months now, feeding real trade logs into ChatGPT, Claude, and Gemini to see what sticks and what’s hype. This guide is the result: a practical, step-by-step workflow for using AI to extract actionable insights from your trading journal. No fluff, no magic promises—just a methodology that works.
For a broader look at how AI fits into the day trading landscape, check our complete AI day trading guide.

Why Your Trading Journal Needs an AI Co-Analyst
If you’re already keeping a journal—and if you’re not, our trading journal psychology guide explains why that’s step one—you’ve already done the hard part. You’ve collected the data. The question is whether you’re actually extracting everything that data contains.
Spoiler: you’re probably not. And that’s not an insult. It’s just how human cognition works.
A 2025 literature review published in SN Business & Economics surveyed over a decade of research on AI-driven bias detection in financial decision-making. The conclusion? AI algorithms—including NLP, deep learning, and clustering methods—successfully detect cognitive biases like overconfidence, loss aversion, herding behavior, and the availability heuristic from trading records and behavioral data. These are patterns that exist in your journal right now but that your own brain actively hides from you.
We call this the “Behavioral Mirror” concept. When you read your own journal, you’re reading it through the lens of the person who made those trades. You remember the “bad luck” on that losing streak. You gloss over the three consecutive revenge trades that followed. An LLM trade log analysis doesn’t care about your narrative. It sees the numbers, the timing, the escalating position sizes, and it connects dots you can’t—or won’t—connect yourself.
AI does three things better than manual journal review:
Volume processing. You can hand it 50 trades and ask for cross-referencing patterns that would take you hours to map manually. It does it in seconds.
Pattern consistency. AI doesn’t get bored by trade #37. It applies the same analytical rigor to every single entry.
Emotional objectivity. This is the big one. Your journal entries are emotionally charged data. An AI reads “felt confident, sized up” and “felt anxious, hesitated on entry” as data points to correlate with outcomes—not as justifications.
But here’s the honest counterweight: AI doesn’t understand market context the way you do. It wasn’t watching the Level 2 when that order flow shifted. It can’t feel the “vibe” of a choppy tape. And it doesn’t inherently know your risk tolerance or life circumstances. The Behavioral Mirror shows you patterns—what you do with those patterns is still entirely your job.
Step 1 — Structure Your Journal Data for AI Analysis
Here’s where most traders go wrong before they even start. They copy-paste a wall of freeform journal text into ChatGPT and ask, “What patterns do you see?” The AI does its best, but you’ve basically handed it a junk drawer and asked it to build furniture.
Garbage in, garbage out. The quality of your AI journal analysis depends almost entirely on how you structure the data before you hand it over.

The Essential Data Fields
Your journal needs two categories of data for AI to work with effectively. Think of them as the “what happened” and the “why it happened” layers.
Quantitative Fields (The Hard Data):
- Date and time of entry/exit
- Ticker symbol
- Direction (long or short)
- Entry price and exit price
- Position size (shares or contracts)
- Stop-loss level (planned vs. actual)
- Profit target (planned vs. actual)
- P&L (dollars and R-multiple)
- Commission/fees
Qualitative Fields (The Soft Data):
- Setup type (breakout, pullback, reversal, etc.)
- Market conditions (trending, choppy, high volatility)
- Emotional state before entry (1-5 scale: 1=anxious, 5=confident)
- Emotional state during trade (1-5 scale)
- Rule adherence (Yes/No + notes on any deviation)
- Reason for deviation (if applicable)
- Time-of-day session (pre-market, open, midday, close)
The emotional rating scale matters more than you think. Freeform notes like “felt good” or “was nervous” are harder for AI to correlate across dozens of trades. A consistent 1-5 numerical scale lets the AI map emotional states to outcomes with precision.
Format for LLM Consumption
Export your data as a CSV or copy from a spreadsheet. AI handles structured tabular data far better than paragraph-style notes. Feed it in batches of 20-50 trades at a time—enough for statistical patterns to emerge, but not so much that you overwhelm the context window.
One more thing: include column headers. Sounds obvious, but we’ve seen traders paste raw numbers without labels and wonder why the AI’s analysis was confused. Give it a clean ChatGPT trading journal template format with clear headers, and the output quality jumps dramatically.
Step 2 — Sanitize Your Data Before Sharing
This is the section nobody else talks about. And honestly? It might be the most important one.
When you paste your trading journal into ChatGPT, Claude, or Gemini, you’re sending financial data to a cloud server owned by a third-party company. That data gets stored. It may get reviewed by employees. And depending on your settings, it could be used to train future AI models.

The Privacy Reality
OpenAI’s privacy documentation states that Free and Plus ChatGPT plans store your conversations, and these may be used for model training unless you manually opt out. Even with opt-out enabled, authorized employees can access conversations for abuse monitoring and legal compliance. Enterprise and API plans don’t use your data for training by default—but most retail traders aren’t on enterprise plans.
A 2026 cybersecurity review by ESET found that over 100,000 stolen ChatGPT accounts have surfaced on the dark web. Their recommendation is blunt: “Treat every prompt as potentially public.” The same report noted that financial professionals risk violating SEC and FINRA regulations by sharing client data with public AI tools.
Now, you’re analyzing your own trading data, not client data—so the regulatory angle is less relevant. But the principle stands.
The Data Sanitization Protocol
Remove before sharing:
- Brokerage account numbers
- Exact account balance or total portfolio value
- Personal identifiers (full name, email, address)
- Broker login credentials (this sounds obvious, but people do it)
- Any API keys or connected service tokens
Replace with relative values:
- Instead of “$45,000 account, risked $450” → use “risked 1% of account”
- Position sizes can stay as share counts—those don’t expose your account size
- P&L can remain in dollar terms (individual trade P&L doesn’t reveal total capital)
Keep everything else. Your trade mechanics, timing data, emotional notes, setup types, and strategy labels are all safe and essential for analysis.
How to Opt Out of Training
On ChatGPT: Settings → Data Controls → toggle off “Improve the model for everyone.” On Claude: Anthropic doesn’t use Free-tier conversations for training by default—which is worth knowing. On Gemini: Check Google’s AI data settings in your Google account.
For a deeper comparison of which LLM handles trading tasks best—including privacy differences—see our ChatGPT vs. Gemini vs. Claude for Traders comparison.
Step 3 — The Prompt Frameworks That Actually Work
Here’s the thing about ChatGPT trading journal prompts you’ll find scattered across the internet: most of them are generic. “Act as a trading coach and analyze my journal” sounds great. It produces mediocre results. The AI defaults to surface-level observations because you haven’t told it what to look for or how to think about your data.
Our team has tested dozens of prompt structures across ChatGPT, Claude, and Gemini. These four frameworks consistently produce the most useful output. We’ll share the structure and explain why each element matters—because understanding the mechanics helps you customize for your own trading style.
Framework 1: The Performance Audit
Use case: Identifying overall performance patterns across 20-50 trades.
Prompt structure:
“I’m going to share my trading journal data for the past [time period]. Analyze this data for performance patterns. Specifically calculate and report: (1) Win rate by setup type, (2) Average R-multiple by time of day, (3) Average holding time for winners vs. losers, (4) Any correlation between position size and outcome, (5) My three strongest patterns and three weakest patterns based on the data. Here is my data: [paste CSV data]”
Why it works: You’re giving the AI specific analytical tasks rather than an open-ended “find patterns” request. The numbered structure forces organized output. Asking for “strongest and weakest” patterns creates actionable categories.
What to watch for: Verify the math. Cross-check the win rate and R-multiple calculations against your own spreadsheet. AI occasionally miscounts or miscategorizes trades—especially if your data has any formatting inconsistencies.
Framework 2: The Bias Detective
Use case: Detecting cognitive biases hiding in your decision patterns.
Cognitive biases—the systematic thinking errors that distort your trading decisions—are covered in depth in our trading cognitive biases guide. This prompt isn’t about learning what biases are. It’s about catching them red-handed in your data.
Prompt structure:
“Analyze my trading journal for evidence of cognitive biases. Specifically look for: (1) Loss aversion — am I holding losing trades significantly longer than winning trades? (2) Revenge trading — do my position sizes increase after consecutive losses? (3) Recency bias — does my strategy selection change based on recent results rather than overall statistics? (4) Disposition effect — am I cutting winners short while letting losers run? (5) Overconfidence — do trades taken at high emotional confidence (4-5 rating) perform worse than trades at moderate confidence (2-3)? Provide specific trade examples from the data to support each finding. Here is my data: [paste CSV data]”
Why it works: You’re naming the specific biases to search for, which prevents the AI from giving you a generic “watch out for biases” answer. Asking for specific trade examples from your data forces evidence-based analysis rather than theoretical warnings. This is behavioral trading analysis at its most practical.
The revenge trading detection alone—correlating position size increases with prior losses—is something our team found genuinely eye-opening when we first tested it. AI caught a pattern of subtle size creep after losses that we’d completely missed on manual review.

Framework 3: The “What If” Scenario
Use case: Testing alternative decisions against your actual trades.
Prompt structure:
“Based on my trading data, run these counterfactual analyses: (1) What would my P&L look like if I had never traded during the midday session (11 AM-2 PM)? (2) What if I had used a maximum 1.5R stop on every trade instead of my actual stops? (3) What would my results look like if I only took trades rated emotional confidence 2-3 (eliminating both anxious and overconfident entries)? Show me the revised win rate, total P&L, and profit factor for each scenario. Here is my data: [paste CSV data]”
Why it works: Counterfactual analysis is incredibly powerful because it turns your journal from a historical record into a decision-testing laboratory. Most traders wonder “should I stop trading after lunch?” This prompt gives you data-driven evidence instead of a hunch.
Framework 4: The Emotional Pattern Mapper
Use case: Correlating emotional states with trade outcomes over time.
Prompt structure:
“Map the relationship between my pre-trade emotional ratings and trade outcomes. Create a breakdown showing: (1) Average P&L and win rate for each emotional rating level (1 through 5), (2) Whether emotional state at entry predicts rule adherence, (3) Any patterns in emotional ratings across the trading day (do I get more anxious/overconfident at certain times?), (4) The emotional ‘sweet spot’ — which emotional state range produces my best results. Here is my data: [paste CSV data]”
Why it works: This only works if your journal includes consistent emotional ratings—which is why Step 1 emphasized the 1-5 scale. When it works, though, it’s revelatory. Our testing consistently showed that traders perform best at moderate confidence levels (2-3 on a 5-point scale). Extreme confidence and extreme anxiety both correlate with worse outcomes. The academic research backs this up: the IUP Journal (2025) found that AI tools help traders reframe risk through data-driven analysis, reducing the emotional volatility that drives poor decisions.
Step 4 — Read AI Output Like a Pro (Not a Believer)
This is where we pump the brakes. Because everything up to this point might’ve made AI journal analysis sound almost too good. And if you walk away treating every AI insight as gospel, you’ll make a different—but equally dangerous—kind of mistake.
The research calls it automation bias: the tendency to over-rely on automated systems simply because they sound authoritative. A 2025 study published in the IUP Journal of Accounting Research found that while AI trading tools reduce loss aversion, they simultaneously create this new bias—traders trust the AI’s output without questioning it.
Here’s what we’ve learned the hard way. AI can identify trading mistakes with impressive accuracy. But it also occasionally invents statistics, miscounts trades, or presents a coincidence as a causal pattern. And it does all of this with the same confident, professional tone.
The “Trust But Verify” Checklist
Before acting on any AI journal insight:
Cross-reference the math. If the AI says your win rate on breakout trades is 62%, verify it manually. It takes two minutes and catches errors that could lead to misguided strategy changes.
Test across time periods. If AI finds a pattern in your last 30 trades, check whether it held in the 30 trades before that. Patterns that only appear in one sample are likely noise, not signal.
Watch for hallucinated specifics. AI might state “your average hold time on losing trades is 47 minutes” with total precision—but actually be estimating from incomplete data. If it sounds suspiciously exact, double-check.
Beware the “average advice” trap. LLMs draw from vast training data, which means their recommendations tend toward consensus. “Trade with the trend” and “use 2:1 risk-reward” are fine general advice but might not match your specific edge.
For a deeper look at AI hallucinations and other risks specific to traders, our Dark Side of AI Trading article covers the full landscape.

Step 5 — Turn AI Insights Into Rule Changes
This is where AI journal analysis either becomes transformative or joins the graveyard of tools you tried once and forgot about. The difference? A structured process for converting insights into actual rule changes.
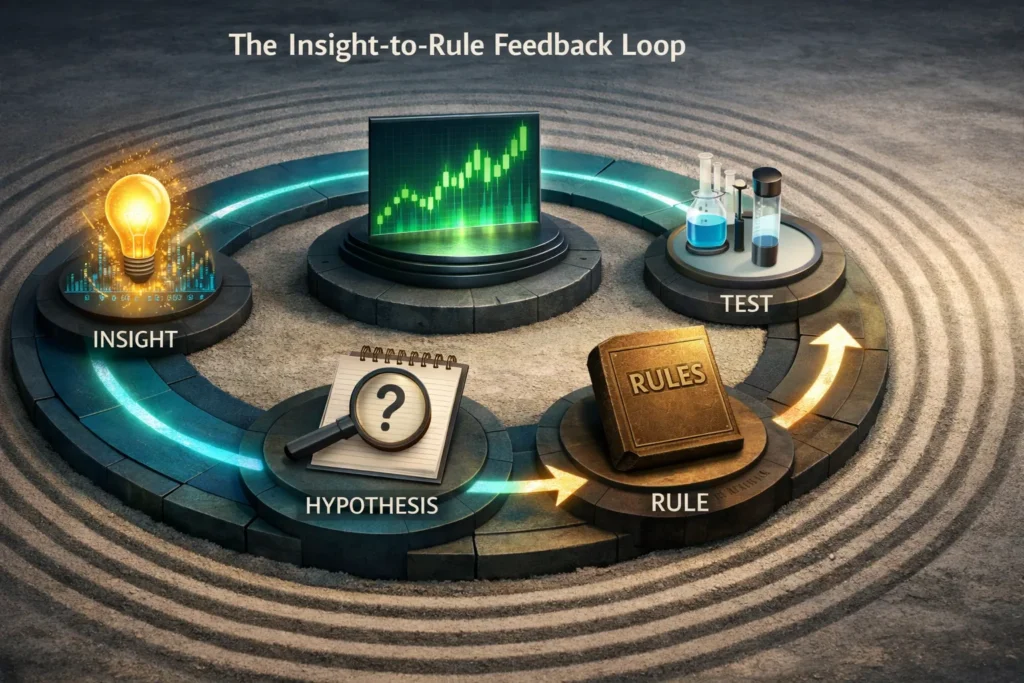
We use a simple four-step framework:
Insight → Hypothesis → Test → Rule
Here’s how it looks in practice. Say AI analysis reveals that your P&L is significantly negative on trades taken between 11 AM and 1 PM, while your morning session is strongly profitable.
Insight: “Midday trades lose money consistently.”
Hypothesis: “Fatigue and midday chop are degrading my decision quality after the morning session.”
Test: For two weeks, paper trade (or significantly reduce size on) midday trades while maintaining normal morning trading. Compare results to the AI’s prediction.
Rule: If the test confirms the pattern, add a hard rule: “No new positions between 11 AM and 1 PM unless an A+ setup on the primary watchlist.”
Now here’s the important part—log this rule change back into your journal. Note the date you implemented it and why. This creates a feedback loop. Next month, when you run another AI analysis, you can specifically ask: “Compare my performance metrics before and after implementing my midday trading rule on [date].”
That’s how you build a genuine improvement cycle. Not a one-time AI review, but an ongoing dialogue between your trading data, AI pattern recognition, and your evolving rule set.
For deeper methodology on refining your strategy based on data, our Building Your Edge: Strategy Development guide covers the full process.
Free LLMs vs. Dedicated AI Journal Software: Which Do You Need?
This is the question our team gets asked most about AI trading journal analysis: “Should I just use ChatGPT, or do I need to pay for journal software?”
The honest answer is that they do different jobs. Here’s the breakdown:
| Factor | Free LLMs (ChatGPT/Claude/Gemini) | Dedicated Software (TraderSync, Edgewonk) |
|---|---|---|
| Cost | Free or ~$20/mo for premium | $30-80/mo |
| Auto-import | No — manual CSV export required | Yes — imports from 900+ brokers |
| Real-time tracking | No | Yes |
| Custom analysis depth | Unlimited prompt flexibility | Pre-built reports and dashboards |
| Privacy | Data may be stored/used for training | Your data stays on their servers |
| “What if” scenarios | Excellent — natural language queries | Limited to built-in filters |
| Bias detection | Strong — custom prompts for behavioral analysis | Basic — pre-built behavioral tags |
| Best for | Deep qualitative analysis, pattern detection, counterfactual scenarios | Daily automated tracking, visual dashboards, workflow integration |
Our recommendation? Use both. They complement each other perfectly.
Use dedicated journal software—TraderSync is our team’s pick for its broker compatibility and reporting depth—as your daily tracking workhorse. It auto-imports trades, calculates your metrics in real time, and gives you visual dashboards you can glance at daily.
Then, once a month, export your data and run it through an LLM for the deeper analysis. The bias detection, the “what if” scenarios, the emotional pattern mapping—that’s where the LLMs shine because you can ask any question in natural language rather than being limited to pre-built reports.
It’s the difference between having a dashboard (dedicated software) and having a conversation with an analyst (LLMs). You need both.
What AI Journal Analysis Gets Wrong (The Honest Limitations)
We wouldn’t be doing our job if we ended on pure optimism. AI trading journal analysis has real, meaningful limitations—and understanding them is what separates productive use from dangerous over-reliance.
AI can’t judge setup quality from text alone. You can describe a “breakout trade on AAPL” in your journal, but the AI wasn’t watching the chart. It doesn’t know the volume was thin, or that the breakout happened right into overhead supply. Qualitative trade quality assessment still requires your eyes and experience.
AI doesn’t understand market regime context. If you had a terrible month during a brutal, choppy tape—and every strategy suffered—the AI might flag your “declining win rate” as a personal execution problem. You need to layer in your own understanding of what the market was doing to properly interpret AI findings.
The “average advice” problem is real. LLMs are trained on broad data. Their suggestions trend toward conventional wisdom. “Use tighter stops” and “reduce position size” are safe recommendations, but they might not match your specific edge. A scalper’s optimal stops look very different from a swing trader’s.
Emotional notes are only as good as your honesty. If you consistently rate yourself “3/5 — calm” when you were actually stressed, the AI’s emotional correlation analysis will be meaningless. The Behavioral Mirror only works if you’re honest about what you put in front of it.
AI identifies what but often not why. It can detect that you deviate from your rules every Thursday afternoon. It can’t tell you that it’s because your weekly team meeting stresses you out and you compensate by overtrading. The deeper psychological work still belongs to you—or to a qualified trading coach.

For the full breakdown of AI risks in a trading context, including hallucinations and the broader “dark side,” see our comprehensive AI trading risks article.
Frequently Asked Questions
Can ChatGPT really find patterns in my trading journal?
Quick Answer: Yes—but only if you feed it structured data and ask specific questions. Generic prompts produce generic insights.
ChatGPT excels at processing structured tabular data (CSV exports) and identifying statistical patterns like win rate by setup type, time-of-day performance, and correlations between emotional states and outcomes. A 2025 review in SN Business & Economics confirmed that AI algorithms successfully detect cognitive biases including overconfidence and loss aversion from trading records. The key is specificity in your prompts. “Analyze my journal” produces fluff. “Calculate my average R-multiple by time of day and flag any correlation between position size increases and prior losses” produces actionable insight.
Key Takeaway: Structure your data and your questions—then AI pattern recognition becomes genuinely powerful.
What data should I include when sharing my journal with AI?
Quick Answer: Include all trade mechanics (entry, exit, size, P&L), setup type, market conditions, and emotional ratings. Remove personal identifiers and account numbers.
The minimum viable dataset includes: date, time, ticker, direction, entry/exit prices, position size, stop-loss, P&L, and R-multiple. For deeper behavioral analysis, add emotional state ratings (1-5 scale), setup type labels, rule adherence notes, and market condition tags. The more consistent your data formatting, the better the AI’s analysis quality.
Key Takeaway: Quantitative trade data plus consistent emotional ratings equals the richest possible AI analysis.
Is it safe to share my trading data with ChatGPT?
Quick Answer: Reasonably safe if you sanitize personal identifiers and adjust privacy settings—but never share account numbers, passwords, or exact account balances.
Free ChatGPT plans store conversations and may use them for training unless you opt out. Over 100,000 compromised ChatGPT accounts have been found on the dark web. The practical rule: treat every prompt as potentially public. Remove account numbers and personal identifiers, use relative values (percentages) instead of exact dollar balances, and toggle off data-sharing in your settings.
Key Takeaway: Sanitize first, share second. Your trade mechanics are safe to share—your personal financial details are not.
Should I use ChatGPT or dedicated journal software like TraderSync?
Quick Answer: Ideally both. They serve different purposes—dedicated software for daily tracking, LLMs for periodic deep analysis.
Dedicated platforms like TraderSync auto-import trades from 900+ brokers and provide real-time dashboards with pre-built performance metrics. LLMs offer unlimited flexibility for custom analysis—bias detection, “what if” scenarios, and emotional pattern mapping that pre-built reports can’t match. Our team uses dedicated software daily and runs monthly LLM deep dives on exported data.
Key Takeaway: Dedicated software handles the tracking. LLMs handle the thinking. Use both for the best results.
Can AI detect emotional trading mistakes in my journal?
Quick Answer: Yes, but only if your journal includes consistent emotional data—like a 1-5 rating scale before and during each trade.
AI correlates your emotional ratings with trade outcomes to reveal patterns you’d miss manually. Common findings include: overconfident entries (rating 5) underperforming moderate-confidence entries (rating 2-3), elevated position sizes following emotional distress, and rule deviations clustering around specific emotional states. The academic evidence supports this—research confirms AI reduces the impact of loss aversion by reframing risk through data analysis.
Key Takeaway: Your emotional notes are the secret weapon. Rate yourself honestly and consistently—AI does the correlation work.
What are the best prompts for analyzing a trading journal with AI?
Quick Answer: Use specific, structured prompts that name exactly what you want analyzed—not generic “review my trades” requests.
The four frameworks in this article—Performance Audit, Bias Detective, “What If” Scenario, and Emotional Pattern Mapper—each target different analytical dimensions. The key principle across all of them: number your requests, name specific metrics, and ask for evidence from your data. Our ChatGPT day trading guide covers broader prompt strategies beyond journal analysis.
Key Takeaway: Specificity is everything. The more precise your prompt, the more actionable the output.
How accurate is AI at analyzing trading performance?
Quick Answer: Highly accurate for pattern detection and statistical analysis, but prone to occasional calculation errors and “hallucinated” specifics that require verification.
AI reliably identifies statistical patterns across large datasets—correlations, averages, and trend analysis. Where it falters: it occasionally miscounts trades, invents precise-sounding numbers, and can’t assess qualitative factors like chart setup quality. A Federal Reserve paper (2025) noted that LLMs themselves can exhibit confirmation bias in financial analysis, potentially reinforcing your existing beliefs rather than challenging them.
Key Takeaway: Always cross-reference AI calculations with your own spreadsheet. Trust the patterns, verify the numbers.
Can AI replace a trading coach or mentor?
Quick Answer: No. AI is an excellent analytical tool, but it can’t provide the contextual understanding, accountability, or psychological support of a human coach.
An AI can tell you that you revenge trade after losses. A coach can help you understand why—and work through the deeper psychological patterns driving the behavior. AI can calculate that your midday trades lose money. A coach can observe your screen, your body language, and your decision-making process in real time. Think of AI as a powerful diagnostic tool. The treatment still benefits from human expertise.
Key Takeaway: Use AI for data-driven diagnosis. Seek human guidance for the psychological and behavioral work.
What are the limitations of using AI to review my trades?
Quick Answer: AI can’t judge chart setup quality, doesn’t understand market regime context, trends toward generic advice, and is only as good as the data you provide.
The biggest limitation is context. AI reads your journal entries in isolation—it wasn’t watching the tape, feeling the market sentiment, or understanding why that particular breakout “felt different.” It also can’t distinguish a bad trade from a good trade that happened to lose in an unfavorable market environment. These contextual layers remain squarely in the human domain.
Key Takeaway: AI surfaces patterns in your data. Interpreting those patterns within market context is your job.
How often should I run AI analysis on my journal?
Quick Answer: Monthly for comprehensive reviews, with quick weekly check-ins if you’re actively refining a strategy or testing new rules.
Monthly analysis gives you enough data (typically 40-80+ trades for active day traders) for meaningful pattern detection. Weekly check-ins work well when you’ve recently implemented a rule change and want to track its early impact. Avoid over-analyzing—reviewing every single day’s trades through AI creates noise and encourages over-optimization. Let the patterns develop over a meaningful sample size.
Key Takeaway: Monthly deep dives produce the best signal-to-noise ratio. Weekly only when testing specific changes.
Disclaimer
The information provided in this article is for educational purposes only and should not be considered financial advice. Day trading involves substantial risk and is not suitable for every investor. Past performance is not indicative of future results.
For our complete disclaimer, please visit: https://daytradingtoolkit.com/disclaimer/
Article Sources
This article was built on research from the following authoritative sources, supplemented by our team’s direct testing of AI journal analysis workflows across ChatGPT, Claude, and Gemini.
- Artificial Intelligence in Behavioral Finance: A Global Review of Cognitive Bias Modeling in Investor Decision-Making — Şeker et al. (2025), SN Business & Economics. Comprehensive literature review confirming AI’s ability to detect cognitive biases from trading records and behavioral data.
- Financial Stability Implications of Generative AI — Federal Reserve Staff Paper (2025). Research on LLM behavior in financial contexts, including evidence that LLMs exhibit biases such as confirmation bias in investment decisions, and data on LLM adoption rates in finance.
- Influence of AI Trading Tools on Cognitive Biases and Investor Behavior: An Exploratory Study — IUP Journal of Accounting Research & Audit Practices (2025). Study demonstrating AI tools reduce loss aversion while creating new automation bias risks.
- Security and Privacy at OpenAI — OpenAI (2026). Official documentation on data handling, training data policies, and enterprise privacy standards for ChatGPT.
- Is ChatGPT Safe? The Complete 2026 Security & Privacy Guide — ESET (2026). Independent cybersecurity analysis of ChatGPT data practices, privacy risks, and recommendations for financial professionals.
- 5 Best Trading Journals for 2026 — StockBrokers.com (2026). Independent evaluation of trading journal platforms including auto-import capabilities, performance metrics depth, and AI features.


